Evolutionary Bioinformatics
O riginal R esearch
Open Access Full open access to this and thousands of other papers at http://www.la-press.com.
A Clustering Optimization Strategy for Molecular Taxonomy Applied to Planktonic Foraminifera SSU rDNA Markus Göker1, Guido W. Grimm2, Alexander F. Auch3, Ralf Aurahs4 and Michal Kučera4 German Collection of Microorganisms and Cell Cultures (DSMZ), Inhoffenstraße 7B, 38124 Braunschweig, Germany. Swedish Museum of Natural History, Box 50007, Stockholm, Sweden. 3Center for Bioinformatics Tübingen, Eberhard Karls University of Tübingen, Sand 14, 72076 Tübingen, Germany. 4Institute of Geosciences, Eberhard Karls University of Tübingen, Sigwartstraße 10, 72076 Tübingen, Germany. Corresponding author email:
[email protected] 1 2
Abstract: Identifying species is challenging in the case of organisms for which primarily molecular data are available. Even if morphological features are available, molecular taxonomy is often necessary to revise taxonomic concepts and to analyze environmental DNA sequences. However, clustering approaches to delineate molecular operational taxonomic units often rely on arbitrary parameter choices. Also, distance calculation is difficult for highly alignment-ambiguous sequences. Here, we applied a recently described clustering optimization method to highly divergent planktonic foraminifera SSU rDNA sequences. We determined the distance function and the clustering setting that result in the highest agreement with morphological reference data. Alignment-free distance calculation, when adapted to the use with partly non-homologous sequences caused by distinct primer pairs, outperformed multiple sequence alignment. Clustering optimization offers new perspectives for the barcoding of species diversity and for environmental sequencing. It bridges the gap between traditional and modern taxonomic disciplines by specifically addressing the issue of how to optimally account for both genetic divergence and given species concepts. Keywords: automated taxonomy, linkage clustering, parameter optimization, planktonic foraminifera, SSU rDNA
Evolutionary Bioinformatics 2010:6 97–112 This article is available from http://www.la-press.com. © the author(s), publisher and licensee Libertas Academica Ltd. This is an open access article. Unrestricted non-commercial use is permitted provided the original work is properly cited. Evolutionary Bioinformatics 2010:6
97
Göker et al
Introduction
A reliable taxonomy is crucial for the assessment of biodiversity and for the comparison of habitats based on their species composition. However, delimiting taxa is challenging in the case of organisms for which (almost) exclusively molecular data are available, even in the case where robust phylogenetic hypotheses can be inferred. For the species delimitation in microorganisms such as bacteria, fungi, and many other unicellular eukaryotes, only few diagnostic characters may be present, and an increasing number of such organisms are only known by their DNA sequences.1–9 Even in the case of organisms with well-established phenotypic characteristics, molecular taxonomy is necessary to validate established species concepts and identify those that require a taxonomic revision. Molecular data are also essential to detect so-called cryptic species (or pseudocryptic species),10 ie, species for which no morphological differences exist (or have not been determined so far). Finally, molecular taxonomy is needed to analyze sequences that have been directly sampled from their natural environment, eg, in the context of metagenomics projects.11,12 Despite its obvious utility in a number of cases, the entire concept of molecular taxonomy has been intensively debated in the literature, particularly regarding DNA barcoding.13–18 The basic question is, whether or not morphological and molecular data can be combined in an objective and reproducible way for taxonomic purposes. Is it possible to devise tools for (molecular) identification of taxonomic units that reflect morphology-based taxonomic concepts? For sequence data-based species delimitation, researchers mostly use a predefined threshold T for pairwise genetic distances in clustering algorithms to assign sequences to molecular operational taxonomic units.1–3,5,8,9 Values of T used for clustering differ in literature, even if applied to the same groups of organisms and molecular markers,4,6,7,9 and are often based on subjective criteria or on a recently emerged tradition for the sake of comparability between studies. However, the number and the content of the obtained clusters greatly varies with T (see19 and below). In addition to T, the clustering algorithm also affects the circumscription and the shape of the clusters formed.20(192) In the context of linkage clustering, a link is defined as a pairwise distance shorter than or equal to the chosen threshold T. To add a new 98
object to a given cluster one can either request that at least one distance to the cluster member is a link (single linkage; F = 0.0) or that all distances are links (complete linkage; F = 1.0), or any proportion F of the distances between (see overview in).20 However, F has hardly been addressed in the recent literature on molecular taxonomy. For instance, Meier et al21 regarded the clustering of triplets of sequences as “logically inconsistent” if only two of the three distances are links. However, values of F smaller than 1.0 are well established in the clustering literature.19 An apparent solution for this inconsistency was to explicitly specify F.19 For a given T mean and maximum within-cluster distances may be much larger for small values of F,20(192) even though this becomes relevant in cases where genetic divergence differs between morphologically defined lineages.22 Methods more advanced than linkage clustering have been suggested,23,24 but these focus on identification, ie, the assignment of query sequences to predefined groups, and thus require a correct reference taxonomy. However, misidentifications even of organisms with well-established microscopical characteristics are possible, and sequences in public databases are frequently mislabeled.25 Thus, it is obvious that methods are needed that can adapt molecular taxonomy to reference data based on traditional taxonomy, without requiring that the latter is 100% correct. A recently introduced method, clustering optimization,19 allows one to obtain taxonomic units from non-hierarchical clustering that are in optimal agreement with a given reference dataset. Reference data can be derived from traditional taxonomy. For instance, the morphology-based species identification of specimens results in a partition, ie, a non-overlapping, non-hierarchical division, of the objects (specimens). In fact, every biological classification which comprises only a single taxonomic rank represents a partition. Because the non-hierarchical clustering of the sequences also results in a partition, a metric for the disagreement between two partitions allows one to determine those clustering parameters T and F that result in the highest agreement between the clustering partition and the reference data. Because clustering optimization does not require full agreement between the partitions, is it suitable for biological datasets in which the reference partition may contain errors due to misidentification or current taxon boundaries that do not fully reflect the Evolutionary Bioinformatics 2010:6
Optimal taxonomy of planktonic foraminifers
natural history of the organisms. This principle can be extended to more than two parameters to be optimized, for instance by also optimizing the inference of the distance matrix to which the clustering is applied. Calculating distances may be difficult because of alignment ambiguity,26,27 particularly in the case of highly divergent markers. For example, in the case of our target organisms, planktonic foraminifera, approximately 50% of the 3’ part of the small subunit ribosomal DNA (SSU rDNA) represented in most published fragments can be aligned across all lineages but comprise limited phylogenetic signal; the signal contained in the highly length-polymorphic, extremely divergent and generally “nonalignable” regions of the multiple sequence alignment (MSA) is lost.28 MSA-free sequence comparison methods have been suggested (which may be based on pairwise alignment).29–31 Even though some of them are very fast, they have never been used in molecular taxonomy. This is despite the advantages of such methods in an era of rapidly advancing DNA sequencing technologies and the thus exponentially increasing amount of molecular data.32 Modern planktonic foraminifera (PF) are classified into about 50 species based on the morphology of their calcite shells (termed “morphotaxonomy” in the following), so that the paleontological taxonomy of this group is consistent with that of the living species.33 Their shells accumulate in huge quantities on the sea floor making their fossil record one of the most complete and continuous of all organisms and PF one of the most important proxies in paleoclimatology (eg,).34,35 However, proxies for past-ocean properties are empirically derived and require speciesspecific calibrations. Therefore, correct assessment of species taxonomy, ecology and biogeography is essential for reliable reconstructions. PF SSU rDNA is characterized by generally higher substitution rates than in many other groups, making it, unusually, a suitable marker for genetic diversity below the level of morphological species (eg,).36 The distinct genetic types found within many PF morphospecies (reviewed in)37–39 could be considered as biological species, since they do not show any signs of introgression or interbreeding, and are often restricted to certain oceanic regimes and areas.38,40–42 However, until now this cryptic diversity has been used to arbitrarily define and label “genotypes” (eg,).37 Because established Evolutionary Bioinformatics 2010:6
morphospecies are not genetically uniform, there is an urgent need for standardization. We here apply clustering optimization in three dimensions (T, F, and distance function) to PF SSU rDNA sequences and their currently accepted taxonomy. To cope with alignment ambiguity, we apply MSA-free distance methods, which we improve for use with partial sequences. Optimal settings for both clustering parameters and distance functions are then used to define taxonomic units. As in a previous study,19 resampling and permutation techniques are applied to determine the robustness of the optimization regarding taxon sampling and errors in the reference partition. The outcome is discussed regarding current species concepts for PF and the general applicability of our methods for combining morphological and molecular data in an objective and reproducible way for taxonomic purposes and for automated, sequence-based identification.
Material and Methods Data sources and data preparation
The dataset comprised 299 (mostly partial) sequences from the 3’ end of the PF SSU rDNA. 146 of these sequences were recently published and have been obtained from specimens collected in the Northeast Atlantic Ocean and the Mediterranean Sea in the course of the study of Aurahs et al28 The remaining ones were downloaded on 28/01/2008 from the GenBank database (http://www.ncbi.nlm.nih.gov/). Taxonomic information for clustering optimization was extracted from the GenBank flat files using the program GBK2FAS,19 which is freely available at http://www. goeker.org/mg/clustering/. To optimize for the agreement with morphotaxonomy, the species affiliations of corresponding specimens were taken as reference partition. The PF taxonomy used in the “organism” identifiers of the GenBank accessions follows morphotaxonomy, with two exceptions. In the case of Globigerinella siphonifera and Orbulina universa s.l. (including “Orbulina sp.”), a unique “organism” is not present, but highly similar or identical sequences are partly denoted with different names for genotypes (G. siphonifera) or individuals (Orbulina) although they belong to the same morphospecies in the original literature.38,41,43 Vice versa, some “organism” names include significantly divergent SSU fragments. Therefore, to obtain a reference partition consistently 99
Göker et al
based on morphospecies, we assigned these accessions to either “G. siphonifera” or “Orbulina sp.” The downloaded GenBank data contained 60 distinct “organism” names, which we corrected down to 23 distinct morphospecies by removing the parts after the epithet. The morphotaxonomic reference data of the 146 specimens published in28 relies on the expertise of the original collectors. The total reference partition comprised 27 reference taxa, as documented in detail in the electronic supplementary material (ESM; File 1).
Distance calculation
Distances between SSU rDNA sequences were computed using the MSA-free method GBDP (“genome BLAST distance phylogeny”),44–46 which had been applied to whole genomes of prokaryotes45,46 and organelles44 and here was adapted for use with single sequence regions (“gene BLAST distance phylogeny”). GBDP applies BLAST47 to identify local regions of high sequence similarity, “high-scoring segment pairs” (HSPs), between two sequences. Among the formulae for inferring distances from BLAST results44–46 the following one performed best in recovering evolutionary relationships:44,46
D( x, y ) : =1-
I xy + I yx
λ ( x, y )
(1)
D(x,y) denotes the distance between sequences x and y, and Ixy denotes the sum of the number of identical base pairs over all HSPs obtained by using x as the query and y as the subject sequence for blast. In the case of whole genomes, the denominator λ(x,y) can correspond to the average length of both sequences45 (Formula 2), but here was corrected for the use with single gene regions. MSA-independent phylogenetic inferences can suffer from limitations that are not present in MSAbased approaches. Most importantly, evolutionary relationships should be inferred from homologous characters only (48(96),49(63),50(120) among others). Let “fragment homology” denote the situation in which two sequence fragments are, as a whole, homologous to each other. In the case of MSA, fragment homology is established implicitly by establishing the homology of individual nucleotide (or amino acid) residues and 100
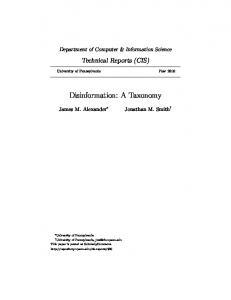
their non-homology by the insertion of gaps. Although single-gene data have been amplified from homologous gene regions, they can violate the fragment homology condition. For instance, Figure 1 shows three HSPs (gray boxes) between sequences x and y. While nucleotide (or amino acid) homology is established within these HSPs, the fragment homology of a non-HSP region enclosed between two adjacent HSPs is established as long as the insertion of, eg, a novel protein domain can be ruled out. In the case of foraminifer SSU rDNA, regions between HSPs are, of course, much more likely do be due to high evolutionary rates.28,36,51 In contrast, leading and trailing non-HSP regions may as well be caused by the use of distinct primer pairs; fragment homology is not necessarily given in this case. Leading and trailing gaps in an alignment often represent missing data and not evolutionary events.52 Because MSA-independent methods treat entire sequences as single characters, fragment homology is likely to matter. The robustness of MSA-free sequence comparison against the violation of the fragment homology assumption has, to the best of our knowledge, not yet been examined in simulation or empirical studies. The problem is also present in PF SSU data; for instance, most short amplicons of “Orbulina sp.” from GenBank corresponded only to parts of the few long amplicons of “Orbulina universa”. To correct for a potential length artifact on D(x,y), two modifications of the denominator λ(x,y) in
x
fx
y f F y y
Fx
Lx lx
Ly
ly
Figure 1. Corrected alignment-free distance formulae. Notes: How to correct GBDP for the violation of fragment homology (trimmed sequence ends). Symbols used: x and y, sequences; grey boxes, location of HSPs; fx, first position; Fx, first position within the first HSP; Lx, last position within the last HSP; and lx, globally last position, within sequence x; fy, Fy, Ly, and ly are defined analogously. Without background information, fragment homology is only established explicitly between the Fx - Lx part of x and the Fy - Ly part of y. If the sequences violate the fragment homology condition, using the full sequence lengths in the denominator (λ0; Formula 2) will thus overestimate the number of base pairs that can be compared in a biologically meaningful way. The corresponding distances that use λ0 will thus be overestimated (Formula 1). The modifications of the denominator in formulae 3 and 4 correct the distances that use λ1 and λ2 downwards.
Evolutionary Bioinformatics 2010:6
Optimal taxonomy of planktonic foraminifers
Formula 1 (see also Formula 2) were applied (Fig. 1; Formulae 3 and 4). The uncorrected mean length λ0 of two sequences, x and y, is given by:
λ 0 ( x, y ) : =1 -
lx + l y 2
(2)
which has been applied to complete genomes. We hypothesize that this denominator must be corrected downwards in the case of strong deviations from fragment homology because otherwise the range of base pairs that can be compared in a biologically sensible way is overestimated.44–46 Correction λ1 is shown in Formula 3:
λ1 ( x, y ) : =
Lx - Fx + Ly - Fy 2
+1
(3)
The meaning of Lx and Fx is explained in Figure 1. That is, the lengths of the fragment-homologous parts of the sequences are estimated as the range between the first position in the first HSP and the last position in the last HSP (inclusively). Here, character homology, which is established within HSPs, is used to estimate the homology of whole sequence fragments (both within and outside HSPs). Formula 4 introduces a correction (λ2), which is intermediary between Formulae 2 and 3:
λ 2 ( x, y ) : =
Lx - Fx + Ly - Fy
+1 2 + min( Fx , Fy )+ min(lx - Lx , l y - Ly ) (4)
Here, the shorter of the sequence sections before the first HSP in each sequence is considered as part of the homologous fragment, as well as the shorter of the sequence sections after the last HSP (see Fig. 1). Importantly, we here do not attempt to demonstrate that the above-mentioned formulae necessarily result in distance metrics in a mathematical sense; for instance, they might violate the triangle inequality.53 However, the same holds for distances derived from MSA, which apparently does not limit their usability for phylogenetic inference.54(158) W. Gish’s implementation of BLAST (http://blast.wustl.edu/) was run with a word length of 4 and without the use Evolutionary Bioinformatics 2010:6
of the low-complexity filter. The GBDP program is freely available at http://www.auch-edv.de/GBDP/. The eleven MSAs from Aurahs et al28 were used, inferred with six different software packages, CLUSTALW version 2.0,55,56 KALIGN v. 2.03,57 MAFFT v. 6.24,58 MUSCLE v. 3.7,59 the NRALIGN derivative of MUSCLE,60 and POA v. 2.0,61 using the respective default parameters. POA was also run in global scoring mode (command-line switch -do_global; henceforth referred to as POAGLO), CLUSTALW also with the gap parameters optimized for RNA alignments (abbreviated CLWOPT),62 and MAFFT also in EINSI, GINSI and LINSI running modes. Distances were inferred from the alignments with PAUP* version 4b10,63 using the following formulae: uncorrected (“P”) distances; JC; F81; K2P; F84; K3P; TamNei; GTR; and LogDet (see64 for a survey of these distance methods). As far as possible (ie, except for P and LogDet distances), we combined the formulae not only with equal, but also with gamma (Γ) distributed substitution rates, using an alpha parameter of 0.5.64 Distances were also calculated under the maximum likelihood (ML) criterion with RAxML version 7.0465,66 and GTR+Γ as model. Accordingly, 198 MSA-based distance approaches were subjected to clustering optimization in the same way as the GBDP formulae.
Clustering optimization
Clustering optimization was conducted as previously described19 and as implemented in the program OPTSIL, freely available at http://www.goeker.org/mg/ clustering/. Values of T and F were varied between 0.0 and 1.0, with a step width of 0.0001 (T) or 0.05 (F), and the resulting agreement with the reference partition, measured using the Modified Rand Index (MRI), was recorded. Cluster affiliations from the globally optimal clustering were mapped on a NJ67 tree inferred from the best distances with PAUP* version 4b10.63 To assess the stability of our method, we applied taxon jackknifing.19 Within each jackknifing replicate, a defined proportion of randomly selected sequences is removed before optimizing the parameters. We here assessed removal of 5% to 50% of the sequences, using a step width of 5%, and reported the respective range of optimal clustering parameters. In theory, each resulting cluster defines a TU equaling a morphospecies. However, because 101
Göker et al
of limitations in distance calculation, considerable difference in genetic divergence between the morphospecies, or misidentification or mislabeling of specimens, even the optimal MRI may not achieve 1.0. In this context, it is of interest how robust optimization is against errors in the reference partition.19 To assess this effect, we introduced a defined proportion of randomly selected errors (between 5% and 50%, step width was 5%) in the morphotaxonomy-based partition before re-optimizing the parameters. 1,000 replicates per proportion were run, and the range of optimal clustering parameters was reported for each replicate. Whereas phylogenetic trees are nested classifications and thus can neither be directly compared to nor replace a non-hierarchical clustering to define TU, it is of course of interest whether the inferred TU are monophyletic in a tree.48 We thus compared the final TU and the morphotaxonomy with conventional MSA-based phylogenetic analysis, ie, with a tree inferred under the ML criterion (GTRMIX model approximation) with RAxML version 7.0465,66 from a MSA obtained with MAFFT version 6.2458 without further manual refinement or manual exclusion of columns. This tree was the most representative one in our recent study,28 which explicitly addressed the effect on phylogenetic reconstruction of using distinct MSAs of full (unfiltered) SSU rDNA sequences (the eleven ones used here for distance calculation, see above and refs.).27,68 Node support was established with 100 RAxML bootstrap replicates; for details of all eleven MSAs and ML analyses, see ref.28
Results Taxonomic units based on threedimensional clustering optimization
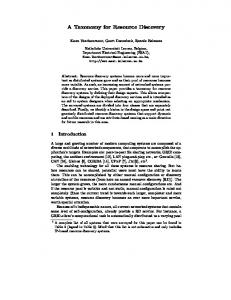
An overview of the results from clustering optimization of the distinct distance matrices is provided in Table 1. Three-dimensional optimization resulted in the following two optimal parameter combinations: λ1-corrected GBDP distances, F = 0.75, T = 0.25735, and F = 0.70, T = 0.25475, which gave identical results and corresponded to a Modified Rand Index (MRI) of 0.8001 and 22 different clusters. The optimization plot for the optimal values of F and distance formula but varying T is shown in Figure 2; the full results are included in the ESM (File 1). An accordingly annotated
102
neighbor-joining (NJ) phylogram based on λ1-corrected distances is shown in Figure 3. The highest MRI (ie, best agreement with the reference partition) obtained with an MSA-based method was 0.7843 from the combination of POAGLO alignment, TamNei distances and equal substitution rates (Table 1). λ2-corrected GBDP distances also performed better than any alignment software (MRI = 0.7878). In the optimal partition inferred from λ0-distances (MRI = 0.7744), short SSU rDNA fragments tended to form new clusters; otherwise the same TU were obtained as with λ1-distances (not shown). In addition to the MRI, a direct comparison might also illustrate the effect of the distance correction (for the data, see ESM, File 1). From a total of 44,551 (non-trivial) distances, λ1-distances were as large as λ0-distances in 2098 cases but shorter in 42,453 cases; λ2-distances were as large as λ0-distances in 2202 cases but shorter in 42,349 cases. A total of 129 distances were zero in the case of λ1 but non-zero with λ0, whereas 126 distances were zero in the case of λ2 but non-zero with λ0. One of the most striking examples is the sequence pair Orbulina universa (AF102229; 955 base pairs) vs. Orbulina sp. ‘isolate A492’ (AJ229093; 434 base pairs), whose distance is 0.37509 with λ0 but 0.0 with either λ1 or λ2. The effect of applying suboptimal T values to λ1-distances on the TUs MAC-A/MAC-B and SIP-A/ SIP-B is shown with figures in the ESM (File 2). The clusters inferred with the optimal parameters, each defining a TU, matched largely the assigned morphospecies (Figs. 3, 4; Table 2); exceptions are two clones with missing data (a large number of N’s) in the middle of the sequence (Cluster 1, Cluster 5; Fig. 3). Misidentified sequences were identified and the affiliation of sequences with ambiguous morphological reference (eg, Globigerina sp. and Orbulina sp., GenBank data; “undetermined spinose”, new data) was clarified. Seven clusters included more than one reference taxon, and four to six morphotaxa (depending on the underlying taxonomic concept; Table 2) comprised more than one TU. Morphotaxa combined in a single cluster are the nonspinose macroperforate species Globorotalia inflata and Neogloboquadrina pachyderma (s.str.; MAC-A) as well as N. dutertrei and Pulleniatina obliquiloculata (MAC-B). The spinose Globigerinoides ruber, Globigerinella siphonifera, Hastigerina pelagica
Evolutionary Bioinformatics 2010:6
Optimal taxonomy of planktonic foraminifers Table 1. Optimal clustering results in dependence on the distance formula. Alignment/ alignment-free approach
Best alignment-based distance formula
Best threshold (T )
Best linkage fraction (F )
Highest MRI
Mean MRI
GBDP, uncorrected (λ0) GBDP, corrected (λ1) GBDP, corrected (λ2) clustalw clwopt
∼
0.27295
0.05
0.77440
0.74153
∼
0.25475/0.25735
0.70/0.75
0.80006
0.77958
∼
0.12705
0.00
0.78781
0.77282
F84+G F81+G/TamNei+G
0.40/0.45 0.25/0.35/ 0.40/0.45/ 0.50/0.30
0.77177 0.76263
0.73574 0.73247
einsi
GTR/GTR+G/TamNei/ TamNei+G
0.15/0.20/ 0.25/0.30/ 0.35/0.40/ 0.10
0.75983
0.72110
ginsi kalign
GTR+G RAxML/F81/F81+G/F84/ F84+G/GTR/GTR+G/JC/ JC+G/K2P/K2P+G/K3P/ K3P+G/LogDet/TamNei/ TamNei+G
0.39070/0.40250 0.37270/0.38265/0.38330/ 0.38690/0.38800/0.40380/ 0.40525/0.40670/0.40805/ 0.41165 0.10300/0.10490/0.10935/ 0.11420/0.11615/0.12260/ 0.12125/0.12340/0.12955/ 0.13600/0.13860/0.14860/ 0.11355/0.11550/0.12190/ 0.11560/0.12145/0.12785/ 0.13360/0.13650/0.14565000 0.70360 0.06205/0.05910/0.06410/ 0.05915/0.06420/0.05950/ 0.06560/0.06405/0.05920/ 0.06430/0.05785/0.05680/ 0.064450
1.00 0.00
0.76705 0.77756
0.72616 0.75664
linsi
GTR/GTR+G/LogDet/ TamNei/TamNei+G
0.35/0.40/ 0.45
0.73862
0.71920
mafft
P/TamNei
0.76322
0.73867
muscle nralign
TamNei F81/F84/GTR+G/JC/ JC+G F81+G/JC/JC+G/K2P/ K2P+G/K3P/TamNei+G
0.25/0.35/ 0.40 0.15 0.15
0.74915 0.76217
0.70428 0.71718
0.10
0.76758
0.73450
0.10
0.78435
0.71880
poa poaglo
TamNei
0.12520/0.12625/0.12955/ 0.15285/0.15495/0.15805/ 0.12365/0.12465/0.12440/ 0.12525/0.14930/0.15090/ 0.15540000 0.10545/0.12495/0.131550 0.17965 0.16595/0.16600/0.21925/ 0.16575/0.20845 0.16755/0.13815/0.16710/ 0.13830/0.16765/0.13840/ 0.16870 0.13610
Note: Highest MRI and corresponding best values of T and F for the MSA-based and GBDP distance functions. For each GBDP formula, the arithmetic mean over all F values is also indicated and for each MSA the mean over all F values and distance formulae.
and Turborotalita quinqueloba, and the microperforate Globigerinita uvula formed two TU, respectively (Fig. 4; Table 2). The two N. pachyderma TU confirm the taxonomic amendment by Darling et al69 and refer to the coiling types dextral, assigned by Darling et al to the species N. incompta (INC in Fig. 3),69 and sinistral, ie, N. pachyderma s.str. (included in MAC-A; Figs. 3, 4; Table 2).
Evolutionary Bioinformatics 2010:6
Robustness of clustering optimization
Results from taxon jackknifing and from random permutations of the reference partition are included in the ESM (File 3). The optimal F and T values inferred from the original dataset remain optimal in the vast majority of the replicates if up to 15% of the sequences are deleted (ESM, File 3, Figs. S1–S4). In most replicates, the optimal T changes only slightly
103
0.8
200
0.6
150
0.4
100 MRI
0.2
50
Number of clusters
Number of clusters
MRI
Göker et al
0
0.0 0.0
0.2
0.4
0.6
0.8
1.0
Distance threshold T Figure 2. Partition agreement optimization plot. Note: The relationship between distance threshold T, MRI and number of clusters using the globally optimal F value (0.75) and distance function λ1 (Formula 3).
even for higher deletion proportions. Because the range of optimal threshold values may be larger if subsets of the data are analyzed, small deviations in the reported median optimal F and T values do not imply that the resulting clustering partition is altered. Thus, the jackknifing results indicate a considerable robustness of clustering optimization. Likewise, the originally optimal F values are still optimal in almost all replicates if up to 20% errors are introduced in the reference partition; optimal T remains stable for up to 15% errors (ESM, File 3, Figs. S6–S9). Cluster 1
U
I-A
TRU
-B
UI
Q
EN
HIR
Q
M
MAC-B
MAC-A PEL-A
INC
FAL BUL
GLU
-B -A UVU UVU
PEL-B
Cluster 5
B RU N CO
SA SIPC B
SIP-A
Distance = 0.1
UNI Figure 3. Neighbor-joining GBDP tree. Notes: Radial NJ phylogram based on λ1 GBDP distances. Branch lengths are scaled in terms of the estimates from the distance values. Colors represent the affiliation to TU; their abbreviations are explained in Table 2.
104
The best ML tree inferred with RAxML from the MAFFT alignment, rooted according to the accepted classification of PF in spinose macroperforate, nonspinose macroperforate and non-spinose microperforate taxa,33 is shown in Figure 4 with ML bootstrap values. (For a discussion of the backbone of the tree, ie, the interrelationships of the PF genera, and the effect of using other MSAs on topology and support values see).28 Conventional phylogenetic reconstruction and MSA-free clustering agreed well, most morphotaxa and TU were present as clades (Fig. 4). Only H. pelagica, and G. ruber sensu reference data were placed in two distinct clades, respectively, and only the members of two TU (MAC-A, SIP-A) were not placed within the same clade. Support for these conflicting arrangements was low for MAC-A but significant for SIP-A. As Figure 3 shows a monophyletic SIP-A, the discrepancy was due to the GBDP method and not due to the clustering.
Discussion Clustering optimization for molecular taxonomy
Clustering optimization had a number of benefits for PF taxonomy; analogous benefits are to be expected with other groups of organisms and other sequence regions. First, the best distance functions could be identified because each function was independently optimized. Calculating MSA-based distances can be problematic in the case of foraminifer SSU rDNA due to common length-polymorphism of highly divergent sequence regions with unknown transcriptional fate, the so-called “expansion segments” (eg,).28,36,40,70 Within these expansion segments, nucleotide homology is difficult to establish for all PF.28 Table 1 shows that each alignment requires different optimal distance models to reach the highest possible MRI. In the case of the CLUSTALW, GINSI, MUSCLE and POAGLO alignments, a single distance model (F84+Γ, GTR+Γ, TamNei) outperforms the others, whereas in the case of the KALIGN alignment most distance models perform equally. Optimal T and F values vary as well both within and between the distinct combinations of alignment and distance function (Table 1, 3rd and 4th column; ESM, File 1). For instance, T values between 0.373 and 0.388 coupled with F values between 0.25 and 0.50 result in the highest MRI obtained with CLWOPT and F81+Γ distances in contrast to optimal Evolutionary Bioinformatics 2010:6
Optimal taxonomy of planktonic foraminifers Nonspinose microperforate Globigerinita glutinata
91
GLU
99
UVU-A UVU-B
G. uvula
100
Globorotalia inflata 21 17
Nonspinose macroperforate
BS = 100
MAC-A
Neogloboquadrina pachyderma BS = 99
5
N. incompta
33
N. dutertrei
30 100
INC
BS = 100
Pulleniatina obliquiloculata BS = 99 Undetermined globorotaliid R034 BS = 100 BS = 94
HIR
G. hirsuta 19
MAC-B
[1]
38
100
G. truncatulinoides
TRU
45 100
G. menardii
Spinose macroperforate
MEN
PEL-B
100
Hastigerina pelagica*
100
100 100
79
100 100
77
16
T. quinqueloba 98 Globigerina falconensis G. bulloides
PEL-A QUI-A QUI-B FAL BUL
100 64 100
98
[5] G. siphonifera
SIP-A
95 78
34
100 100
100 Globigerinoides ruber* 95 G. conglobatus 100 G. sacculifer
SIP-B RUB CON SAC
83 100
Orbulina universa
UNI
0.5 expected substitutions per site
Figure 4. Maximum-likelihood tree. Notes: ML phylogram inferred from the MAFFT alignment and rooted according the separation of planktonic foraminifera in spinose macroperforate, non-spinose macroperforate and non-spinose microperforate taxa. Branch lengths are scaled in terms of the number of substitutions per site. Bootstrap support values are shown on the branches. TU annotations from optimal settings (as in Fig. 3 and Table 2) are provided on the right side. The names of the morphotaxa are provided near the leaves of the tree. Stars indicate morphotaxa that are not supported as monophyletic (cf.);28 the position of the two sequences with missing data (white dots) is indicated by respective cluster numbers in brackets (see also Table 2).
T of 0.125 or 0.133 and optimal F of 0.35 or 0.40 obtained with TamNei distances and MAFFT. GBDP outperformed alignment methods and the corrections for the violation of fragment homology performed significantly better than uncorrected GBDP (Table 1), which frequently misplaced short sequences. Only two apparent artifacts (Fig. 3; Evolutionary Bioinformatics 2010:6
Table 2) remained if the correction was applied due to sequences containing missing data (N’s) in their center, a phenomenon the GBDP distances (so far) have not been corrected for. Whether MSA-free approaches are superior to MSA for optimal clustering of other organisms and sequence regions, or for phylogenetic inference, remains to be seen. 105
Göker et al Table 2. Interpretation of taxonomic units. Assigned morphotaxon (accession nos., individuals)a
Original cluster number
Associated TU
Status
Globigerina bulloides G. indet. sp. U80793 G. indet. sp. from Okinawa trough Indiv. R043, determined as G. bulloides; clone 1 Indiv. R043, determined as G. bulloides; clone 2 G. falconensis Globigerinella calida Z83960 G. siphonifera AJ251213, AJ390578, AJ390580 G. siphonifera, all other sequences
17 17 17 5
BUL BUL BUL [Cluster 5]
OK Identified using clustering Identified using clustering Missing data (‘N’) artefactb
12
SIP-A
Possible misdetermination
3 12 20
FAL SIP-A SIP-B
Few data Possible misdetermination78 Includes G. siphonifera type IV41
12
SIP-A
Undetermined spinose individual P125 Undetermined spinose individual P155 Globigerinita glutinata G. uvula AF387173 Two small individuals, possibly G. uvula28 Globigerinoides conglobatus G. ruber ‘pink’ or ‘white’
12 20 22 4 2 9 8
SIP-A SIP-B GLU UVU-A UVU-B CON RUB
G. ruber ‘white’ AF102230 G. sacculifer Z69600 G. sacculifer, all other sequences Globorotalia crassaformis AY453134
9 9 7 13
CON CON SAC MAC-A
G. inflata G. hirsuta indiv. R002 clone 09 G. hirsuta , all other sequences R021, undetermined globorotaliid (possibly G. scitula) R034, undetermined globorotaliid
13 1 18 18
MAC-A [Cluster 1] HIR HIR
Includes G. siphonifera types I, IIa,IIb/III40,41,78,79 Identified using clustering Identified using clustering OK Provisional, very few data Provisional, few data Very few data Synonym ofG. ruber types I and P73,79,80 Synonym ofG. ruber type II40,73 Known misnomer81 OK Possible misdetermination (Kimoto and Tsuchiya, unpublished; available in GenBank OK Missing data (‘N’) artefactb OK Identified using clustering
14
MAC-B
G. menardii G. truncatulinoides Hastigerina pelagica Z83958 and individuals R022/P101 H. pelagica, remaining individuals Neogloboquadrina dutertrei N. incompta, including revised N. pachyderma
11 19 6
MEN TRU PEL-A
21 14 16
PEL-B MAC-B INC
N. pachyderma
13
MAC-A
Orbulina spec., O. universa
10
ORB
Pulleniatina obliquiloculata
14
MAC-B
Could be first true G. crassaformis; more data needed Very few data OK OK28 OK28 Few data Synonym of N. pachyderma dextral; type R;72 N. pachyderma dextral types I, II82 Synonym of N. pachyderma type I;69 N. pachyderma sinistral types I–VII72,74 Synonym of Orbulina mediterranean, caribian, Sargasso type78,80 Very few data (Continued)
106
Evolutionary Bioinformatics 2010:6
Optimal taxonomy of planktonic foraminifers Table 2. (Continued) Assigned morphotaxon (accession nos., individuals)a
Original cluster number
Associated TU
Status
Turborotalita quinqueloba AF250116 T. quinqueloba, all other sequences
0 15
QUI-A QUI-B
Very few data Few data
Note: Molecular taxonomic units (TU) from clustering using the optimal parameters and their correspondence with the reference taxonomy. The “original cluster number” is an arbitrary number directly found in the OPTSIL results with a 1:1 correspondence to the TU names. a Accession nos. refer to sequences downloaded from GenBank; individuals refer to data of Aurahs et al28(cf. Material and Methods). If no accession nos. or individuals are given, all sequences assigned to the respective taxon are adressed; bBoth sequences comprise missing data in the center of the sequences (incompletely sequenced clones). The distance formulae have not been corrected for this situation.
In particular, other MSA-free distance algorithms should be tested.28–30 However, since our distance corrections are based on HSPs, it is at present uncertain how an equivalent adaption could be obtained with distances that do not rely on the determination of HSPs. In any case, our results imply that fragment homology plays an important role in MSA-free phylogenetic inference. Second, the OPTSIL algorithm results in genetically homogeneous clusters (particularly if high F values are optimal; see)20(192) in optimal agreement with the reference partition of interest, a possible advantage over the use of predefined thresholds,1–3,5,8,9 as long as the reference is biologically meaningful. Optimization may not work with all datasets, but failure can be ruled out if the optimal MRI values are significantly larger than 0.0 and much closer to 1.0. Additionally, taxon jackknifing and random permutation can be used to assess the robustness of parameter optimization. Thus, the algorithm can be applied to each combination of a reference partition and a distance matrix; the user just has to closely examine the results for sufficiently high optimal MRI values. Applied to downy mildew ITS rRNA19 or PF SSU rRNA sequences (this study), the algorithm is robust against misidentifications and a taxonomy that only partially reflects natural relationships (Figs. 3, 4; Table 2), most likely because full agreement with the reference partition is not required. The optimal parameters can be used for sequence identification and for the recognition of new sequence types just by applying them to enlarged datasets. Running time might be an issue, particularly if clustering optimization is combined with taxon jackknifing and random permutation. However, results are expected to increase in stability with increasing dataset size. Once the suitability of the
Evolutionary Bioinformatics 2010:6
algorithm for a particular type of data has been established, jackknifing and random permutation could be omitted in future runs with enlarged datasets. A drawback of jackknifing is that it presupposes that the data come from the same underlying population, but this problem also diminishes with increasing dataset size as it becomes increasingly unlikely that entirely novel (shapes of) clusters are encountered. Optimizing T for a given F is efficient even with small step sizes of T because the clustering results obtained with each previous (lower) T are reused in every step (the clusters might fuse with increasing T, but never split). Runs for exploring distinct F values can be trivially parallelized by independently starting the program. In our experience, the limiting step is the calculation of the distance matrix, whose running time is proportional to the square of the sequences. Third, reference taxonomies can usually be generated with ease. Automated processing of taxonomic descriptors found in public databases is possible, as applied here to obtain valid PF species names. The same technique can also be applied for filtering the input data and conducting the parameter optimization for the subset of the data characterized by annotation suitable for use as a reference partition. Other types of reference partitions may also be of use. For instance, in the case of apparently highly specialized symbiotic (mutualist or parasitic) organisms (eg, downy mildews),71,72 sequence clustering could be optimized regarding the agreement with the host taxonomy.19 If several suitable reference partitions are present (eg, a matrix of morphological characters or alternative codings of the same underlying data to represent uncertainty), the MRI can be averaged between the distinct partitions, as already implemented in the OPTSIL program.
107
Göker et al
Implications for a taxonomic synopsis in planktonic foraminifera
By using three-dimensional clustering, we were able to define taxonomic units (TU) that well reflect the current morphotaxonomy but also identified new TU, the latter being candidates for yet undetermined or undescribed morphotaxa. The distance formulae applied in this study can deal with sequences as short as 200 bp (Fig. 3; ESM, File 1). This makes our approach most valuable for the automatic taxonomic identification of morphospecies present in environmental samples of PF by analyzing a fragment of their SSU rDNA. For a full automation, additional differentiation would be necessary between Pulleniatina obliquiloculata, Neogloboquadrina dutertrei and the species of R034, which are currently placed in the same TU, MAC-B (Fig. 4; Table 2). Corresponding optimal clustering settings could be obtained by optimizing this subset of the data, and a second identification step could be applied once a sequence has been assigned to this TU. Clustering optimization is a means of identifying genetically circumscribed clusters within morphospecies that represent a level of genetic divergence, which is otherwise indicative of separate morphospecies. In this way, the hierarchy among (pseudo-) cryptic species may be defined consistently, which is the first step towards an enhanced (standardized) classification of PF. For instance, Neogloboquadrina pachyderma (part of MAC-A) and N. incompta (INC) were originally considered to be conspecific73 but later on revised to accommodate molecular evidence.69 The second example is the obviously diphyletic “G. ruber”,28,40,42,74 which included members of the RUB and CON clusters (Fig. 4; “Globigerinoides ruber-conglobatus cluster”);40 CON-type G. ruber individuals have been erroneously synonymized with the RUB-type G. ruber.28,74 Further candidates for (pseudo-)cryptic species are all morphospecies represented by more than one TU in our analyses, ie, Globigerinella siphonifera, Globigerinita uvula, Hastigerina pelagica and Turborotalita quinqueloba. Clustering demonstrates that some of the genetic types distinguished within these species are of higher rank than SSU rDNA genotypes described in Globigerina bulloides, Globorotalia truncatulinoides, Neogloboquadrina pachyderma and 108
Orbulina universa.38,40,41,43,73,75 A more comprehensive phylogenetic background needs to be established to clarify the status of the potential new species as well as of clusters such as MAC-A and MAC-B, comprising several morphotaxa, and SIP-A, which could be non-monophyletic (Figs. 3, 4). While phylogenetic reconstruction is necessary to identify monophyletic units, it only provides criteria for grouping, not for ranking. By the additional use of clustering optimization it is possible to define species as monophyletic units that are also characterized by a specific morphology and a comparable genetic diversity, thus deserving the same taxonomic rank. To establish an enhanced, standardized taxonomic system for PF including important proxies used for (paleo-)oceanographic reconstruction, research can now focus on the discrepancies between phylogenetic trees, morphotaxa and TU to identify new molecular and non-molecular characteristics for formerly (pseudo-)cryptic species or ambiguously ranked genotypes.
Conclusion
Our results obtained with clustering optimization are an excellent starting point for further methodological improvements. For instance, novel MSA-based and MSA-free distance functions can be tested. Formulae for pairwise distances that are not based on a statistical model can be calculated independently of each other, thus representing an embarrassingly parallel algorithm, which enables one to obtain a near-linear speedup on multi-processor architectures (eg,).76 Given that genetic divergence may differ between morphologically defined lineages,22 it is crucial that the algorithm can be used to obtain distinct optimal settings for distinct groups of organisms. Using values of F smaller than 1.0 already relaxes the assumption of homogeneous genetic within-species divergence. Nevertheless, it is of interest to test clustering algorithms other than linkage clustering which are even independent of fixed threshold values. Whether our current or any improved algorithm is sufficient for molecular classification in the case of loci with high intra-individual variability (eg,),77,78 remains to be investigated, but it is obvious that clustering optimization will at least
Evolutionary Bioinformatics 2010:6
Optimal taxonomy of planktonic foraminifers
minimize the number of discrepancies. Alternative measures for the agreement between clustering results and reference data are also of interest. However, most likely all of these improvements will be based on the same principle: Optimizing the agreement between molecular classification and external information. Since our optimization approach shows so much promise for PF, we expect it to be of general use. Whether its strict objectivity and reproducibility will help to dispel some of the criticism on the “unholy” aspects of molecular taxonomy17 remains to be seen. At the very least, the adaption of molecular taxonomy to reference data based on traditional taxonomy, without requiring that the latter are 100% reasonable, is an appealing concept for both groups, traditional and molecular taxonomists. By specifically addressing the issue of how to optimally account for both, traditional species concepts and genetic divergence, clustering optimization bridges the gap between traditional and modern taxonomic disciplines. It thus allows us to optimally define taxa in groups with high cryptic diversity and to automatically classify unknown DNA sequences in these groups.
Abbreviations
GBDP, Gen(om)e BLAST distance phylogeny; ML, maximum likelihood; MSA, multiple sequence alignment; PF, planktonic foraminifera; TU, taxonomic unit.
Author Contributions
MG conducted clustering optimization and phylogenetic inference and devised the correction of fragment length homology in GBDP. MG and GWG prepared the results for publication. AFA devised the GBDP distance formulae and implemented the GBDP program. RA assembled most primary data. RA, GWG and MK interpreted the results with regard to the taxonomy of planktonic foraminifera, and all authors participated in writing the manuscript.
Acknowledgements
This research has been supported by German Science Foundation (DFG, grant KU2259/2). GWG acknowledges support by the Swedish Science Foun-
Evolutionary Bioinformatics 2010:6
dation. We thank two anonymous reviewers for their helpful comments.
Disclosures
This manuscript has been read and approved by all authors. This paper is unique and not under consideration by any other publication and has not been published elsewhere. The authors and peer reviewers report no conflicts of interest. The authors confirm that they have permission to reproduce any copyrighted material.
References
1. Blaxter M, Floyd R. Molecular taxonomics for biodiversity surveys: already a reality. Trends Ecol Evol. 2003;18:268–9. 2. Blaxter M, Mann J, Chapman T, et al. Defining operational taxonomic units using DNA barcode data. Phil Trans Roy Soc London B. 2005; 360:1935–43. 3. Daniell TJ, Husband R, Fitter AH, Young JPW. Molecular diversity of arbuscular mycorrhizal fungi colonising arable crops. FEMS Microbiol Ecol. 2001;36:203–9. 4. Floyd R, Abebe E, Papert A, Blaxter M. Molecular barcodes for soil nematode identification. Mol Ecol. 2002;11:839–50. 5. Helgason T, Watson IJ, Young JPW. Phylogeny of the Glomerales and Diversisporales (Fungi: Glomeromycota) from actin and elongation factor 1-alpha sequences. FEMS Microbiol Ecol. 2003;229:127–32. 6. Husband R, Herre EA, Turner SL, Gallery R, Young JPW. Molecular diversity of arbuscular mycorrhizal fungi and pattern of host association over time and space in a tropical forest. Mol Ecol. 2002;11: 2669–78. 7. Schloss P, Handelsman J. Status of the microbial census. Microbiol Mol Biol Rev. 2004;68:686–91. 8. Schloss PD, Handelsman J. Introducing DOTUR, a computer program for defining operational taxonomic units and estimating species richness. Appl Environ Microbiol. 2005;71:1501–6. 9. Wubet T, Weiß M, Kottke I, Teketay D, Oberwinkler F. Phylogenetic analysis of nuclear small subunit rDNA sequences suggests that the endangered African Pencil Cedar, Juniperus procera, is associated with distinct members of Glomeraceae. Mycol Res. 2006;110: 1059–69. 10. Knowlton N. Sibling species in the sea. Annual Review of Ecology and Systematics. 1993;24:189–216. 11. Rusch DB, Halpern AL, Sutton G, et al. The Sorcerer II Global Ocean Sampling expedition: northwest Atlantic through eastern tropical Pacific. PLoS Biol. 2007;5:e77. 12. Tringe SG, Rubin EM. Metagenomics: DNA sequencing of environmental samples. Nat Rev Genet. 2005;6:805–14. 13. Hebert P, Gregory T. The promise of DNA barcoding for taxonomy. Syst Biol. 2005;54:852–9. 14. Kress WJ, Erickson DL. DNA barcoding—a windfall for tropical biology? Biotropica. 2008;40:405–8. 15. Ferguson JWH. On the use of genetic divergence for identifying species. Biol J Linn Soc. 2002;75:509–16. 16. Will K, Mishler B, Wheeler Q. The perils of DNA barcoding and the need for integrative taxonomy. Syst Biol. 2005;54:844–51. 17. DeSalle R, Egan MG, Siddall M. The unholy trinity: Taxonomy, species delimitation and DNA barcoding. Phil Trans Roy Soc London B. 2005;360: 1905–16. 18. Will KW, Rubinoff D. Myth of the molecule: DNA barcodes for species cannot replace morphology for identification and classification. Cladistics. 2004;20:47–55.
109
Göker et al 19. Göker M, García-Blázquez G, Voglmayr H, Tellería MT, Martín MP. Molecular taxonomy of phytopathogenic fungi: a case study in Peronospora. PLoS ONE. 2009;4:e6319. 20. Sokal RR, Sneath PHA. Principles of Numerical Taxonomy. San Francisco: Freeman WH and Company; 1963. 21. Meier R, Shiyang K, Vaidya G, Ng PKL. DNA barcoding and taxonomy in Diptera: A tale of high intraspecific variability and low identification success. Syst Biol. 2006;55:715–28. 22. Nilsson RH, Kristiansson E, Ryberg M, Hallenberg N, Larsson K-H. Intraspecific ITS variability in the kingdom fungi as expressed in the international sequence databases and its implications for molecular species identification. Evol Bioinf. 2008;4:193–201. 23. Abdo Z, Golding B. A step toward barcoding life: A model-based, decisiontheoretic method to assign genes to preexisting species groups. Syst Biol. 2007;56:44–56. 24. Nielsen R, Matz M. Statistical approaches for DNA barcoding. Syst Biol. 2006;55:162–9. 25. Bidartondo MI, et al. (256 authors). Preserving accuracy in Genbank. Science. 2008;319:1616. 26. Lake JA. The order of sequence alignment can bias the selection of tree topology. Mol Biol Evol. 1991;8:378–85. 27. Morrison DA, Ellis JT. Effects of nucleotide sequence alignment on phylogeny estimation: a case study of 18S rDNAs of Apicomplexa. Mol Biol Evol. 1997;14:428–41. 28. Aurahs R, Göker M, Grimm GW, et al. Using the multiple analysis approach to reconstruct phylogenetic relationships among planktonic Foraminifera from highly divergent and length-polymorphic SSU rDNA sequences. Bioinf Biol Insights. 2009;3:155–77. 29. Höhl M, Ragan MA. Is multiple-sequence alignment required for accurate inference of phylogeny? Syst Biol. 2007;56:206–21. 30. Otu HH, Sayood K. A new sequence distance measure for phylogenetic tree construction. Bioinformatics. 2003;19:2122–30. 31. Vinga S, Almeida J. Alignment-free seqeunce comparison—a review. Bioinformatics. 2003;19:513–23. 32. Hall N. Advanced sequencing technologies and their wider impact in microbiology. J Exp Biol. 2007;209:1518–25. 33. Hemleben C, Spindler M, Anderson OR. Modern Planktonic Foraminifera. New York: Springer-Verlag; 1989. 34. Kučera M. Planktonic foraminifera as tracers of past oceanic environments. In: Hillaire-Marcel C, de Vernal A, editors. Proxies in Late Cenozoic Paleoceanography. Vol. 1. Amsterdam: Elsevier; 2007:213–62. 35. Ravelo AC, Hillaire-Marcel C. The use of oxygen and carbon isotopes of foraminifera in paleoceanography. In: Hillaire-Marcel C, de Vernal A, editors. Proxies in Late Cenozoic Paleoceanography. Vol. 1. Amsterdam: Elsevier; 2007:735–6. 36. Grimm GW, Stögerer K, Ertan KT, Kitazato H, Hemleben V, Hemleben C. Diversity of rDNA in Chilostomella: molecular differentiation patterns and putative hermit types. Mar Micropaleontol. 2007;62:75–90. 37. Darling KF, Wade CM. The genetic diversity of planktic foraminifera and the global distribution of ribosomal RNA genotypes. Mar Micropaleontol. 2008;67:216–38. 38. de Vargas C, Norris R, Zaninetti L, Gibb SW, Pawlowski J. Molecular evidence of cryptic speciation in planktonic foraminifers and their relation to oceanic provinces. Proc Nat Acad Sci U S A. 1999;96:2864–8. 39. Kučera M, Darling KF. Cryptic species of planktonic foraminifera: their effect on palaeoceanographic reconstructions. Phil Trans Roy Soc London A. 2002;360:695–718. 40. Darling KF, Wade CM, Kroon D, Leigh Brown AJ, Bijma J. The diversity and distribution of modern planktic foraminiferal small subunit ribosomal RNA genotypes and their potential as tracers of present and past ocean circulations. Paleoceanogr. 1999;14:3–12. 41. de Vargas C, Bonzon M, Rees NW, Pawlowski J, Zaninetti L. A molecular approach to biodiversity and biogeography in the planktonic foraminifer Globigerinella siphonifera (d’Orbigny). Mar Micropaleontol. 2002;45: 101–16. 42. Stewart IA, Darling KF, Kroon D, Wade CM, Troelstra SR. Genotypic variability in subarctic Atlantic planktic foraminifera. Mar Micropaleontol. 2001;43:143–53.
110
43. Huber BT, Bijma J, Darling K. Cryptic speciation in the living planktonic foraminifer Globigerinella siphonifera (d’Orbigny). Paleobiology. 1997; 23:33–62. 44. Auch AF, Henz SR, Holland BR, Göker M. Genome BLAST distance phylogenies inferred from whole plastid and whole mitochondrion genome sequences. BMC Bioinf. 2006;7:350. 45. Auch AF, Klenk H-P, Göker M. Standard operating procedure for calculating genome-to-genome distances based on high-scoring segment pairs. Stand Genomic Sci. 2010;2:142–8. 46. Auch AF, von Jan M, Klenk HP, Göker M. Digital DNA-DNA hybridization for microbial species delineation by means of genome-to-genome sequence comparison. Stand Genomic Sci. 2010;2:117–34. 47. Altschul SF, Gish W, Miller W, Myers EW, Lipman DJ. Basic local alignment search tool. Journal of Molecular Biology. 1990;215:403–10. 48. Hennig W. Phylogenetische Systematik. Vol. 34. Berlin, Hamburg: Verlag Paul Parey; 1982. 49. Schuh R. Biological Systematics. Principles and Applications. Ithaca, NY: Comstock Publishing Associates; 2000. 50. Wiley EO. The Theory and Practice of Phylogenetic Systematics. New York: John Wiley and Sons Inc.; 1981. 51. de Vargas C, Pawlowski J. Molecular versus taxonomic rates of evolution in planktonic foraminifera. Mol Phylogenet Evol. 1998;9:463–9. 52. Fitch WM, Smith TF. Optimal sequence alignments. Proceedings of the National Academy of Sciences, U S A. 1983;80:1382–6. 53. Wheeler WC. The triangle inequality and character analysis. Mol Biol Evol. 1993;20:707–12. 54. Felsenstein J. Inferring phylogenies. Sunderland, MA, USA.: Sinauer Associates Inc.; 2004. 55. Larkin MA, Blackshields G, Brown NP, et al. Clustal W and Clustal X version 2.0. Bioinformatics. 2007;23:2947–8. 56. Thompson JD, Gibson TJ, Plewniak F, Jeanmougin F, Higgins DG. The ClustalX windows interface: flexible strategies for multiple sequence alignment aided by quality analysis tools. Nucleic Acids Res. 1997;24:4876–82. 57. Lassmann T, Sonnhammer ELL. Kalign—an accurate and fast multiple sequence alignment algorithm. BMC Bioinf. 2005;6:298. 58. Katoh K, Kuma K, Toh H, Miyata T. MAFFT version 5: improvement in accuracy of multiple sequence alignment. Nucleic Acids Res. 2005;33:511–8. 59. Edgar RC. MUSCLE: multiple sequence alignment with high accuracy and high throughput. Nucleic Acids Res. 2004;32:1792–97. 60. Lu Y, Sze SH. Improving accuracy of multiple sequence alignment algorithms based on alignment of neighboring residues. Nucleic Acids Res. 2009;37:463–72. 61. Lee C, Grasso C, Sharlow M. Multiple sequence alignment using partial order graphs. Bioinformatics. 2002;18:452–64. 62. Wilm A, Mainz I, Steger G. An enhanced RNA alignment benchmark for sequence alignment programs. Algorithms Mol Biol. 2006;1:19. 63. Swofford DL. PAUP*: Phylogenetic Analysis Using Parsimony (and Other Methods) 4.0 Beta. Sunderland, MA: Sinauer Associates; 2002. 64. Swofford DL, Olsen GJ, Waddell PJ, Hillis DM. Phylogenetic Inference. In: Hillis DM, Moritz C, Mable BK, editors. Molecular Systematics. 2nd ed. Sunderland, MA: Sinauer Associates; 1996:407–514. 65. Stamatakis A. RAxML-VI-HPC: Maximum-Likelihood-based phylogenetic analyses with thousands of taxa and mixed models. Bioinformatics. 2006; 22:2688–90. 66. Stamatakis A, Hoover P, Rougemont J. A rapid bootstrap algorithm for the RAxML web servers. Syst Biol. 2008;57:758–71. 67. Saitou N, Nei M. The neighbor-joining method: A new method for reconstructing phylogenetic trees. Mol Biol Evol. 1987;4:406–25. 68. Kemler M, Göker M, Oberwinkler F, Begerow D. Implications of molecular characters for the phylogeny of the Microbotryaceae (Basidiomycota: Urediniomycetes). BMC Evol Biol. 2006;6:35. 69. Darling KF, Kucera M, Kroon D, Wade CM. A resolution for the coiling direction paradox in Neogloboquadrina pachyderma. Paleoceanogr. 2006; 21:PA2011, doi:2010.1029/2005PA001189. 70. de Vargas C, Zaninetti L, Hilbrecht H, Pawlowski J. Phylogeny and rates of molecular evolution of planktonic Foraminifera: SSU rDNA sequences compared to the fossil record. Journal of Molecular Evolution. 1997;45:285–94.
Evolutionary Bioinformatics 2010:6
Optimal taxonomy of planktonic foraminifers 71. García-Blázquez G, Göker M, Voglmayr H, Martín MP, Tellería MT, Oberwinkler F. Phylogeny of Peronospora parasitic of Fabaceae based on internal transcribed spacer sequences. Mycol Res. 2008;112:502–12. 72. Göker M, Voglmayr H, García Blázquez G, Oberwinkler F. Species delimitation in downy mildews: the case of Hyaloperonospora in the light of nuclear ribosomal ITS and LSU sequences. Mycol Res. 2009;113: 308–25. 73. Darling KF, Wade CM, Stewart IA, Kroon D, Dingle R, Leigh Brown AJ. Molecular evidence for genetic mixing of Arctic and Antarctic subpolar populations of planktonic foraminifers. Nature. 2000;405:43–7. 74. Aurahs R, Grimm GW, Hemleben V, Hemleben C, Kučera M. Geographical distribution of cryptic genetic types in the planktonic foraminifer Globigerinoides ruber. Mol Ecol. 2009;18:1692–706. 75. Darling K, Kucera M, Pudsey CJ, Wade CM. Molecular evidence links cryptic diversification in polar planktonic protists to Quaternary climate dynamics. Proceedings of the National Academy of Sciences of the U S A. 2004;101:7657–62. 76. Stockinger H, Auch AF, Göker M, Meier-Kolthoff J, Stamatakis A. Largescale co-phylogenetic analysis on the grid. Int J Grid High Perform Comput. 2009;1:39–54.
Evolutionary Bioinformatics 2010:6
77. Göker M, Grimm GW. General functions to transform associate data to host data, and their use in phylogenetic inference from sequences with intraindividual variability. BMC Evol Biol. 2008;8:86. 78. Schlee M, Göker M, Grimm GW, Hemleben V. Relicts within the genus complex Astragalus/Oxytropis (Fabaceae), and the comparison of diversity by objective means. In: Habel JC, Assmann T, editors. Relict Species. Heidelberg, New York: Springer; 2010:105–118. 79. Darling KF, Wade CM, Kroon D, Leigh Brown AJ. Planktic foraminiferal molecular evolution and their polyphyletic origins from benthic taxa. Mar Micropaleontol. 1997;30:251–66. 80. Darling KF, Kroon D, Wade CM, Leigh Brown AJ. Molecular phylogeny of the planktic foraminifera. J Foram Res. 1996;26:324–30. 81. Pawlowski J, Bolivar I, Fahrni J, de Vargas C, Gouy M, Zaninetti L. Extreme differences in rates of molecular evolution of foraminifera revealed by comparison of ribosomal DNA sequences and the fossil record. Mol Biol Evol. 1997;14:498–505. 82. Darling KF, Kucera M, Wade CM, von Langen P, Pak D. Seasonal distribution of genetic types of planktonic foraminifer morphospecies in the Santa Barbara Channel and its paleoceanographic implications. Paleoceanogr. 2003;18:1032.
111
Göker et al
Supplementary Data Supplement file 1—Alignments, distance matrices and clustering optimization
Contains the GenBank accession numbers of the sequences under study, the inferred alignments and GBDP distance matrices, and the results from clustering optimization, taxon jackknifing and random permutation of the reference partition.
Supplement file 2—Dependency of selected clusters on T
The effect of applying suboptimal T values on the clusters MAC-A, SIP-A and SIP-B.
Supplement file 3—Taxon jackknifing and random permutation
The results of the taxon jackknifing and reference partition random permutation experiments.
Publish with Libertas Academica and every scientist working in your field can read your article “I would like to say that this is the most author-friendly editing process I have experienced in over 150 publications. Thank you most sincerely.” “The communication between your staff and me has been terrific. Whenever progress is made with the manuscript, I receive notice. Quite honestly, I’ve never had such complete communication with a journal.” “LA is different, and hopefully represents a kind of scientific publication machinery that removes the hurdles from free flow of scientific thought.”
Your paper will be: • Available to your entire community free of charge • Fairly and quickly peer reviewed • Yours! You retain copyright http://www.la-press.com
112
Evolutionary Bioinformatics 2010:6