... and (2) the nonlinear value term involving the velocity within the head loss equa- tions. ..... [18] In step 2, the objective is to find the lowest cost design for the ...
WATER RESOURCES RESEARCH, VOL. 47, W08531, doi:10.1029/2011WR010394, 2011
A combined NLP-differential evolution algorithm approach for the optimization of looped water distribution systems Feifei Zheng,1 Angus R. Simpson,1 and Aaron C. Zecchin1 Received 11 January 2011; revised 5 May 2011; accepted 11 July 2011; published 27 August 2011.
[1] This paper proposes a novel optimization approach for the least cost design of looped
water distribution systems (WDSs). Three distinct steps are involved in the proposed optimization approach. In the first step, the shortest-distance tree within the looped network is identified using the Dijkstra graph theory algorithm, for which an extension is proposed to find the shortest-distance tree for multisource WDSs. In the second step, a nonlinear programming (NLP) solver is employed to optimize the pipe diameters for the shortestdistance tree (chords of the shortest-distance tree are allocated the minimum allowable pipe sizes). Finally, in the third step, the original looped water network is optimized using a differential evolution (DE) algorithm seeded with diameters in the proximity of the continuous pipe sizes obtained in step two. As such, the proposed optimization approach combines the traditional deterministic optimization technique of NLP with the emerging evolutionary algorithm DE via the proposed network decomposition. The proposed methodology has been tested on four looped WDSs with the number of decision variables ranging from 21 to 454. Results obtained show the proposed approach is able to find optimal solutions with significantly less computational effort than other optimization techniques.
Citation: Zheng, F., A. R. Simpson, and A. C. Zecchin (2011), A combined NLP-differential evolution algorithm approach for the optimization of looped water distribution systems, Water Resour. Res., 47, W08531, doi:10.1029/2011WR010394.
1.
Introduction
[2] In most cases, the design and construction of water distribution systems (WDSs) is costly, often in the order of millions of dollars for larger capital works. Thus, the optimization of WDSs has historically been investigated by many researchers in order to potentially save significant costs. The nonlinear relationship between pipe head loss and discharge, plus the discrete nature of pipe sizes that can be used, bring about many complexities for optimally designing WDSs. This is increasingly difficult for looped WDSs, in which pipe flows and nodal heads are unknown quantities. Two aspects contribute to the nonsmoothness properties of the WDS optimization problems. These include: (1) the pipe diameter choices being composed of discrete sizes rather than being continuous decision variables; and (2) the nonlinear value term involving the velocity within the head loss equations. Generally, there are two different types of WDS optimization problems. One is the completely new WDS design problem, while the other is the expansion of the existing WDSs (such as the optimal rehabilitation of WDSs where there are some already existing pipes). [3] Historically, a number of traditional optimization techniques have previously been applied to water network optimal design, including linear programming (LP) [Alperovits and Shamir, 1977; Fujiwara et al., 1987; Bhave and Sonak, 1992; Sonak and Bhave, 1993] and nonlinear 1 School of Civil, Environmental and Mining Engineering, University of Adelaide, Adelaide, South Australia, Australia.
Copyright 2011 by the American Geophysical Union. 0043-1397/11/2011WR010394
programming (NLP) [Lansey and Mays, 1989; Fujiwara and Khang, 1990]. These methods are deterministic and exhibit fast convergence. Often convergence to local optimal solutions occurs because of the nonsmoothness properties of the WDS optimization problem. In addition, the final solution is usually given in terms of continuous pipe sizes or split pipe sizes, which represents a significant practical limitation. [4] In the last two decades, considerable research has been undertaken into the optimization of WDSs using evolutionary algorithms (EAs). EAs are able to handle discrete search spaces directly and are less likely to be trapped at local optima. The search strategy of EAs differs compared with traditional optimization techniques (such as LP or NLP) in that they explore the search space broadly on the basis of stochastic evolution rather than on gradient information. Genetic algorithms (GAs) were one of the first EAs applied to the optimal design of WDSs [Murphy and Simpson, 1992; Simpson et al., 1994, Savic and Walters, 1997; Montesinos et al., 1999]. Other applications have included Cunha and Sousa [2001], who employed simulated annealing; Geem et al. [2002], who developed a harmony search model; Eusuff and Lansey [2003], who proposed a shuffled frog leaping algorithm (SFLA); Maier et al. [2003], who applied an ant colony optimization approach; and Suribabu and Neelakantan [2006], who introduced particle swarm optimization (PSO). These techniques have been successfully applied to a number of WDS optimization problems, and have been demonstrated to be more effective in finding optimal solutions compared with traditional optimization techniques. [5] More recently, Tolson et al. [2009] developed a hybrid discrete-dynamically dimensioned search (HDDDS) algorithm for WDS optimization and concluded that
W08531
1 of 18
W08531
ZHENG ET AL.: COMBINED NLP-DE FOR OPTIMIZING WATER NETWORKS
HD-DDS was as good as, if not better, than other EAs in terms of search ability, while being significantly more computationally efficient. The differential evolution (DE) algorithm is a relatively new optimization technique that has received attention recently within WDS optimization research. Vasan and Simonovic [2010] and Suribabu [2010] applied DE to the optimization of WDSs and concluded that the search ability of DE was found to be better than other EAs, such as GAs and ant colony optimization. Generally, EAs have been demonstrated to be robust in finding optimal design solutions for WDSs. However, they are computationally expensive, especially when dealing with large-scale WDSs. [6] In order to overcome the limitations of each optimization method (the deterministic and the EA approaches), a new optimization approach that incorporates both types of optimization techniques has been previously proposed by researchers. Reis et al. [2006] proposed a GA-LP model to obtain the optimized operation of reservoir systems. Afshar et al. [2009] developed a hybrid two-stage GA-LP algorithm to optimize the design and operation of a nonlinear, nonconvex, and large-scale cycle storage system. In terms of WDS design optimization, Krapivka and Ostfeld [2009] proposed a coupled GA-LP scheme for the least cost pipe-sizing of water networks. In this method, the optimization problem was decomposed into an ‘‘inner’’ and an ‘‘outer’’ problem. The ‘‘inner’’ LP was formulated and solved for a fixed set of flows, while the flows were altered in the ‘‘outer’’ using a GA. In their proposed optimization approach, an enumeration approach was initially used to identify all possible spanning trees for a looped water network. Then a LP solver was employed to optimize the pipe diameter sizes for each spanning tree to allow the least cost spanning tree to be determined. Lastly, the spanning tree chords were locked into the minimum permissible pipe diameters and the least cost spanning tree was further optimized using the proposed coupled GA-LP technique. The main advantage of this approach is that the search space handled by the GA-LP is reduced as the chords of the spanning tree are set to be the minimum allowable pipe sizes and removed as decision variables. However, this approach is computationally expensive for finding the least cost spanning tree since all the possible spanning trees need to be evaluated. This method is therefore limited in practical applications by the fact that it is impossible to evaluate all the spanning trees for a relatively large water network, and the global optimal solution for the original water network could be missed as the spanning tree chords are fixed by the minimum allowable pipe sizes in this method. An additional criticism is that a splitpipe approach is used in their proposed optimization technique. The new coupled optimization approach proposed in this paper overcomes the problems associated with earlier approaches. [7] The research presented in this paper employs a graph theory decomposition method to effectively combine the EA (DE) and NLP. Typically, graph theory has been frequently used to analyze network connectivity properties and reliabilities [Yang et al., 1996; Shinstine et al., 2002; Davidson et al., 2005, Deuerlein, 2008], while little effort has been made to use graph decomposition in the optimization of WDSs.
W08531
[8] The objective of this paper is to introduce a novel approach for dealing with two different types of WDS optimization problems (either a completely new design or the expansion of the existing WDS). Features of this new methodology include the use of an efficient graph theory algorithm in determining the shortest-distance tree for a looped water network, and the combination of a deterministic optimization technique (NLP) and an evolutionary optimization algorithm (DE). It is observed that, in most of the traditional combinations of optimization models [Reis et al., 2006; Afshar et al., 2009; Krapivka and Ostfeld, 2009], EAs have been used to determine the regions of optimal solutions, whereas deterministic methods (such as LP) have been used to further explore the interior of these regions identified by EAs. The new proposed combination model differs with the traditional combination models in that an NLP is used to identify the approximate region of the optimal solution, while an EA is employed to further search the interior of the region. In this proposed approach, an NLP solver is used to optimize the pipe diameters for the shortestdistance tree within a continuous pipe diameter search space (as opposed to a discrete diameter search space). This continuous solution, complemented by the chords of the shortest-distance tree with minimum allowable pipe sizes, forms an approximately optimal solution for the original water network. A DE is then seeded in the vicinity of this approximately optimal solution, thereby allowing the DE search to concentrate only on promising regions of the search space. As a result, better quality solutions are expected to be reached more efficiently, and with a higher likelihood. A total of four WDS case studies, including an expansion of an existing WDS and three new designs where they are no existing pipes, have been used to verify the effectiveness of the proposed optimization approach.
2.
Methodology
[9] The three steps involved within the proposed methodology are outlined below. 2.1. Step 1: Shortest-Distance Tree [10] A WDS can be described as a graph G, in which vertices of the graph represent the nodes of the WDS, and edges of the graph represent links between nodes. In graph theory, a connected graph without any loops is referred as a tree [Deo, 1974]. [11] For a looped WDS, a demand node i may have a number of alternative paths to receive water from the source node s. Of these paths between s and node i, the path with the shortest total length of edges is denoted as the shortest path for node i. If we take the shortest path from the source node s to each of the other demand nodes, then the union of these paths will be a tree T, rooted at source node s. Every path in T from s is the shortest path in the original graph G. Such a tree is called the shortest-distance tree [Deo, 1974]. The remaining edges of G that are not traversed by any shortest paths are termed as chords. [12] For a looped WDS, when a demand node has two or more alternative paths receiving flow from a source node, the assumption is that an effective way of delivering demand (for the optimal design) is along the shortest path [Kadu et al., 2008]. Thus, the shortest-distance tree is
2 of 18
W08531
W08531
ZHENG ET AL.: COMBINED NLP-DE FOR OPTIMIZING WATER NETWORKS
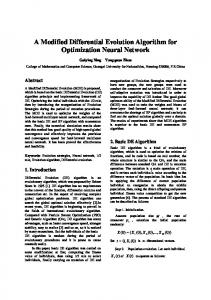
considered to be an optimal tree of the looped WDS, in that each demand node has one and only one shortest path to the source node. An example of a shortest-distance tree and chord for a looped water network is given in Figure 1. [13] The looped water network in Figure 1a consists of five demand nodes labeled from 1 to 5, six links (with lengths in meters), and one source node s. Each node has one, or more than one, path to the source node s. The identification of the shortest-distance tree for such a simple looped water network can be carried out by visual inspection. All of the paths from each demand node back to the source node s in this simple looped network are given in the third column of Table 1. As can be seen from Table 1, node 1 to s has only one path, and hence this is the shortest path from node 1 to s. For node 2, there are two alternative paths including path 2-1-s and 2-4-3-s to s. The path 2-1-s has the shorter length with value of 900 m. Thus, the path of 2-1-s is the shortest path from node 2 to s. The shortest path for each node is identified as shown in the fifth column of Table 1. As a result, the shortest-distance tree is formed with these shortest paths as shown in Figure 1b. The remaining link, 5, is the chord of the shortest-distance tree. [14] For this looped water network with limited alternative paths, a complete enumeration approach can be used to compute the sum of lengths of each alternative path for a node, thereby directly identifying the shortest path. However, the complete enumeration approach becomes intractable for larger water networks. 2.1.1. The Dijkstra Algorithm [15] An efficient graph theory algorithm, called the Dijkstra algorithm [Deo, 1974], is employed to identify the shortest-distance tree for complex water networks. The Dijkstra algorithm works by iteratively assigning and updating labels for each node indicating to the shortest path found so far for that particular node. For the source, a permanent label 0 is assigned. A permanent label is given to a vertex once the shortest path from this vertex to the source vertex has been determined. The value of the permanent label is made equal to the sum of the lengths of the shortest path. In contrast, a temporary label is given to a vertex for which the shortest path has not yet been identified. The value of this temporary label is set to be equal to the sum of the lengths of the shortest path in the current iteration and this value is to be updated in later iterations. The Dijkstra algorithm is efficient in finding the shortest-distance tree for a looped network, especially for large and complex networks [Deo, 1974]. The computational complexity (a proxy for execution time for the algorithm) for the Dijkstra algorithm implementation on a general graph with V vertices and E edges, is O(V2 þ E). The graph representing a WDS
Table 1. Determination of the Shortest-Distance Tree Source Node S
Node Number 1 2 3 4 5
a
Paths 1-s 2-1-s 2-4-3-s 3-1-s 3-4-2-1-s 4-2-1-s 4-3-1-s 5-4-2-1-s 5-4-3-1-s
Lengths (m)
Shortest Path
a
500 900 1030 650 1280 1080 850 1380 1150
1-s 2-1-s 3-1-s 4-3-1-s 5-4-3-1-s
Boldface entries indicate the shortest path.
is sparse, thus the Dijkstra algorithm can be implemented more efficiently by storing the graph in the form of linked lists. In this case, the computational complexity time is O([E þ V]log[V]) [Deo, 1974]. 2.1.2. An Extension of the Dijkstra Algorithm [16] The Dijkstra algorithm is formulated for a single source node graph. In this paper, a supersource approach is used to extend the Dijkstra algorithm to handle systems with multisource nodes. Variants of the supersource approach have been previously used to generate a treed network on the basis of a looped network [Walters and Lohbeck, 1993; Walters and Smith, 1995]. The details on the extension of the Dijkstra algorithm to deal with the multisource WDS are given below. [17] For a multisource WDS of k sources (reservoirs), an artificial supersource node is created to connect all of the source nodes. Note that the lengths of the artificial links are set to be zero. The Dijkstra algorithm starts the search from the supersource node which is given a permanent label of zero (0). In the following step, each source of the WDS is also given a permanent label of zero. In the third step, all successors of the k sources are labeled as temporary with a value equal to the length between the successor and its corresponding source node. For each successor connected to more than one source, all of the distances between this successor and its connecting sources are evaluated and the smallest value is given to this successor as the temporary label. Then, the Dijkstra algorithm is implemented to determine only one permanent label in the third step and the subsequent iterations. With this method, a complex WDS with k sources is decomposed into k different subnetworks connected via an artificial supersource node and k artificial links. 2.2. Step 2: Nonlinear Programming Optimization [18] In step 2, the objective is to find the lowest cost design for the shortest-distance tree network determined in
Figure 1. An example of the shortest-distance tree and a chord for a looped water network ((a) A looped water network (G), (b) Shortest-distance tree and chord). 3 of 18
W08531
ZHENG ET AL.: COMBINED NLP-DE FOR OPTIMIZING WATER NETWORKS
step 1, while satisfying the nodal head constraints. The objective function F is given by F¼a
n X
Dbi Li ;
ð1Þ
i¼1
where Di ¼ the diameter of pipe i, L i ¼ the length of pipe i, a, b ¼ the specified coefficients, and n ¼ the total number of pipes in the network. [19] Typically, the constraints for the optimization of water networks include flow continuity at each node, energy conservation in each primary loop, and the minimum allowable head requirement at each node. Since a tree network is optimized in this step, the discharges for each pipe of the tree network can be determined to satisfy continuity at each node. Two alternative methods are proposed in this study to determine the discharges of the shortestdistance tree for a WDS. The application of these two methods is dependent on the types of WDSs being optimized. The description of these two methods is given as follows: [20] Method 1: For the shortest-distance tree of the optimization problem of a completely new WDS, the flows in the chords of this WDS are assumed to be zero. Thus, the discharges for the pipes in the shortest-distance tree network are determined accordingly. [21] Method 2: For the shortest-distance tree of an expansion WDS optimization problem, an alternative method is proposed where flows in the chords are taken to be equal to that from the hydraulic analysis for the original WDS. The flows in the treed network pipes are then determined as the flows in the chords have assumed values. [22] In this study, for the expansion WDS optimization problem, the two methods mentioned above are tested to determine the most effective one. For the shortest-distance tree, energy conservation does not need to be considered in the formulation of the NLP as there are no loops involved in a treed network. Thus, the number of constraints for NLP in step 2 is reduced significantly for the optimization of the shortest-distance tree produced in step 1. [23] For the formulation of the NLP for optimizing the shortest-distance tree, the remaining constraints are the head constraint at each node and the diameter sizes that can be used. Since each node has a path to the source node, the head loss along this path should be less than a specified value that is equal to the head provided at source node minus the head required at this node. Two of the most frequently used formulas for head-loss calculation in pipes are the Hazen-Williams (H-W) and Darcy-Weisbach (D-W) equations [Walski, 1984]. The constraint for each node (i) and these two formulas are given by m X
hfk � Hs � Himin ;
pipes involved from node i to source node, ! ¼ the numerical conversion constant which depends on the units, �, � ¼ the coefficients, L ¼ the length of pipe (m), C ¼ the Hazen-Williams coefficient, D ¼ the diameter of the pipe (m), and Q ¼ the pipe flow rates (m3 s�1). In this study, � ¼ 1:852 and � ¼ 4:871 are used. For SI units, i.e., the units of L, D, in meters, and Q in m3 s�1, ! ¼ 10:667 is used. In equation (4), f ¼ the D-W friction factor for the pipe (dimensionless) and V ¼ water velocity (m s�1). [24] For the NLP formulated in this study, the diameters of pipes are treated as continuous variables, and the constraint for the diameters are given by Dmin � D � Dmax ;
L Q� ; C � D�
L V2 ; Darcy-Weisbach : hf ¼ f D 2g
ð5Þ
where Dmin and Dmax are the minimum and maximum allowable pipe sizes, respectively. [25] The continuous solution for the shortest-distance tree network, complemented by the chords of the shortestdistance tree set to the minimum allowable pipe diameters, is an approximately optimal solution for the original looped water network. For the final step, this approximately optimal solution needs to be replaced using commercially available discrete pipe sizes, and cannot be guaranteed to be the global optimal solution on the basis of the assumption that was made in step 1. To obtain the global optimal solution using commercially available pipe diameters on the basis of the current solution achieved in step 2, a DE algorithm is applied and the optimization is moved to step 3. 2.3. Step 3: The Differential Evolution Algorithm [26] The differential evolution (DE) algorithm, introduced by Storn and Price [1995], is found to be a relatively simple but powerful EA for global optimization. There are three important operators involved in the DE algorithm including the mutation, crossover, and selection operators, which is quite similar to the GAs. Several parameters that need to be determined in the use of the DE include population size (N), mutation weighting factor (F), and crossover rate (CR). A DE differs significantly compared to a GA in the mutation process such that the mutant solution is generated by adding the weighted difference (F) between two random population members to third member. The process of DE is given as follows. 2.3.1. Initialization [27] The DE is a population-based stochastic search technique. Thus, a set of members of the initial population is required to initializen the DE search. Normally, each inio 1 2 D tial population Xi;0 ¼ xi;0 ; xi;0 ; . . . . . . . . . xi;0 is generated by randomizing individuals from a uniform distribution within the search space, that is
ð2Þ xji;0 ¼ xjmin þ randð0; 1Þðxjmax � xjmin Þ i ¼ 1; 2; . . . ; N ;
k¼1
Hazen-Williams : hf ¼ !
W08531
j ¼ 1; 2; . . . ; D;
ð3Þ
ð4Þ
where, hfk ¼ the head loss in pipe k, Hs ¼ the head at source node, Himin ¼ the head requirement at node i, m ¼ the total
ð6Þ
where xji;0 ¼ the initial value of the j-th parameter for the i-th individual in the initial population, xjmin and xjmax ¼ the minimum and maximum bounds of the j-th parameter, respectively, rand(0, 1) represents a uniform distributed random variable in the range [0, 1], while N and D ¼ the
4 of 18
W08531
ZHENG ET AL.: COMBINED NLP-DE FOR OPTIMIZING WATER NETWORKS
population size and dimension of the vector, respectively. The population size is not changed during the DE evolution process. 2.3.2. Mutation [28] The DE is mainly driven by its mutation strategy compared with the GAs. A mutant vector Vi,G, with respect to each individual Xi,G, is produced by adding the weighted difference (F) between two random population members to a third member from the current population. Each individual Xi,G associated with a mutant vector is denoted as the target vector. A frequently used mutation strategy in DE is given as follows: Vi;G ¼ Xr1i ;G þ FðXr2i ;G � Xr3i ;G Þ;
ð7Þ
where Vi,G ¼ the mutant vector with respect to the target vector of Xi,G at generation G, Xr1i ;G , Xr2i ;G , Xr3i ;G are three vectors randomly selected from the current population (r1i 6¼ r2i 6¼ r3i ). These three indexes are randomly generated for each mutant vector. F is the mutation weighting factor. 2.3.3. Crossover [29] After the mutation, a trial vector Ui,G is generated though selecting solution component values either from Xi,G or Vi,G. In the basic DE version [Storn and Price, 1995], uniform crossover is employed as uji;G
( ¼
vji;G ;
if randð0; 1Þj � CR
xji;G ;
otherwise
;
ð8Þ
where uji;G , vji;G , xji;G ¼ the j-th parameter for the i-th trial, mutant, and target vectors, respectively, CR is the crossover rate within the range of [0, 1], rand(0, 1)j is a random number between 0 and 1 generated for each parameter j. If rand(0, 1)j is smaller than CR, the parameter vji;G in the mutant vector is copied to the trial vector, otherwise, the parameter xji;G in the target vector is copied to the trial vector. 2.3.4. Selection [30] After crossover, all the trial vectors are evaluated using the objective function f(Ui,G) and are compared with their corresponding trial vector objective function f(Xi,G). The vector with a lower objective function value (given a minimization problem) survives for the next generation. That is X i;Gþ1 ¼
�
U i;G ; X i;G ;
if f ðU i;G Þ � f ðX i;G Þ ; otherwise
ð9Þ
where Xi,Gþ1 is the i-th individual at the generation G þ 1. [31] Mutation, crossover, and selection are repeatedly applied generation by generation until the stopping criterion is satisfied. It is observed that the basic DE is a continuous global optimization search algorithm. As a result, DE should be modified to solve discrete WDS optimization problems. A new approach to deal with the truncation of the continuous variables to the available discrete pipe sizes is proposed. The continuous pipe sizes are rounded to the nearest commercially available pipe diameter after application of the mutation operator given in equation (7). Each vector element is checked after application of the mutation operator. If its value is smaller or larger than the minimum or maximum allowable pipe size, then the minimum or
W08531
maximum allowable pipe size is assigned. If its value is between two sequentially discrete pipe diameters, the discrete pipe diameter that is closest is assigned. In addition, constraint tournament selection is used in the DE to handle head constraints [Deb, 2000]. [32] The NLP continuous pipe diameter solution obtained in step 2 is used to initialize or seed the population for DE optimization. In this study, the initial population of the DE was generated by randomly selecting pipe diameters for each decision variable from a set of limited options on the basis of the NLP optimal solution instead of all available pipe diameters. The set of limited pipe diameter options is referred to as a seeding table for its corresponding pipe. Two different initial seeding tables are created for the continuous pipe-size solution of the shortest-distance tree network. One seeding table consists of two adjacent pipe diameters, one having a discrete diameter that is immediately larger than the NLP continuous pipe size and the other having a discrete diameter that is immediately smaller. The other seeding table is composed of four adjacent pipe diameters, two having discrete diameters that are larger than the NLP continuous pipe size and the other two having discrete diameters that are smaller. The DE that is seeded with two pipe diameters is denoted as NLP-DE1, while the DE that is seeded with four pipe diameters is denoted as NLP-DE2. These two DEs that are seeded with different sizes from initial tables are applied to the four case studies. For the initial DE population, pipe diameters in the range of initial seeding tables are randomly selected. For each chord of the shortest-distance tree, the two and four adjacent minimum permissible pipe sizes are randomly selected for the NLP-DE1 and -DE2 initial population, respectively. It is noted that, with this approach, each decision variable has only two or four tailored optional pipe sizes to be randomly selected for starting the DE exploration. Thus, the initial solutions that need to be evolved are scattered in the region around the approximate-optimal solution produced in step 2, rather than randomly distributed throughout the entire search space. It should be highlighted that the tailored seeding table obtained in step 2 is used only to initialize the DE’s search, and it does not necessarily specify a limited search space for the DE exploration. That is, in step 3 the DE is not limited to only explore the interior region of the search space defined by the initial seeding table, but the search can expand to the region that is outside the initial seeding table. Hence, the finally selected pipe diameters for some pipes may be outside those contained in the initial seeding table.
3.
Case Study Results and Discussion
[33] The Dijkstra algorithm that is used in step 1 and the DE that is used in step 3 has been coded in Cþþ. The NLP formulated in step 2 is solved by software Lingo12 [LINDO Systems Inc., 2009]. The DE application in step 3 combines the EPANET2.0 solver [Rossman, 2000]. Four case studies are used to verify the effectiveness of the proposed optimization approach including the New York Tunnels problem (NYTP), the Hanoi problem (HP), the Zhi Jiang network (ZJ), and the Balerma network (BN). The Hazen-Williams formula is used to calculate the head loss for the NYTP, HP, and ZJ case studies and the Darcy-Weisbach formula is
5 of 18
W08531
ZHENG ET AL.: COMBINED NLP-DE FOR OPTIMIZING WATER NETWORKS
used for the BN case study. Storn and Price [1995] recommended the parameter ranges for the DE of ID � N � 10D, 0.3 � F � 0.9, 0.5 � CR � 1.0 as the DE with these parameter ranges showed generally favorable performance in terms of convergence properties. For each case study in this paper, a preliminary sensitivity analysis was performed to determine the effective N, F, and CR values on the basis of the range given by Storn and Price [1995] for each parameter. 3.1. Case Study 1: New York Tunnels Problem (NYTP) [34] A schematic of the NYTP system is given as Figure 2. The network has 21 existing tunnels and 20 nodes fed by a fixed-head reservoir. The details of this network, including the head constraints, pipe costs, and water demands are given by Dandy et al. [1996]. The objective is to determine which pipe should be installed in parallel with the existing pipes such that the cost is minimized while satisfying the minimum head requirement at all nodes.
Figure 2.
W08531
There are 15 pipe diameters that can be selected for the NYTP. In addition, a zero pipe size provides a total of 16 options (15 actual pipe diameters plus a zero pipe size) for each link. Thus, the total search space is 16 21 (�1.934 � 1025). [35] In step 1, the Dijkstra algorithm is applied for the NYTP network to identify the shortest-distance tree. The identified shortest-distance tree is given in Figure 3. As shown in Figure 3, pipes 10 and 20 are identified as the chords and all of the other pipes form the shortest-distance tree. Since the NYTP is an existing water network and the diameters of chords (pipes 10 and 20) are known, the two proposed methods (see section 2.2) are used to determine the flow distribution for the shortest-distance tree. The flow results for the shortest-distance tree determined by methods 1 and 2 described in section 2.2 are given in the second and third columns of Table 2. [36] In step 2, two separate NLPs are formulated for the shortest-distance tree with two sets of different flow
The layout of the New York Tunnels. 6 of 18
W08531
ZHENG ET AL.: COMBINED NLP-DE FOR OPTIMIZING WATER NETWORKS
Figure 3.
W08531
The layout of the shortest-distance tree of the New York Tunnels problem (NYTP) network.
distributions and solved. The two NLP continuous solutions as shown in the fourth and fifth columns of Table 2 complemented by chords of the shortest-distance tree with minimum pipe sizes (0 in. for the NYTP case study) produced optimal solutions with a cost of $55.12 and $34.78M, respectively. Thus, the optimal solution produced by the assumption that flows in the chords are taken to be equal to that from the hydraulic analysis for the original water network (method 2 in section 2.2), and is better than that produced on the basis of the assumption that no flows exist in these chords (method 1 in section 2.2). This indicates that method 2 is more effective for a WDS optimization that includes existing pipes. The NLP solution on basis of the method 2 (mentioned in section 2.2) is adopted for further analysis in this study. The final best solution obtained by the combined NLP-DE approach for the NYTP case study is given in the last column of Table 2. It is observed that the design of the solution obtained in step 2 (in the fifth
column) is close to the final best solution as it has 15 pipes with the same diameter of zero. [37] On the basis of the continuous pipe diameter solution obtained in step 2, two different initial seeding tables are created including seeding tables for both NLP-DE1 and -DE2 as shown in Table 2 (columns 6 and 7). [38] Both DE applications were assumed to have identical parameters including population size (N), maximum allowable number of evaluations (MAE), mutation weighting factor (F), and crossover rate (CR), while seeded with different initial pipe diameters. For the NYTP case study, N ¼ 50, MAE ¼ 20,000, F ¼ 0.7, and CR ¼ 0.8 were used. A total of 100 different DE runs using different starting random number seeds were performed for each of these two DE applications. [39] The statistics of the results for the NYTP case study are given in Table 3. These include the best solution found, percentage of trials for which the current best solution was
7 of 18
W08531
ZHENG ET AL.: COMBINED NLP-DE FOR OPTIMIZING WATER NETWORKS
W08531
Table 2. Initial Seeding Tables for the NYTP Case Study and the Combined NLP-DE Results
Links
Pipe Diameters ( in.) Flows in the Flows in the Shortest-Distance Shortest-Distance The NLP Solution The NLP Solution Initial Seeding Table Initial Seeding Table Combined NLP-DE Treea (m3 s�1) Treeb (m3 s�1) Produced in Step 2a Produced in Step 2b for NLP-DE1 for NLP-DE2 Final Solution (in.)
1 2 3 4 5 6 7 8 9 10c 11 12 13 14 15 16 17 18 19 20c 21 Cost ($M)
29.00 26.39 23.77 21.27 18.77 16.28 13.78 11.28 1.65 0.00 9.63 19.58 22.89 25.51 28.12 1.63 6.63 3.31 4.81 0.00 4.81 -
24.48 21.86 19.24 16.75 14.25 11.75 9.25 6.76 1.66 4.86 14.16 24.10 27.42 30.04 32.65 1.63 6.63 3.32 4.48 0.33 5.15 -
157.16 138.78 0.00 0.00 0.00 0.00 144.93 124.58 0.00 0.00 0.00 0.00 0.00 0.00 0.00 67.13 91.50 72.53 53.68 0.00 71.55 55.12
0.00 0.00 0.00 0.00 0.00 0.00 111.31 0.00 0.00 0.00 0.00 0.00 0.00 0.00 0.00 72.94 100.39 80.01 59.31 0.00 76.03 34.78
0, 36 0, 36 0, 36 0, 36 0, 36 0, 36 108, 120 0, 36 0, 36 0, 36 0, 36 0, 36 0, 36 0, 36 0, 36 72, 84 96, 108 72, 84 48, 60 0, 36 72, 84 -
0, 36, 48, 60 0, 36, 48, 60 0, 36, 48, 60 0, 36, 48, 60 0, 36, 48, 60 0, 36, 48, 60 96, 108, 120, 144 0, 36, 48, 60 0, 36, 48, 60 0, 36, 48, 60 0, 36, 48, 60 0, 36, 48, 60 0, 36, 48, 60 0, 36, 48, 60 0, 36, 48, 60 60, 72, 84,96 84, 96, 108,120 60, 72, 84, 96 36, 48, 60, 72 0, 36, 48, 60 60, 72, 84, 96 -
0 0 0 0 0 0 144 0 0 0 0 0 0 0 0 96 96 84 72 0 72 38.64
a
Flows and NLP solution are determined on basis of the assumption that there are no flows in chords (pipes 10 and 20). Flows and NLP solution are determined on basis of the assumption that flows in chords (pipes 10 and 20) are the same with that of performing the hydraulic analysis for the original water network. c The chords of the NYTP network. b
found, the average cost solution, the worst solution found, and the average number of evaluations to find the best cost solution on the basis of the different runs. For comparison, Table 3 also lists the results of other optimization techniques that have previously been used to optimize the NYTP case study. [40] The best known solution for the NYTP case study is $38.64M first found by Maier et al. [2003] with the ant colony optimization technique. This best known solution was also found by the proposed combined NLP-DE optimization technique. As shown in Table 3, NLP-DE1 and -DE2 exhibited similar performance in terms of percentage of the best known solutions found. NLP-DE1 was only slightly better than NLP-DE2 in terms of convergence speed. For the NYTP case study, the proposed optimization algorithm
variants located the current best solution with a frequency of 99%, which is higher than that of other optimization techniques including HD-DDS [Tolson et al., 2009], DE [Dandy et al., 2010], MMAS-ACO [Zecchin et al., 2006], GA [Zheng et al., 2010], PSO [Dandy et al., 2010], and the PSO variant [Tolson et al., 2009] as shown in Table 3. [41] In terms of efficiency, the proposed new algorithm exhibited the best performance on the NYTP case study as it was able to locate the best known solution faster than other algorithms as shown in Table 3. The maximum allowable evaluations for the NYTP case study was 20,000 and the average number of evaluations required to find the best solution for the NYTP case study were 8,277 for NLP-DE1 and 10,631 for NLP-DE2. Both values are far less than those of other optimization techniques.
Table 3. Algorithm Performance for the NYTP Case Study
Algorithm
Number of Different Runs
NLP-DE1a NLP-DE2b HD-DDSc DE-Dandyd MMAS-ACOe Standard GAf PSOd PSO variantc
100 100 50 30 20 1000 30 2000
Maximum Number Average Number of Average Cost Percentage of Trials Best Solution Worst Solution Evaluations to Find of Allowable Solution With Best Solution Found Found ($M) Best Solutions Evaluations ($M) (%) ($M) 38.64 38.64 38.64 38.64 38.64 38.64 38.64 38.64
99 99 86 70 60 45 33 30
38.64 38.64 38.65 40.33 39.00 38.93 38.83
a
38.80 38.80 38.77 51.16 -
NLP-DE1: DE seeded with two tailored pipe diameters on the basis of the NLP solution obtained in step 2. NLP-DE2: DE seeded with four tailored pipe diameters on the basis of the NLP solution obtained in step 2. c Tolson et al. [2009]. d Dandy et al. [2010]. e Zecchin et al. [2006]. f Zheng et al. [2010]. b
8 of 18
20,000 20,000 50,000 100,000 50,000 100,000 100,000 80,000
8277 10,631 47,000 30,711 49,950 -
W08531
ZHENG ET AL.: COMBINED NLP-DE FOR OPTIMIZING WATER NETWORKS
3.2. Case Study 2: Hanoi Problem (HP) [42] The Hanoi Problem (HP) is a network design where all new pipes are to be selected. The layout of the HP network is given in Figure 4. The network is composed of 34 pipes and 32 nodes which are fed by a single reservoir with a head of 100 m. The minimum head requirement of the other nodes is 30 m. A total of six pipe diameters of 12, 16, 20, 24, 30, and 40 in. can be selected for each new pipe. The total search space is 6 34 � 2.8651 � 1026. The HazenWilliams coefficient for each new pipe is 130. Details of this network and the formulation of the cost for pipes are given in Fujiwara and Khang [1990]. [43] In step 1, the shortest-distance tree for the HP network is shown in Figure 5 on the basis of the Dijkstra algorithm. As can be seen from Figure 5, pipes 13, 26, and 31 are identified to be the chords. All of the discharges in the links can be determined on the bais of method 2 described in section 2.2 for this shortest-distance tree as shown in the second column of Table 4. [44] An NLP is formulated for the shortest-distance tree of the HP network and solved in step 2. The continuous pipe diameters solution is given in the third column of Table 4. This solution, complemented by chords with minimum pipe sizes (12 in. for the HP case study), produced an approximately optimal solution with a cost of $5.924M.
Figure 4.
W08531
The final best solution produced by the combined NLP-DE approach, for the HP case study applied in step 3, is given in the last column of Table 4. It is observed that the NLP continuous pipe diameters solution is close to the final best solution design as many continuous pipes diameters fall in the proximity of pipe diameters of the final best solution. On the basis of the continuous pipe diameters solution achieved in step 2, the tailored seeding tables that were created for each pipe for NLP-DE1 and -DE2 are given in the fourth and fifth columns of Table 4, respectively. [45] For the HP case study, the parameters including N ¼ 80, MAE ¼ 80,000, F ¼ 0.7, and CR ¼ 0.8 were used for NLP-DE1 and -DE2. A total of 100 DE runs with different starting random number seeds have been implemented for each DE application. Table 5 gives the results of the proposed method applied to the HP case study. The results obtained by other optimization techniques for the HP case study are also included in Table 5 to enable performance comparison. The current best known solution for the HP case study with value of $6.081M was first found by Reca and Mart�ınez [2006] using a GA variant (GENOME). This solution has been also found by the proposed optimization approach. [46] As can be seen from Table 5, NLP-DE1 and -DE2 show a similar performance in finding the best known
The layout of the Hanoi Problem network. 9 of 18
W08531
ZHENG ET AL.: COMBINED NLP-DE FOR OPTIMIZING WATER NETWORKS
Figure 5.
W08531
The layout of the shortest-distance tree of the HP network.
solution, while NLP-DE1 was found to show slightly better performance than NLP-DE2 in terms of convergence speed. The proposed new optimization models achieved the best performance in terms of percentage of trials with which the best solution was found among all the algorithms mentioned in Table 5. As shown in Table 5, NLP-DE1 and -DE2 located the best known solution for the HP case study in 97% and 98% of the optimization trials compared to 80% of the DE used in Suribabu [2010], 10% of GENOME GA proposed by Reca and Mart�ınez [2006], 8% of HD-DDS proposed by Tolson et al. [2009], and 5% of the PSO variant used in Tolson et al. [2009]. The worst solutions produced NLP-DE1 and -DE2 in the 100 different optimization trials were $6.108 and $6.100M, respectively, which deviates only 0.444% and 0.312% from the current best known solution. The standard GA [Dandy et al., 2010], MMAS-ACO [Zecchin et al., 2006], and PSO [Dandy et al., 2010] were unable to locate the current best solution for the HP case study. The average number of evaluations required by NLPDE1 and -DE2 were 34,609 and 42,782, respectively, which are less than those reported for any other algorithm. 3.3. Case Study 3: ZJ Network [47] The ZJ network, taken from the eastern province of China, is an actual water network with a single reservoir. The reservoir has a fixed head of 45 m. There are 164 pipes, 113 demand nodes, and 50 primary loops (as shown in Figure 6). At each demand node, a minimum pressure of
22 m is required for the design of this water network. All of the pipes are assumed to have an identical Hazen-Williams coefficient of 130. The objective is to determine the least cost design of this water network, while satisfying the pressure constraints. A total of 14 commercial available pipe diameters ranging from 150 up to 1000 mm can be selected for each pipe. Thus, the total search space is 14 164 � 9.2257 � 10187. [48] The shortest-distance tree of the ZJ network determined in step 1 is shown in Figure 7. The NLP continuous pipe diameters solution obtained in step 2, plus the chords with minimum allowable pipe sizes (150 mm for the ZJ network case study) provide an approximately optimal solution with a cost of $6.970M. Since this is a new case study that has not been investigated previously, a DE algorithm is applied to optimize this water network directly in order to enable a comparison of results. A total of three DE applications have been performed for the ZJ network optimization including a DE seeded with two tailored pipe diameters for each pipe (NLP-DE1), a DE seeded with four tailored pipe diameters for each pipe (NLP-DE2), and a DE seeded with all 14 available pipe diameters. For each DE application, the parameters including, N ¼ 500, MAE ¼ 2,000,000, F ¼ 0.3, and CR ¼ 0.8 were used. A total of 10 DE runs with different starting random number seeds have been implemented for each DE application. [49] The solutions obtained by the three DE variants and statistics of the results are given in Figure 8 and Table 6,
10 of 18
W08531
ZHENG ET AL.: COMBINED NLP-DE FOR OPTIMIZING WATER NETWORKS
W08531
Table 4. Initial Seeding Tables for the HP Case Study and the Combined NLP-DE Results
Links 1 2 3 4 5 6 7 8 9 10 11 12 13a 14 15 16 17 18 19 20 21 22 23 24 25 26a 27 28 29 30 31a 32 33 34 Cost ($M) a
Pipe Diameters (in.)
Flows in the Shortest-Distance Tree (m3 s�1)
The NLP Solution Produced in Step 2
Initial Seeding Table for NLP-DE1
Initial Seeding Table for NLP-DE2
Combined NLP-DE Final Solution (in.)
40.00 40.00 39.81 39.59 38.29 36.29 33.08 31.52 29.84 27.88 25.65 19.28 12.00 15.70 17.51 26.79 29.22 32.24 32.36 39.11 17.37 12.72 33.08 26.66 23.38 12.00 18.23 20.15 16.10 13.56 12.00 15.63 16.84 22.54 5.924
30, 40 30, 40 30, 40 30, 40 30, 40 30, 40 30, 40 30, 40 24, 30 24, 30 24, 30 16, 20 12, 16 12, 16 16, 20 24, 30 24, 30 30, 40 30, 40 30, 40 16, 20 12, 16 30, 40 24, 30 20, 24 12, 16 16, 20 20, 24 16, 20 12, 16 12, 16 12, 16 16, 20 20, 24 -
20, 24, 30, 40 20, 24, 30, 40 20, 24, 30, 40 20, 24, 30, 40 20, 24, 30, 40 20, 24, 30, 40 20, 24, 30, 40 20, 24, 30, 40 20, 24, 30, 40 20, 24, 30, 40 20, 24, 30, 40 12, 16, 20, 24 12, 16, 20, 24 12, 16, 20, 24 12, 16, 20, 24 20, 24, 30, 40 20, 24, 30, 40 20, 24, 30, 40 20, 24, 30, 40 20, 24, 30, 40 12, 16, 20, 30 12, 16, 20, 30 20, 24, 30, 40 20, 24, 30, 40 16, 20, 24, 30 12, 16, 20, 24 12, 16, 20, 24 16, 20, 24, 30 12, 16, 20, 24 12, 16, 20, 24 12, 16, 20, 24 12, 16, 20, 24 12, 16, 20, 24 16, 20, 24, 30 -
40 40 40 40 40 40 40 40 40 30 24 24 20 16 12 12 16 24 20 40 20 12 40 30 30 20 12 12 16 12 12 16 16 24 6.081
5.54 5.29 1.89 1.86 1.65 1.38 1.00 0.85 0.70 0.56 0.42 0.26 0.00 0.17 0.25 0.69 0.93 1.30 1.32 1.85 0.39 0.13 1.10 0.63 0.40 0.00 0.25 0.35 0.18 0.10 0.00 0.10 0.13 0.35
The chords of the HP network.
respectively. It is clearly seen from Figure 8 that NLP-DE1 converged the fastest and the DE3 converged the slowest. Although NLP-DE2 converged slower than NLP-DE1, NLP-DE2 was able to produce lower cost solutions. It is noted that the solutions obtained by NLP-DE1 and -DE2 are less scattered than those found by DE3. This shows that
the solutions of NLP-DE1 and -DE2 are less dependent on the starting random number seeds. [50] As observed from Table 6, different NLP-DE1 runs are significantly more computationally efficient than DE3. This is evidenced by the fact that NLP-DE1 only required a total of 8.44% of the computation overhead required by
Table 5. Algorithm Performance for the HP Case Study
Algorithm
Number of Different Runs
Best Solution Found ($M)
Percentage of Trials With Best Solution Found (%)
Average Cost Solution ($M)
Worst Solution ($M)
Maximum Number of Allowable Evaluations
Average Number of Evaluations to Find Best Solutions
NLP-DE1 NLP-DE2 DE-Surbabua GENOMEb HD-DDSc PSO variantc Standard GAd MMAS-ACOe PSOd
100 100 50 10 50 2000 30 20 30
6.081 6.081 6.081 6.081 6.081 6.081 6.126 6.134 6.373
97 98 80 10 8 5 0 0 0
6.082 6.081 6.248 6.252 6.310 6.214 6.394 6.483
6.108 6.100 6.450 6.408 6.550 6.368 6.635 6.801
80,000 80,000 100,000 150,000 100,000 80,000 500,000 100,000 500,000
34,609 42,782 48,724 100,000 85,571 -
a
Suribabu [2010]. Reca and Mart�ınez [2006]. c Tolson et al. [2009]. d Dandy et al. [2010]. e Zecchin et al. [2006]. b
11 of 18
W08531
ZHENG ET AL.: COMBINED NLP-DE FOR OPTIMIZING WATER NETWORKS
Figure 6.
Figure 7.
The layout of the ZJ network.
The layout of the shortest-distance tree of the ZJ network. 12 of 18
W08531
W08531
ZHENG ET AL.: COMBINED NLP-DE FOR OPTIMIZING WATER NETWORKS
Figure 8.
W08531
The solution distributions for the ZJ case study.
that of DE3. This shows that the DE seeded with two tailored pipe diameters derived from the approximately optimal solution obtained from NLP in step 2 is able to find optimal solutions with significantly enhanced computational efficiency. [51] As can be seen from Table 6, the NLP-DE2 found the current best solution for this case study with a cost of $7.082M, 0.42% cheaper than the best solution found by DE3. Additionally, the worst solution found by the 10 NLP-DE2 runs was lower than the best solution found by DE3. It is noted that NLP-DE2 converged quicker than DE3 as the average number of evaluations required to converge by 10 different NLP-DE2 runs is only 48.84% of that required by DE3. 3.4. Case Study 4: Balerma Network (BN) [52] The Balerma network (BN), an irrigation water distribution network located in the province of Almeria (Spain), was first investigated by Reca and Mart�ınez [2006]. It consists of four reservoirs, eight loops, 454 pipes, and 443 demand nodes as shown in Figure 9. A total of 10 PVC commercial pipes with nominal diameters from 125 to 600 mm are to be selected for this network. Thus, the search space is 10454, which is significantly larger than the previous three case studies in this paper. All of the pipes are assumed to have an absolute roughness height of k ¼ 0.0025 mm and the minimum required pressure at each node is 20 m. Pipe costs are given in Reca and Mart�ınez [2006].
[53] Since there are four reservoirs involved in the Balerma network, the proposed extension to the Dijkstra algorithm described in section 2.1.2 is employed to find the shortest-distance tree for this multisource WDS. The shortest-distance tree for the Balerma network identified, on the basis of the proposed extension of the Dijkstra algorithm, is given in Figure 10. It is seen from Figure 10 that the original Balerma network has been decomposed into four subnetworks connected via an artificial node and four artificial links. An NLP is formulated for this tree network and solved in step 2, producing an approximately optimal solution with a cost of €2.114M (all of the chords are assumed to be the smallest pipe size). Note that the artificial node and artificial links are not included in the NLP. For the BN case study, like the ZJ case study, a total of three DE applications are carried out. These include a DE seeded with two tailored pipe diameters for each pipe (NLP-DE1), a DE seeded with four tailored pipe diameters for each pipe (NLP-DE2), and a DE seeded with all 10 available pipe diameters. For each DE application, the parameters used were N ¼ 500, MAE ¼ 10,000,000, F ¼ 0.3, and CR ¼ 0.8. A total of 10 DE runs with different starting random number seeds have been implemented for each DE application. The solution distribution and a summary of results are given in Figure 11 and Table 7, respectively. [54] As can be seen from Figure 11, the NLP-DE1 and -DE2 runs located overall lower cost solutions for the BN case study compared to the DE3 runs with significantly less
Table 6. Algorithm Performance for the ZJ Case Study
Algorithm
Number of Different Runs
Best Solution Found ($M)
Percentage of Trials With Best Solution Found (%)
Average Cost Solution ($M)
Worst Solution Found ($M)
Maximum Number of Allowable Evaluations
Average Number of Evaluations to Find Best Solutions
NLP-DE1 NLP-DE2 DE3
10 10 10
7.167 7.082a 7.112
0 10 0
7.170 7.093 7.136
7.175 7.105 7.220
2000,000 2000,000 2000,000
69,300 400,853 820,657
a
The current best solution for the ZJ case study.
13 of 18
W08531
ZHENG ET AL.: COMBINED NLP-DE FOR OPTIMIZING WATER NETWORKS
Figure 9.
Figure 10.
The layout of the Balerma network.
The layout of the shortest-distance tree of the Balerma network. 14 of 18
W08531
W08531
ZHENG ET AL.: COMBINED NLP-DE FOR OPTIMIZING WATER NETWORKS
Figure 11.
W08531
The solution distributions for the Balerma network (BN) case study.
computational effort. NLP-DE2 converged slightly slower than NLP-DE1, while being able to find better quality solutions as shown in Figure 11. It is seen from Table 7, the average number of evaluations required to find the better quality solutions for NLP-DE1 and -DE2 are only 4.47% and 15.50% of that required by DE3. This shows that a DE with initial estimates provided by an NLP run in the proposed optimization approach is able to locate better quality solutions with a significantly faster convergence speed than a DE without initial estimates. In addition, the solutions produced by NLP-DE1 and -DE2 are less scattered than those of DE3 for the BN case study. The NLP-DE2 produced a new, currently lowest cost solution with a value of €1.923M for the BN case study. [55] On comparing the algorithmic performance with other optimization techniques, the proposed new optimization approach (NLP-DE1 and -DE2) performed the best in terms of quality of the best solution found and efficiency as shown in Table 7. NLP-DE1 found the same best cost solution with a value of €1.956M as that found by HD-DDS [Tolson et al., 2009] in a total of 10 different runs. However, it is noted that the computational budget for the
NLP-DE1 was only 10% of that for HD-DDS-2 [Tolson et al., 2009]. The HD-DDS-1 [Tolson et al., 2009] found the previous best solution with a value of €1.941M using 30M evaluations, while the NLP-DE2 located a new lower cost solution with a cost of €1.923M using only 2M evaluations (6.67% of the computational budget required by HD-DDS-1). In addition, the worst solution produced by 10 different NLP-DE2 runs was €1.934M, which is still lower that the best solution found by HD-DDS [Tolson et al., 2009], GHEST [Bolognesi et al., 2010], and GENOME GA [Reca and Mart�ınez, 2006]. This implies that the proposed optimization approach is able to locate better quality solutions with significantly improved computational efficiency when dealing with such large-scale water networks. 3.5. Summary of Results [56] It has been shown that the new proposed NLP-DE algorithm has outperformed all the other optimization algorithms in terms of efficiently finding optimal solutions for the four case studies. The dominance of the proposed method is more clearly shown for the larger networks including the ZJ and BN case studies. In terms of solution
Table 7. Algorithm Performance for the BN Case Study
Algorithm
Number of Different Runs
Best Solution Found ($M)
NLP-DE1 NLP-DE2 DE3 HD-DDS-1b HD-DDS-2b GHESTc GENOME GAd
10 10 10 1 10 10
1.956 1.923a 1.982 1.941 1.956 2.002 2.302
Percentage of Trials With Best Solution Found (%) 0 10 0 0 0 0
Average Cost Solution ($M)
Worst Solution Found ($M)
Maximum Number of Allowable Evaluations
Average Number of Evaluations to Find Best Solutions
1.957 1.927 1.986 2.055 2.334
1.959 1.934 1.989 2.350
1000,000 2000,000 10,000,000 30,000,000 10,000,000 10,000,000 10,000,000
412,000 1427,850 9210,143 254,400 -
a
A new current best solution for the BN case study. HD-DDS-1 and HD-DDS-2 are HD-DDS approach with maximum number of allowable evaluations of 30,000,000 and 10,000,000, respectively. b Tolson et al. [2009]. c Reca and Mart�ınez [2006]. d Bolognesi et al. [2010].
15 of 18
W08531
ZHENG ET AL.: COMBINED NLP-DE FOR OPTIMIZING WATER NETWORKS
quality, NLP-DE1 yielded a similar performance to NLPDE2 for relatively small water networks (such as the NYTP and HP case studies). However, for relatively larger water networks (such as the ZJ and BN cases studies), NLP-DE1 was able to converge faster than NLP-DE2, while NLPDE2 found lower cost solutions than NLP-DE1. This is explained by the fact that NLP-DE2 was seeded with an initial seeding table with four different pipe diameters, while NLP-DE1 was initialized with a seeding table consisting of only two different pipe diameters. Consequently, NLP-DE2 explored a relatively larger search space than NLP-DE1, and hence resulted in a greater search time but with better quality solutions being found. Based on the observation of this study, a DE seeded with two tailored pipe diameters on the basis of the NLP solution (NLP-DE1) is recommended for relatively small water network optimization. For relatively large WDS case studies, DE seeded with four tailored pipe diameters on the basis of the NLP solution (NLP-DE2) is recommended. For a WDS case study with a larger number of pipes and loops, the continuous diameter solution obtained in step 2 with the NLP may be more of an approximation to the actually global optimum as more pipes are removed than chords. In such a case, the initial seeding table on the basis of this continuous diameter solution can be further increased in size (for example, to say six successive pipes diameters to be included in the seeding table for each pipe). As a result, this should lead to a more effective seeding of the DE exploration. [57] It has also been found from this study that, for the optimization problem of designing a completely new WDS, the flows in the shortest-distance tree determined by the assumption that there is no discharge in the chords (method 1 in section 2.2) is effective. For the expansion of an existing WDS optimization problem (such as the NYTP case study), the flows in the shortest-distance tree determined by the assumption that the discharges in the chords are set to be equal to that from the hydraulic calculation for the original existing WDS (method 2 in section 2.2) is the most effective. [58] In the proposed method, the shortest path is used as a surrogate indicator of the main flow paths within the network (the network tree). It is considered that the accuracy of this assumption will be reduced in situations where there are significant differences in nodal elevations. However, the NLP solution based on the assumed tree is simply used to identify an initial seeding table for seeding the DE optimization. Minor changes in the NLP solution may not
W08531
necessarily vary the initial seeding table components as the two or four adjacent discrete pipe sizes based on the continuous diameter pipe solution from the NLP are included in the seeding table for each pipe. In addition, our experiments have shown that a moderate change to the initial seeding table components does not influence the performance of DE significantly, as the DE is able to progress the search outside of the bounds of the seeding table. The BN case study involved in this study is a network having significant nodal elevation differences, however, the proposed method was observed to exhibit satisfactory performance on this case study in terms of solution quality and efficiency (see Table 7). [59] An analysis of the computational effort required in steps 1 and 2 in the proposed optimization approach has been undertaken. The computational time required to find the shortest-distance tree and to run the NLP solver for each case study is converted to an equivalent number of case study evaluations, respectively. Note that all of these tests were performed on the same computer (Pentium PC at 3.0 GHz). The results are given in Table 8. It can be seen from Table 8 that the computational effort required to find the shortest-distance tree in step 1 and to run the NLP solver in step 2 is negligible compared to that required in step 3. Thus, the computational effort in running the Dijkstra algorithm and NLP for each case study has not been included in the total computational overhead. For example, the computational overhead of running the Dijkstra algorithm and NLP for the ZJ case study is only 0.19%, 0.033%, and 0.014% of that required by the NLP-DE1, -DE2, and -DE3, respectively. This implies that it is computationally efficient to find the shortest-distance tree and solve the NLP for the shortest-distance tree for a given WDS. This further improves the attractiveness of the proposed approach for optimization of WDSs.
4.
Conclusions
[60] A new optimization approach aimed at optimizing the design of WDSs has been presented in this paper. This new approach divides the optimization process into three steps. These include: [61] 1. Find the shortest-distance tree for the looped WDS that is being optimized; [62] 2. Carry out an NLP optimization of the shortestdistance tree; and [63] 3. Optimize the original water network using the DE seeded on the basis of pipe sizes in the proximity of those found in step 2.
Table 8. Computational Effort Analysis for Finding the Shortest-Distance Tree and Running the NLP Solver for Each Case Study a
Case Study
Number of Decision Variables
Computational Effort Required to Find the Shortest-Distance Tree (Step 1)
Computational Effort Required to Solve the NLP for the Shortest-Distance Tree (Step 2)
Average Number of Evaluations Required by NLP-DE1 (Step 3)
Average Number of Evaluations Required by NLP-DE2 (Step 3)
NYTP HP ZJ BN
21 34 164 454
11 10 6 8
10 26 125 2133
8277 34,609 69,300 412,000
10,631 42,782 400,853 1427,850
a Note computational effort in steps 1 and 2 have been converted to an equation number of evaluations for its corresponding case study. One simulation for the NYTP, HP, ZJ, and BN case study on Pentium PC at 3.0 GHz was 0.001, 0.001, 0.016, and 0.015 s, respectively.
16 of 18
W08531
ZHENG ET AL.: COMBINED NLP-DE FOR OPTIMIZING WATER NETWORKS
[64] The shortest-distance tree is identified in step 1 using the Dijkstra algorithm. The shortest-distance tree is viewed as an optimal tree based on the assumption that delivering demand along the shortest path for each node is the most effective mode. A NLP is then formulated for optimizing the design of the shortest-distance tree in step 2 and has been solved by an NLP solver in this study. For each case study, a range of different initial starting points have been used for solving the NLP applied to the optimization of the shortest-distance tree. It was found that the final solution is identical for all of the different initial starting points. The continuous pipe diameter solution produced in step 2 complemented by the shortest-distance tree chords with the minimum allowable pipe sizes are used to create the initial seeding tables for the differential evolution (DE) optimization process. The DE optimization for finding the optimal discrete pipe-size solution in step 3 is seeded with the tailored pipe diameters-seeding tables created in step 2. [65] Results for four cases studies show that the proposed new combined NLP-DE optimization approach has superior convergence properties. For the NYTP and HP case studies, the proposed optimization technique reached the current best known solution for each network more frequently and more efficiently compared with other optimization techniques. For the ZJ and BN case studies, the proposed new optimization approach found the new lowest cost solutions with a cost of $7.082 and €1.923M, respectively. In addition, the new method produced optimal solutions with an extremely fast convergence speed. The consistent superior performance of the proposed optimization approach on four case studies illustrates that the proposed methodology is well suited for the least cost design of WDSs. [66] The utility of the proposed method is that it provides an efficient and effective approach for seeding the optimization of the full combinatorial problem using near optimal solutions (achieved by solving an approximated continuous problem with NLP). A natural extension of this method to find an approximate Pareto front for multiobjective problems (to seed a full multiobjective combinatorial search) could be achieved by incorporating one of the many approaches to map multiobjective problems to a series of single objective problems [Konak et al., 2006]. This approximate front would then be used to seed a multiobjective combinatorial optimizer (i.e., NSGA2, Deb et al. [2002]) to determine the actual front. This extension should be the focus of future research. Another issue that needs to be addressed is that the decision variables in this paper are only pipe diameters for the case studies, whereas the real WDS design problems may be more complex. Since the proposed methodology has shown to be effective for the pipes-only WDS design problems, future work should be focus on applying the proposed methodology to deal with the real-world WDS problems that may include pumps, valves, storage facilities, and pipes.
References Afshar, A., A. Zahraei, and M. A. Mariño (2009), Large-scale nonlinear conjunctive use optimization problem: Decomposition algorithm, J. Water Resour. Plann. Manage., 136(1), 59–71, doi:10.1061/(ASCE)07339496(2010)136:1(59). Alperovits, E., and U. Shamir (1977), Design of water distribution systems, Water Resour. Res., 13(6), 885–900, doi:10.1029/WR013i006p00885.
W08531
Bhave, P. R., and V. V. Sonak (1992), A critical study of the linear programming gradient method of optimal design of water supply networks, Water Resour. Res., 28(6), 1577–1584, doi:10.1029/92wr00555. Bolognesi, A., C. Bragalli, A. Marchi, and S. Artina (2010), Genetic heritage evolution by stochastic transmission in the optimal design of water distribution networks, Advances in Engineering Software, 41(5), 792– 801, doi:10.1016/j.advengsoft.2009.12.020. Cunha, M. C., and J. Sousa (2001), Hydraulic infrastructures design using simulated annealing, Journal of Infrastructure Systems, 7(1), 32–38, doi:10.1061/(ASCE)1076-0342(2001)7:1(32). Dandy, G. C., A. R. Simpson, and L. J. Murphy (1996), An improved genetic algorithm for pipe network optimization, Water Resour. Res., 32(2), 449–457, doi:10.1029/95wr02917. Dandy, G. C., A. Wilkins, and H. Rohrlach (2010), A methodology for comparing evolutionary algorithms for optimizing water distribution systems, Proceedings of the 12th Water Distribution System Analysis Symposium, Tucson, Arizona. Davidson, J., B. Francois, C. Stephen, and J. Paul (2005), Real-time connectivity modeling of water distribution networks to predict contamination spread, J. Comput. Civ. Eng., 19(4), 377–386, doi:10.1061/(ASCE) 0887-3801(2005)19:4(377). Deb, K. (2000), An efficient constraint handling method for genetic algorithms, J Comput. Methods Appl. Mech. Engineering, 186, 311–338, doi:10.1016/s0045-7825(99)00389-8. Deb, K., A. Pratap, S. Agawal, and T. Meyarivan (2002), A fast and elitist multi-objective genetic algorithm: NSGA-II, IEEE Trans Evol. Comput., 6(2), 182–197. Deo, N. (1974). Graph Theory with Applications to Engineering and Computer Science, 480 pp., Prentice-Hall, Englewood Cliffs, N. J. Deuerlein, J. W. (2008), Decomposition model of a general water supply network graph, J. Hydraul. Eng., 134(6), 822–832, doi:10.1061/(ASCE) 0733-9429(2008)134:6(822). Eusuff, M. M., and K. E. Lansey (2003), Optimisation of water distribution network design using shuffled frog leaping algorithm, J. Water Resour. Plann. Manage., 129(3), 210–225, doi:10.1061/(ASCE)0733-9496(2003) 129:3(210). Fujiwara, O., and D. B. Khang (1990), A two-phase decomposition method for optimal design of looped water distribution networks, Water Resour. Res., 26(4), 539–549, doi:10.1029/WR026i004p00539. Fujiwara, O., B. Jenchaimahakoon, and N. C. P. Edirisinghe (1987), A modified linear programming gradient method for optimal design of looped water distribution networks, Water Resour. Res., 23(6), 977–982, doi:10.1029/WR023i006p00977. Geem, Z. W., J. H. Kim, and G. V. Loganathan (2002), Harmony search optimization: Application to pipe network design, Int. J. Model. Simulat., 22(2), 125–133. Kadu, M. S., G. Rajesh, and P. R. Bhave (2008), Optimal design of water networks using a modified genetic algorithm with reduction in the search space, J. Water Resour. Plann. Manage., 134(2), 147–160, doi:10.1061/ (ASCE)0733-9496(2008)134:2(147). Konak, A., D. W. Coit, and A. E. Smith (2006), Multi-objective optimization using genetic algorithms: A tutorial, Reliability Eng. System Safety, 91, 992–1007, doi:10.1016/j.ress.2005.11.018. Krapivka, A., and A. Ostfeld (2009), Coupled genetic algorithm-linear rogramming scheme for least-cost pipe sizing of water-distribution systems, J. Water Resour. Plann. Manage., 135(4), 298–302, doi:10.1061/ (ASCE)0733-9496(2009)135:4(298). Lansey, K. E., and L. W. Mays (1989), Optimization model for water distribution system design, J Hydraul. Eng., 115(10), 1401–1417, doi:10.1061/ (ASCE)0733-9429(1989)115:10(1401). LINDO Systems Inc., (2009), LINGO12 User’s Guide, LINDO Systems Inc., Chicago, IL. Maier, H. R., A. R. Simpson, A. C. Zecchin, W. F. Foong, K. Y. Phang, H. Y. Seah, and C. L. Tan (2003), Ant colony optimization for the design of water distribution systems, J. Water Resour. Plann. Manage., 129(3), 200–209, doi:10.1061/(ASCE)0733-9496(2003)129:3(200). Montesinos, P., A. Garc�ıa, and J. L. Ayuso (1999), Water distribution network optimization using modified genetic algorithm, Water Resour. Res., 35(11), 3467–3473, doi:10.1029/1999wr900167. Murphy, L. J., and A. R. Simpson (1992), Pipe optimization using genetic algorithms, Research Report No. R93, Department of Civil Engineering, University of Adelaide, Australia. Reca, J., and J. Mart�ınez (2006), Genetic algorithms for the design of looped irrigation water distribution networks, Water Resour. Res., 42, W05416, doi:10.1029/2005WR004383.
17 of 18
W08531
ZHENG ET AL.: COMBINED NLP-DE FOR OPTIMIZING WATER NETWORKS
Reis, L. F. R., F. T. Bessler, G. A. Waters, and D. Savic (2006), Water supply reservoir operation by combined genetic algorithm-linear programming (GA-LP) approach, Water Resour. Manage., 20, 227–255, doi:10.1007/s11269-006-8049-z. Rossman, L. A. (2000), EPANET 2-User manual, National Risk Management Research Laboratory, Office of Research and Development, US Environmental Protection Agency, Cincinnati, OH. Savic, D. A., and G. A. Waters (1997), Genetic algorithms for least-cost design of water distribution networks, J. Water Resour. Plann. Manage., 123(2), 67–77, doi:10.1061/(ASCE)0733-9496(1997)123:2(67). Shinstine, D. S., I. Ahmed, and K. E. Lansey (2002), Reliability/availability analysis of municipal water distribution networks: Case studies, J. Water Resour. Plann. Manage., 128(2), 140–151, doi:10.1061/(ASCE)07339496(2002)128:2(140). Simpson, A. R., G. C. Dandy, and L. J. Murphy (1994), Genetic algorithms compared to other techniques for pipe optimization, J. Water Resour. Plann. Manage., 120(4), 423–443, doi:10.1061/(ASCE)0733-9496(1994) 120:4(423). Sonak, V. V., and P. R. Bhave (1993), Global optimum tree solution for singlesource looped water distribution networks subjected to a single loading pattern, Water Resour. Res., 29(7), 2437–2443, doi:10.1029/93WR00289. Storn, R., and K. Price (1995), Differential Evolution—A Simple and Efficient Adaptive Scheme for Global Optimization over Continuous Space, Technical Report, International Computer Science Institute, Berkeley, CA. Suribabu, C. R. (2010), Differential evolution algorithm for optimal design of water distribution networks, J. Hydroinf., 12 (1), 66–82. Suribabu, C. R., and T. R. Neelakantan (2006), Design of water distribution networks using particle swarm optimization, Urban Water J., 3(2), 111– 120, doi:10.1080/15730620600855928.
W08531
Tolson, B. A., M. Asadzadeh, H. R. Maier, and A. C. Zecchin (2009), Hybrid discrete dynamically dimensioned search (HD-DDS) algorithm for water distribution system design optimization, Water Resour. Res., 45, W12416, doi:10.1029/2008WR007673. Vasan, A., and S. P. Simonovic (2010), Optimization of water distribution network design using differential evolution, J. Water Resour. Plann. Manage., 136(2), 279–287, doi:10.1061/(ASCE)0733-9496(2010)136:2(279). Walski, T. M. (1984), Analysis of water distribution systems. Van Nostrand, Reinhold Co., Inc., New York, pp. 284–296. Walters, G. A., and T. K. Lohbeck (1993), Optimal layout of tree networks using genetic algorithms, Eng. Optimization, 22, 27–48. Waters, G. A., and D. K. Smith (1995), Evolutionary design algorithm for optimal layout of tree networks, Eng. Optimization, 24, 261–281. Yang, S., P. W. F. Louie, and W. W.-G. Yeh (1996), Water distribution network reliability: Connectivity analysis, J. Infrastruct. Syst., 2(2), 54–64, doi:10.1061/(ASCE)1076-0342(1996)2:2(54). Zecchin, A. C., A. R. Simpson, and H. R. Maier (2006), Application of two ant colony optimization algorithms to water distribution system optimization, J. Math. Comput. Model., 44, 451–668, doi:10.1016/j.mcm.2006. 01.005. Zheng, F., A. R. Simpson, and A. C. Zecchin (2010), A method of assessing the performance of genetic algorithm optimization water distribution design, Proceedings of the 12th Water Distribution System Analysis Symposium, Tucson, Arizona.
A. R. Simpson, A. C. Zecchin, and F. Zheng, School of Civil, Environmental and Mining Engineering, Engineering North N136, North Terrace Campus, University of Adelaide, Adelaide, SA 5005, Australia. (fzheng@ civeng.adelaide.edu.au)
18 of 18