Food Research International 44 (2011) 693–702
Contents lists available at ScienceDirect
Food Research International j o u r n a l h o m e p a g e : w w w. e l s ev i e r. c o m / l o c a t e / f o o d r e s
A comparative study of different DNA barcoding markers for the identification of some members of Lamiacaea Fabrizio De Mattia, Ilaria Bruni, Andrea Galimberti, Francesca Cattaneo, Maurizio Casiraghi, Massimo Labra ⁎ Università degli Studi di Milano Bicocca, ZooPlantLab, Dipartimento di Biotecnologie e Bioscienze, Piazza della Scienza 2, 20126 Milano, Italy
a r t i c l e
i n f o
Article history: Received 29 September 2010 Accepted 8 December 2010 Keywords: Aromatic plant Food traceability DNA barcoding Lamiaceae Plastidial DNA markers
a b s t r a c t The objective of the present work is to evaluate the efficacy of a DNA barcoding approach as a tool for the recognition of commercial kitchen spices belonging to the Lamiaceae family that are usually sold as enhancers of food flavor. A total of 64 spices samples, encompassing six different genera (i.e. Mentha, Ocimum, Origanum, Salvia, Thymus and Rosmarinus) were processed with a classical DNA barcoding approach by amplifying and sequencing four candidate barcode regions (rpoB, rbcL, matK and trnH-psbA) with universal primers. Results suggest that the non-coding trnH-psbA intergenic spacer is the most suitable marker for molecular spices identification followed by matK, with interspecific genetic distance values ranging between about 0% to 7% and 0% to 5%, respectively. Both markers were almost invariably able to distinguish spices species from closest taxa with the exclusion of samples belonging to the genus Oregano. Moreover, in a context of food traceability the two markers are useful to identify commercial processed spice species (sold as dried plant material). We also evaluated the potential benefits of a multilocus barcode approach over a singlemarker and although the most suitable combination was the matK + trhH-psbA, the observed genetic distances values were very similar to the discriminatory performance of the trnH-psbA. Finally, this preliminary work provide clear evidences that the efficacy of a DNA barcoding approach to the recognition of commercial spices is biased by the occurrence of taxonomic criticisms as well as traces of hybridization events within the family Lamiaceae. For this reason, to better define a more practical and standardized DNA barcoding tool for spices traceability, the building of a dedicated aromatic plants database in which all species and cultivars are described (both morphologically and molecularly) is strongly required. © 2010 Elsevier Ltd. All rights reserved.
1. Introduction The Lamiaceae is a large family of about 6990 described species belonging to 264 genera (Gurcharan, 2004) and which is characterized by square stems, opposite or whorled leaves and zygomorphic flowers usually with 2-lipped corolla. Species belonging to this family are mainly herbs or shrubs of various sizes (rarely trees) and are cosmopolites with two main centers of biodiversity corresponding to the Mediterranean basin and central Asia. Due to the production of aromatic oils and secondary metabolites, some of these plants are commonly used as spices for cooking such as basil, marjoram, mint, oregano, rosemary, sage, savory and thyme. In this context, many members of the Lamiaceae are characterized by considerable commercial importance and have been previously investigated both at the species and cultivar levels in order to characterize their variability and properties (Labra et al., 2004; Novak, Lukas, Bolzer, Grausgruber-Gröger, & Degenhardt, 2008; Trindade, 2010). Systematic and phylogenetic studies on aromatic plants were usually based on morphological characters (Gurcharan, 2004). However, in the last decades, continuous advances in molecular biology ⁎ Corresponding author. E-mail address:
[email protected] (M. Labra). 0963-9969/$ – see front matter © 2010 Elsevier Ltd. All rights reserved. doi:10.1016/j.foodres.2010.12.032
(e.g. genetics) have offered a set of new tools useful for investigating the relationships among these taxa and to characterize the peculiar chemical composition of related cultivars (Gounaris, Skoula, Fournaraki, Drakakaki, & Makris, 2002; Labra et al., 2004). Discontinuous markers like RAPDs, AFLPs and hypervariable DNA regions (such as SSRs) are among the most frequently used molecular approaches for these studies (Labra et al., 2004; Trindade, 2010). However, despite their proved efficacy, these markers are not always able to distinguish among different species or cultivars (Azizi, Wagner, Honermeier, & Wolfgang, 2009; Trindade, 2010) and they are often not universally usable on a wide panel of taxa since they have been developed on specific genera or species (Novak et al., 2008; Segarra-Moragues & Gleiser, 2009). Recently, ‘DNA barcoding’, a new technique based on the analysis of short, standardized and universal DNA region/s (named ‘barcode sequence/s’), has been proposed as a universal tool for species identification (Hebert, Cywinska, Ball, & DeWaard, 2003; www. barcoding.si.edu). The basic idea of the discrimination system is simple: if the sequence variation of the DNA barcode among species is higher than within species, they can be successfully discriminated from one another. In practice, a DNA sequence from such a standardized DNA region can be generated from a small tissue sample and compared to a library of reference sequences belonging to described species (e.g.
694
F. De Mattia et al. / Food Research International 44 (2011) 693–702
individuals stored in institutional collections) providing a rapid and reproducible taxonomic recognition (Hebert et al., 2003; Wong & Hanner, 2008; Bruni et al., 2010). This method opens new perspectives for the identification of aromatic herbs which is useful not only to clarify taxonomic uncertainties within the family Lamiaceae (DNA taxonomy, Lefébure, Douady, Gouy, & Gibert, 2006), but also to investigate commercial aspects related to spices traceability from field to market. Within the food market, internationally approved specifications provided by the American Spice Trade Association (ASTA — http:// www.astaspice.org) and the European Spice Association (ESA — http://www.esa-spices.org/) define minimum quality thresholds for herbs and spices only by considering their phytochemical profile and the amount of their essential oil. However, herbs and spices tend to be grown by smallholders and it is difficult to monitor and control growers who might be inclined to use different herbs to increase the agricultural yield. For example, Mediterranean oregano has recently been adulterated with plants having leaves similar in color (i.e. silvery gray) and size of such as Rhus coriaria L., Cistus spp. (Marieschi, Torelli, Poli, Sacchetti, & Bruni, 2009). In this context, the definition of a universal identification system based on a standardized molecular approach would allow not only the characterization of the spices species starting from a small plant fragment, but also the traceability of commercial spices products sold in powder form. Indeed, these kinds of products, usually sold as enhancers for food flavor, could be accidentally or intentionally contaminated by other less-valuable plants species (Sasikumar, Syamkumar, Remya, & Zachariah, 2004; Dhanya & Sasikumar, 2010). In this context, the search for a suitable genomic region to perform a universal DNA barcoding approach on Lamiaceae family is an element of primary importance. The selected regions should be universally applicable to a large number of plant species, like the mitochondrial coxI (cytochrome c oxidase subunit 1) in metazoans (Hebert et al., 2003). Due to the inadequacy of this marker for plants, several alternative regions have been proposed, such as the plastidial rpoB, rpoC1, rbcL and matK genes. Moreover, intergenic plastidial spacers (trnH-psbA, atpF-atpH and psbK-psbI) and the nuclear internal transcribed spacers have also been proposed as efficient DNA barcode regions (Chase et al., 2005; Kress, Wurdack, Zimmer, Weigt, & Janzen, 2005; Fazekas et al., 2008). Recently, the CBOL Plant Working Group (www.barcoding.si.edu/ plant_working_group.html) proposed the combinations of matK with rbcL to increase the efficacy of the method in plant species identification, especially for critical groups (Hollingsworth, Forresta, et al., 2009). In spite of this useful proposal, both the identification and the combination of the most appropriate regions for plant DNA barcoding remain contentious (Le Clerc-Blain, Starr, Bull, & Saarela, 2009; Bruni et al., 2010; Chen et al., 2010). The objective of the current study is to evaluate the universal applicability of a DNA barcoding approach to reach a univocal identification of aromatic plant species starting from different plant portions and processed kitchen spices subjected to industrial modifications (e.g.: drying, shredding, and storage) that make them morphologically unrecognizable. In this study, we provide an evaluation of the performances of four candidate barcoding loci and different combinations of the same in the recognition of various Lamiaceae species and cultivars, analysing DNA extracted from different plant materials. In addition, closely related taxa were analysed to better define the discrimination power of the tested markers and combinations.
different commercial cultivars were considered for each species. Fresh samples were collected from greenhouse of Milan Botanical Garden (www.biodip.unimi.it/it/dipartimento/cascina.htm), Certify Seed and Garden Center Ingegnoli (www.ingegnoli.it/), Garden Center Biovivaio Gran Burrone (www.biovivaiogranburrone.com) and Garden Center Viridea (www.viridea.it/it/home.asp). Sampling details can be retrieved from Table 1. A dichotomous key (Pignatti, 1982) was used to verify the correctness of the taxonomic assignment for each collected sample. Samples were stored at −20 °C and following the protocol specified by the Biorepositories initiative (http://www.biorepositories.org) they were vouchered with the id name ‘MIB:zpl:’ followed by a progressive numeric code. This string identifies the Institutional collection locality where the samples are currently stored (University of Milano-Bicocca). In order to evaluate the efficacy of a multi-marker DNA barcoding approach in delimiting species boundaries (and even cultivars variability) among the most commercialized Lamiaceae, samples were divided into six taxonomical groups, according to their genus (see Table 1). Group I — This group consists of seven mint samples belonging to morphologically identified plants of congeneric species: Mentha spicata L., Mentha aquatica L. and their supposed hybrid Mentha piperita L. (see Table 1 for more details). Group II — This group includes three different morphologically identified basil species (Ocimum basilicum L., Ocimum gratissimum L. and Ocimum tenuiflorum L.) as well as several cultivars of O. basilicum L. The selected cultivars show small differences in their morphology and chemical composition (Labra et al., 2004) and are mostly used as culinary herbs or ornamental plants. Group III — This group encompasses two different origanum species: O. majorana L. and O. vulgare L. These are the most commonly commercialized origanum species. In addition, O. pseudodictamnius Sieber and O. heracleoticum L. were also considered (see Table 1 for more details). Group IV — This group is constituted by salvia species only, including some ornamental taxa such as Salvia rutilans L. and Salvia uliginosa L.; these species are not edible and for this reason it is very important to set up a molecular approach able to distinguish them from Salvia officinalis L., commonly used as fresh or dried spice for cooking (see Table 1 for more details). Group V — Consists of samples of thyme as cultivated plant (Thymus vulgaris L.) (see Table 1 for more details). Group VI — This group consists of three samples of Rosmarinus officinalis (i.e.: the most common cultivar “Arp”) collected from different plant collections (see Table 1 for more details). Moreover, a total of 21 additional samples of commercial processed spices (e.g. dry and/or crumbled leaves) were collected in order to verify the usefulness of DNA barcoding as a tool for spices traceability. In particular, at least three commercial spice samples were analysed for each one of the six groups. These samples were purchased from supermarkets and drugstores and only products clearly labelled with a commercial spice name (e.g. mint, basil, and oregano) were sampled while flavor enhancers with an unclear label or made of mixed spices were excluded. Further details can be retrieved from Table 1.
2. Materials and methods 2.2. DNA isolation and amplification 2.1. Plant sampling A panel of 43 samples representing 16 different species was selected to test for the performance of four different candidate genomic regions for DNA barcoding analyses (Table 1). In most cases,
Fresh young leaves (100 mg) belonging to the selected plants species of Lamiaceae included in the six groups (Table 1) were used for DNA analysis. In the case of commercial spices, a total of 20 mg of powder or shredded material was used for DNA extraction.
F. De Mattia et al. / Food Research International 44 (2011) 693–702
695
Table 1 List of analysed spices samples divided in different groups (Gr) according to their taxonomy and provenance. For each sample the voucher number (V.N.) the Reference Species name, the cultivar name or common name, for the commercial samples, are provided. The Accession Numbers corresponding of DNA sequences of the four analysed markers are also included. Fresh samples were collected (C) from greenhouse of Milan Botanical Garden (MBG), certify seed and garden center Ingegnoli (ING), garden center Biovivaio Grand Burrone (BGB) and garden center Viridea (VIR). Commercial samples were collected in four different European Commercial Companies and to ensure their anonymity each sample was marked with the following codes CP1, CP2, CP3 and CP4. Gr
V. N.
Reference species name
Cultivar name
Group I
MIB:Zpl:03291 MIB:Zpl:03292 MIB:Zpl:03780 MIB:Zpl:03781 MIB:Zpl:03782 MIB:Zpl:03783 MIB:Zpl:03784 MIB:Zpl:03301 MIB:Zpl:03306 MIB:Zpl:03785 MIB:Zpl:03288 MIB:Zpl:03289 MIB:Zpl:03786 MIB:Zpl:02997 MIB:Zpl:02998 MIB:Zpl:03299 MIB:Zpl:03787 MIB:Zpl:03788 MIB:Zpl:02884 MIB:Zpl:02885 MIB:Zpl:02886 MIB:Zpl:02887 MIB:Zpl:02888 MIB:Zpl:02889 MIB:Zpl:02890 MIB:Zpl:02996 MIB:Zpl:03290 MIB:Zpl:03789 MIB:Zpl:03790 MIB:Zpl:03791 MIB:Zpl:03293 MIB:Zpl:03294 MIB:Zpl:03792 MIB:Zpl:03793 MIB:Zpl:03794 MIB:Zpl:03795 MIB:Zpl:03796 MIB:Zpl:03797 MIB:Zpl:03300 MIB:Zpl:03798 MIB:Zpl:03302 MIB:Zpl:03799 MIB:Zpl:03302 MIB:Zpl:03800 MIB:Zpl:03801 MIB:Zpl:03297 MIB:Zpl:03802 MIB:Zpl:03803 MIB:Zpl:03804 MIB:Zpl:03304 MIB:Zpl:03305 MIB:Zpl:03306 MIB:Zpl:03307 MIB:Zpl:03308 MIB:Zpl:03309 MIB:Zpl:03298 MIB:Zpl:03305 MIB:Zpl:03810 MIB:Zpl:03295 MIB:Zpl:03296 MIB:Zpl:03811 MIB:Zpl:03812 MIB:Zpl:03303 MIB:Zpl:03813
Mentha piperita L. Mentha piperita L. Mentha piperita L. Mentha aquatica L. Mentha aquatica L. Mentha spicata L. Mentha spicata L. – – – Ocimum basilicum L. Ocimum basilicum L. Ocimum basilicum L. Ocimum gratissimum L. Ocimum tenuiflorum L. – – – Ocimum basilicum L. Ocimum basilicum L. Ocimum basilicum L. Ocimum basilicum L. Ocimum basilicum L. Ocimum basilicum L. Ocimum basilicum L. Ocimum basilicum L. Origanum majorana L. Origanum majorana L. Origanum majorana L. Origanum majorana L. Origanum vulgare L. Origanum vulgare L. Origanum vulgare L. Origanum vulgare L. Origanum vulgare L. Origanum pseudodictamnius Sieber Origanum heracleoticum L. – – – – – – Salvia officinalis L. Salvia officinalis L. Salvia officinalis L. Salvia rutilans Salvia sclarea Salvia uliginosa – – – Thymus vulgaris L. Thymus vulgaris L. Thymus vulgaris L.
Piperita Piperita Piperita Gigante – Crispa Maroccan – – – Italian classic Italian classic Italian classic Vana tulsi Krisha Tulsi – – – Mostruoso mammouth Green leaves Gecom Red leaves Verde a palla Italiano Napoletano Scernese Sweet Sweet Sweet Sweet Aureum Aureum Aureum Gigante Vulgaris – – – – – – – – Albiflora Albiflora Albiflora – – – – – – Vulgaris Vulgaris Vulgaris – – – Arp Arp Arp – – –
Group II
Group III
Group IV
Group V
Group VI
Rosmarinus officinalis L. Rosmarinus officinalis L. Rosmarinus officinalis L. – – –
DNA was isolated using the DNeasy Isolation and Purification kit (Qiagen, Milan, Italy) to obtain high-quality DNA, free of polysaccharides or other metabolites that might interfere with DNA amplification.
Common name
Mint Mint Mint
Basil Basil Basil
Marjoram Marjoram Marjoram Oregano Oregano Oregano
Sage Sage Sage
Thyme Thyme Thyme
Rosemary Rosemary Rosemary
C
Code
MBG VIR ING ING BGB BGB BGB CP2 CP3 CP4 MBG ING BGB MBG MBG CP2 CP3 CP4 ING ING ING ING ING ING ING ING BGB VIR MBG ING MBG VIR BGB ING ING BGB BGB CP1 CP2 CP4 CP1 CP2 CP3 MBG BGB VIR BGB BGB BGB CP2 CP1 CP3 MBG VIR ING CP1 CP2 CP4 MBG ING VIR CP1 CP4 CP3
MP1 MP2 MP3 MA1 MA2 MS1 MS2 MEC1 MEC2 MEC3 OB1 OB2 OB3 OG OT BC1 BC2 BC3 OBcv1 OBcv1 OBcv2 OBcv3 OBcv4 OBcv5 OBcv6 OBcv7 OM1 OM2 OM3 OM4 OV1 OV2 OV3 OV4 OV5 OP OH MAC1 MAC2 MAC3 OC1 OC2 OC3 SO1 SO2 SO3 SR SS SU SC1 SC2 SC3 TV1 TV2 TV3 TC1 TC2 TC3 RO1 RO2 RO3 RC1 RC2 RC3
Accession numbers matK
psbA-trnH
rpoB
rbcL
FR719055 FR719056 FR719057 FR719058 FR719059 FR719060 FR719061 FR719062 FR719063 – FR719064 FR719065 FR719066 FR719067 FR719068 FR719069 FR719070 FR719071 FR719072 FR719073 FR719074 FR719075 FR719076 FR719077 FR719078 FR719079 FR719080 FR719081 FR719082 FR719083 FR719084 FR719085 FR719086 FR719087 FR719088 FR719089 FR719090 FR719091 FR719092 FR719093 FR719094 FR719095 FR719096 FR719097 FR719098 FR719099 FR719100 FR719101 FR719102 FR719103 FR719104 FR719105 FR719106 FR719107 FR719108 FR719109 FR719110 FR719111 FR719112 FR719113 FR719114 FR719115 FR719116 FR719117
FR726096 FR726097 FR726098 FR726099 FR726100 FR726101 FR726102 FR726103 FR726104 FR726105 FR726106 FR726107 FR726108 FR726109 FR726110 FR726111 FR726112 FR726113 FR726114 FR726115 FR726116 FR726117 FR726118 FR726119 FR726120 FR726121 FR726122 FR726123 FR726124 FR726125 FR726129 FR726130 FR726131 FR726132 FR726133 FR726137 FR726138 FR726126 FR726127 FR726128 FR726134 FR726135 FR726136 FR726139 FR726140 FR726141 FR726142 FR726143 FR726144 FR726145 FR726146 FR726147 FR726148 FR726149 FR726150 FR726151 FR726152 FR726153 FR726154 FR726155 FR726156 FR726157 FR726158 FR726159
FR720471 FR720472 – – – FR720473 FR720474 FR720475 FR720476 FR720477 FR720478 FR720479 FR720480 FR720481 FR720482 FR720483 FR720484 FR720485 FR720486 FR720487 FR720488 FR720489 FR720490 FR720491 FR720492 FR720493 FR720494 FR720495 FR720496 – FR720497 FR720498 FR720499 – – FR720500 FR720501 FR720502 FR720503 FR720504 FR720505 FR720506 FR720507 FR720508 FR720509 FR720510 FR720511 FR720512 FR720513 FR720514 FR720515 FR720516 FR720517 FR720518 FR720519 FR720520 FR720521 FR720522 FR720523 FR720524 FR720525 FR720526 FR720527 FR720528
FR720529 FR720530 FR720531 FR720532 FR720533 FR720534 FR720535 FR720536 FR720537 FR720538 FR720539 FR720540 FR720541 FR720542 FR720543 FR720544 FR720545 FR720546 FR720547 FR720548 FR720549 FR720550 FR720551 FR720552 FR720553 FR720554 FR720555 FR720556 FR720557 FR720558 FR720559 FR720560 FR720561 FR720562 FR720563 FR720564 FR720565 FR720566 FR720567 FR720568 FR720569 FR720570 FR720571 FR720572 FR720573 FR720574 FR720575 FR720576 FR720577 FR720578 FR720579 FR720580 FR720581 FR720582 FR720583 FR720584 FR720585 FR720586 FR720587 FR720588 FR720589 FR720590 FR720591 FR720592
Purified DNA concentration of each sample was estimated both fluorometrically and by comparison of ethidium bromide-stained band intensities with λ DNA standard.
696
F. De Mattia et al. / Food Research International 44 (2011) 693–702
To assess the comparative performance of different DNA markers, each sample was analysed with four candidate DNA barcoding genomic regions. These included three coding (rbcL, rpoB and matK) and one non-coding (trnH-psbA intergenic spacer) plastidial DNA regions. A PCR amplification for each candidate marker was performed using puReTaq Ready-To-Go PCR beads (Amersham Bioscience, Italy) in a 25 μL reaction according to the manufacturer's instructions. PCR cycles consisted of an initial denaturation step for 7 min at 94 °C, followed by 35 cycles of denaturation (45 s at 94 °C), annealing (30 s at different temperature; see Table 2) and extension (1 min at 72 °C), and, hence, a final extension at 72 °C for 7 min. Details of primers used for amplification are provided in Table 2. The heavy DNA strands were bidirectionally sequenced using an ABI 155 3730XL automated sequencer at Macrogen Inc., Korea. Manual editing of raw traces and subsequent alignments of forward and reverse sequences allowed us to assign edited sequences for most species. The 3′ and 5′ terminals were clipped to generate consensus sequences for each taxon.
distance matrices were generated for each locus and for each taxonomic group (as listed in Table 1) using as a reference only those samples identified by morphology during sampling collection therefore excluding commercial processed spices samples. Intra and interspecific comparisons were calculated in an attempt to define the levels of molecular variability within each group. Finally, the same approach was conducted using differential combinations of the markers considered. To give a schematic view of the relationships among the reference species considered and to track the correctness of the taxonomic assignment of commercial spices samples, a phenetic tree was generated for the most variable markers. Each tree has been obtained using MEGA 4.0 — options=tree inference method: neighbor-joining; phylogeny test and options: bootstrap (500 replicates); gaps/missing data: pairwise deletion; codon positions: 1st+2nd+3rd+non-coding; substitution model: K2P; substitutions to include: transitions+transversions; pattern among lineages: same (homogeneous); rates among sites: uniform rates. 3. Results
2.3. Data analysis
3.1. Amplification and sequencing success
The first step of the work was to provide evidence for the universality of the four DNA candidate markers. For this reason we evaluated which were the DNA markers routinely amplified and sequenced in the highest number of analysed samples, including commercial spices (powder or chopped leaves). To facilitate the interpretation of successes and failures in the amplification and sequencing of the candidate DNA regions, only the most universal primer combinations for each candidate DNA marker were tested (Table 2). For all taxa and loci, we conducted PCR amplification in a two-stage trial. In the first stage, we used the standard PCR conditions described above, starting from 10 ng of DNA template. The second stage was performed only on those samples that did not generate any amplicons or that produced multiple and/or aspecific PCR products. The samples that failed to amplify were repeatedly amplified at lower stringency conditions: with a reduction of 5 °C in the annealing temperature (as described in Table 2) and using 40 PCR cycles. In case of a new failure, PCR products belonging to both stages were reamplified using 1 and 20 ng of DNA template. Only in cases of negative amplification with all conditions the PCR reaction was considered a failure and the related samples were removed from the dataset. According to the guidelines provided by the Consortium for the Barcoding of Life (http://www.barcoding.si.edu/protocols.html), the evaluation of comparative levels of variability and discrimination power for the four markers were undertaken using MEGA 4.0 (Tamura, Dudley, Nei, & Kumar, 2007). In particular Kimura 2-parameter (K2P)
Table 2 Primer and PCR annealing temperatures used in the present study for the four selected DNA barcoding markers. Locus
Primer name
Sequences (5′–3′)
Annealing Ref. temperature
matK
matK 390
CGATCTATTCATTCAATATTC
48 °C
Cuènoud et al., 2002
matK 1326 TCTAGCACACGAAAGTCGAAGT
3.2. Discrimination performances of the four candidate DNA loci
trnHpsbA psbA trnH
GTTATGCATGAACGTAATGCTC 53 °C CGCGCATGGTGGATTCACAATCC
rpoB
AAGTGCATTGTTGGAACTGG GATCCCAGCATCACAATTCC ATGTCACCACAAACAGAAAC TCGCATGTACCTGCAGTAGC
rbcL
rpoB 1F rpoB 4R rbcL 1F rbcL 724R
A total of 64 spices samples (Table 1) were used for DNA extraction. High DNA quality and good yield (from 30 to 50 ng/μl) were obtained from all the analysed samples, with the exclusion of some processed commercial mint (MEC1 and MEC3) and basil (BC1) samples. In these cases, electrophoretic analysis showed partially degraded DNA in the 100–1000 bp range and low yield of DNA extraction (about 20 ng/μl), (data not shown). Results of our tests among the six selected groups showed good amplification success. All the analysed loci exhibited high PCR success with standard primers reaching a success rate near to 100%. Few cases of failed PCR amplifications occurred only in the Group I. One of these cases is related to the commercial mint (MEC3): despite the amplification with matK primers was repeated three times, starting from different DNA concentrations (1, 10 and 20 ng) and at low stringency conditions (see Material and methods), the results were negative in all cases. The same situation occurred for Mentha acquatica L. samples amplified with the rpoB primers. All the PCR products corresponding to the four DNA markers were successfully sequenced and high quality bidirectional sequences were obtained. Some sequencing problems were encountered with the trnH-psbA for some Basil cultivar samples (i.e. OBcv2, OBcv4; OBcv7, Table 1), in part attributable to a high frequency of mononucleotide repeats that disrupt individual sequencing reads. This problematic was solved with a strong and careful manual editing of the obtained sequences. The same sequence length was observed in all the analysed group for matK (810 bp), rbcL (551 bp) and rpoB (491 bp), while substantial differences were observed in the trnH-psbA alignment length among the different groups as well as within each group. In particular, for this barcode region, sequence length ranged from 348 to 421 bp (data not shown). The accession numbers of the obtained sequences are listed in Table 1.
55 °C 48 °C
Newmaster & Ragupathy, 2009 Fazekas et al., 2008 Fay, Bayer, Alverson, de Bruijn, & Chase, 1998
In order to identify the best DNA barcode markers for spices identification and traceability, the values of genetic divergence for all the four tested loci were computed in each analysed group at different taxonomic levels (intra and interspecific comparisons) and by considering only fresh-morphologically identified samples (Table 3). In addition a phenetic tree showing the relationship among analysed samples was generated for the most efficient tested markers (Fig. 1a–c).
F. De Mattia et al. / Food Research International 44 (2011) 693–702
697
Table 3 Comparative performances and variability of different DNA barcoding markers. For each groups (G), the average K2P distance (transformed into percent), the standard error (S.E.) and the range of K2P variation are given for each tested marker and for three different markers combinations. For each group, the number of species (N) and the Mean Number (MN) of Barcode sequences per species with Standard Deviation (ND = Not Determinable). Both the intraspecific and the interspecific (when two or more species are available) comparisons for each group are considered. Single marker matK
Marker combination trnH-psbA
rpoB
rbcL
matK + trnH-psbA
matK + rbcL
trnH-psbA + rbcL
G N MN (S.E.)
range % range % Mean % Comparison Mean % variation variation (S.E.%) (S.E.%)
range % range % Mean % range % Mean % range % Mean % range % Mean % Mean % variation variation variation variation variation (S.E.%) (S.E.%) (S.E.%) (S.E.%) (S.E.%)
1
Between sp. 0.72 (0.60) Within sp. 0.03 (0.05) Between sp. 1.76 (0.40) Within sp. 1.05 (0) Between sp. 0 (0)
0.30– 3.33 0–0.34
0 (0)
–
0 (0)
–
1.26– 2.09 – –
2.12– 3.51 – 0–1.37
0 (0)
–
0 (0) 0 (0)
– –
Within sp.
–
0.98– 1.76 1.03– 7.05 – –
0 (0)
–
1.03 (0.43) 0 (0) –
0.41– 1.65 – –
0.04 (0.03) 0.04 (0.07) 0.48 (0.20) 0 (0) 0.05 (0.03) 0.10 (0.01) 1.54 (0.85) 0 (0) –
3
2.3 (0.6)
2
3
4.3 (5.8)
3
4
2.8 (2.1)
4
4
1.5(1)
5
1
3 (ND)
6
1
3 (ND)
Between sp. 3.39 (1.70) Within sp. 0 (0) Between sp. –
0.74– 4.86 – –
2.31 (1.70) 0.20 (0.18) 2.75 (0.70) 0.72 (0) 1.05 (0.53) 1.37 (0.55) 4.90 (2.47) 0 (0) –
Within sp. 0 (0) Between sp. –
– –
0 (0) –
– –
0 (0) –
– –
0 (0) –
– –
0 (0) –
Within sp.
–
0 (0)
–
0 (0)
–
0 (0)
–
0 (0)
0 (0)
0 (0)
0.08– 1.08 0–0.08
In general, the trnH-psbA ranked first in divergence values among species, followed by matK (Table 3). On the contrary, rpoB sequences showed the lower sequence divergence and for this reason the phenetic tree related to this marker was not generated. In the first group (Group I), all the tested markers showed the same sequences for M. piperita L. and commercial mint samples. Moreover, only trnH-psbA and matK revealed differences among the three species considered: M. piperita–M. aquatica mean K2P distance 3.33% (s.e. 0.91%) for trnH-psbA and 1.08% (s.e. 0.32%) for matK and M. spicata–M. aquatica mean K2P distance 3.29% (s.e. 0.92%) for trnH-psbA and 1.0% (s.e. 0.32%) for matK (data not shown). A negligible genetic diversity was revealed between M spicata and M. piperita, and was based on 6 single base mutations for trnH-psba and only one for matK (Fig. 1a and b). Analyses carried out on samples belonging to Group II showed that the sequence divergences of marker trnH-psbA, matK and rbcL clearly distinguish O. gratissimum L., and O. tenuiflorum L. from common basil (O. basilicum L.) with the following mean K2P distance values: O. gratissimum–O. basilicum 2.61% (s.e. 0.76%) for trnH-psbA, 1.92% (s.e. 0.43%) for matK and 0.73% (s.e. 0.35%) for rbcL; O. tenuiflorum–O. basilicum (OB1) 3.51% (s.e. 0.88%) for trnH-psbA, 2.09% (s.e. 0.45%) for matK and 0.36% (s.e. 0.25%) for rbcL. Only the sequences of the first two markers (trnH-psbA and matK) showed appreciable differences among the analysed basil cultivars (Fig. 1) with mean K2P distance values of 0.82% (s.e. 0.5%) for trnH-psbA and 1.21% (s.e. 0.6%) for matK. In both cases the observed differences were attributable to SNP — Single Nucleotide Polymorphisms (10 and 27 SNP for trnH-psbA and matK, respectively). Analyses carried out with matK and rpoB on Origanum samples (Group III) did not show any sequence polymorphism (Table 3). Only two single nucleotide polymorphisms in the rbcL region were detected between the three commercial oregano and the other analysed samples. Sequences of trnH-psbA marker showed several genetic differences among samples and surprisingly, the intraspecific genetic diversity was higher than the interspecific one, both for trnH-psbA and rbcL (Table 3 and Fig. 1a and c). Finally, a clear distinction between commercial oregano and the morphologically
0–0.06
0.09– 0.11 0.36– 2.41 – –
2.31 (1.74) 0.20 (0.18) 2.07 (0.50) 0.95 (0) 0.35 (0.18) 0.46 (0.18) 3.88 (1.94) 0 (0) –
0–0.12 0.36– 0.73 – 0–0.08
0.3– 3.33 0–0.34
2.63 (1.32) 0 (0) –
0.59– 3.55 – –
0.97 (0.70) 0.11 (0.11) 1.40 (0.29) 0.30 (0) 0.47 (0.24) 0.64 (0.24) 2.91 (1.45) 0 (0) –
– –
0 (0) –
– –
0 (0) –
– –
–
0 (0)
–
0 (0)
–
1.54– 2.54 – 0–0.46 0.33– 0.59 0.84– 5.40 – –
0.44 (0.33) 0.03 (0.06) 1.23 (0.30) 0.62 (0) 0.02 (0.01) 0.04 (0)
0.07– 0.67 0–0.1 0.89– 1.43 – 0–0.03 –
0.16– 1.40 0–0.21 1.08– 1.63 – 0–0.63 0.47– 0.81 0.64– 4.01 – –
identified Origanum samples used as reference samples was observed for this marker (10.8%; SE 1.78%). The analyses performed on Group IV clearly show the identity between S. officinalis L. and commercial sage samples for all the tested markers. Moreover, all DNA markers clearly distinguished these from the other tested samples, belonging to the genus Salvia. Analyses performed on samples of Group V and Group VI suggested that all the commercial spices share the same genetic constitution of original spontaneous plants (Thymus vulgaris L. and Rosmarinus officinalis L); however, only matK and trnH-psbA were able to clearly distinguish these groups from the other tested spices (Fig. 1). To evaluate potential benefits of multilocus barcodes over a singlemarker we examined multiple combinations of the three plastidial markers that showed appreciable genetic diversity levels in the previous analyses: trnH-psbA, matK and rbcL. Comparative K2P variability results for the tested combinations are provided in Table 3. The most suitable combination was the matK + trhH-psbA; however, the observed K2P distance values were very similar to the performance of the best single locus (trnH-psbA) for all of the analysed groups.
4. Discussion 4.1. Detection of the best DNA barcoding marker to spices identification The globalization of the food trade requires the development of integrated approaches, such as traceability of origin, quality and authenticity of commercialized products, to ensure food safety (Dalvit, De Marchi, Targhetta, Gervaso, & Cassandro, 2008; Barbuto et al., 2010). The main goal of this work was to define a system for the traceability of commercial spices using a ‘DNA barcoding’ approach. A first result of our work is that in almost all the cases considered, the industrial processes that have been conducted on the commercial spices samples collected (e.g. crumbling, drying) do not affect the success rate of DNA extraction, amplification and sequencing therefore allowing the analysis through a DNA barcoding approach.
698
F. De Mattia et al. / Food Research International 44 (2011) 693–702
Since an ideal DNA barcode should be applied to a large number of species with standard PCR conditions (Hebert et al., 2003; Chase et al., 2007), our work showed that all the tested markers generated
positive results among the analysed groups with a single step of PCR conditions. This is an impressive performance if the wide range of genera encompassed by our analyses is considered. However, the
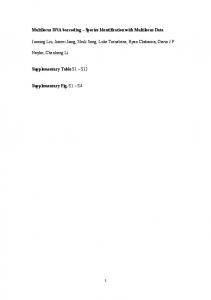
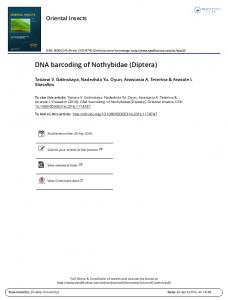
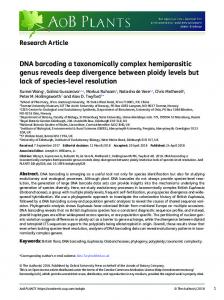
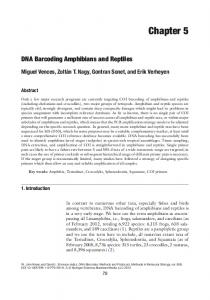
Fig. 1. Neighbor-joining reconstructions obtained with MEGA 4.0 for three out of the four molecular datasets produced in this study. Each tree encompasses all the samples analysed for the six taxonomical group considered: a) trnH-psbA, b) matK, c) rbcL. Bootstrap values lower than 70% not showed. Details on samples, species, cultivar, provenance and accession numbers for each marker can be retrieved from Table 1. Each taxonomic group has been shown on the tree with squared brackets.
F. De Mattia et al. / Food Research International 44 (2011) 693–702
Fig. 1 (continued).
699
700
F. De Mattia et al. / Food Research International 44 (2011) 693–702
trade-off in the universality of the rpoB is its relatively low discrimination power at the species level as showed in all the analysed group. For this reason, we considered this marker unsuitable for the aromatic plants identification. Similar data were observed for rbcL that showed low discrimination values at cultivars level (i.e. Group II) as well as among different spices taxonomic groups (Fig. 1). Similar results were obtained in previous investigations (Fazekas et al., 2008; Hollingsworth, Clark, et al., 2009) carried out on large plant datasets in which this marker showed a low mutation rate and discrimination values. The non-coding trnH-psbA intergenic spacer is the most viable candidate in all six analysed groups. In particular, the presence of highly conserved PCR priming sites combined with a non-coding region that exhibits high numbers of substitutions, make the trnH-psbA spacer highly suitable as a plant barcode. Previous researches suggested that during the alignment of sequences of this intergenic spacer, several problems can occur, especially in monocots (Chase et al., 2007) and conifers (Hollingsworth, Clark, et al., 2009). Some difficulties in obtaining bidirectional sequences of good quality were also encountered in our dataset in the case of some basil samples. However, we consider this technical problem easily solvable with the use of appropriate polymerases as suggested by Fazekas, Steeves, and Newmaster (2010a). Based on the patterns of genetic diversity detected in the tested spices groups and given the comparative performances of the analysed markers (Fig. 1), we concur with Kress and Erickson (2007) that trnH-psbA is the most suitable marker for DNA barcoding of plants. Concerning non-coding sequences, also the internal transcribed spacer (ITS) region of the nuclear ribosomal cistron (18S–5.8S–26S) could be a good candidate for plant DNA barcoding; however, this marker shows divergent paralogues that require cloning of multiple copies, and secondary structure problems resulting in poor-quality sequence data (Kress et al., 2005; Bruni et al., 2010). The matK gene showed easy amplification and alignment in the analysed taxa, however a good level of discrimination based on this marker was observed only in some spices groups (Group II and Group IV, see Table 3). Although, CBOL Plant Working Group (www.barcoding. si.edu/plant_working_group.html) identified this gene as one of the universal DNA barcode for flower plants, our analysis suggests that matK is not the best DNA barcode for spices identification. The key foundation step in the context of plant DNA barcoding is to reach an international agreement on the definition of a standardized set of loci showing sufficient levels of variability to enable large-scale sequencing and the development of a global plant barcoding database. The CBOL suggests the use of the plastidial matK as a standard barcode combined with another coding gene such as rbcL (Hollingsworth, Forresta, et al., 2009). Although our results clearly showed that a multilocus barcoding approach does not increase the species discrimination rate, according to the CBOL, we suggest the combination of the matK gene with another marker, but we propose the trnH-psbA spacer instead of rbcL. This non-coding region, initially excluded by CBOL due to the problems in obtaining high quality bidirectional sequences, offers resolution values in Lamiaceae species identification that are higher than the other tested makers (Fig. 1). In addition recent improvements in DNA amplification largely reduced the occurrence of sequence quality problems caused by the presence of mononucleotide repeats (Fazekas, Steeves, Newmaster, & Hollingsworth, 2010b). 4.2. Spices traceability from field to table The food traceability process has been indicated as a production action to improve reliability of labelling, to certify the origin and quality of products on the market, and to prevent fraudulent or deceptive labelling (European Commission, 2002). Our tests carried out on six groups of Lamiaceae largely used as spices for cooking showed that in some cases spices are characterized by consistent traceability problems. In the case of mint group (Group I), trnH-psbA
and matk markers clearly distinguish M. aquatica L. from the other two Mentha species; however, trnH-psbA and matK sequences showed low genetic differences and complete genetic identity between M. piperita L. and M. spicata L. We emphasize that the genus Mentha is characterized by a large number of species and hybrids (Gobert, Moja, Colson, & Taberlet, 2002) and that peppermint (M. piperita L.) is a sterile hybrid of M. aquatica L. × M. spicata L. (Tucker, 1992). The chloroplast uniparental markers used in this study, confirm that M. spicata L. is the maternal parental of M. piperita L. because both species showed the same plastidial DNA profile. However, to confirm definitively the hybrid origin of M. piperita L. and identify both parental species, co-dominant markers should be considered (Bruni et al., 2010; Trindade, 2010). Natural interspecific hybridization occurs with high frequency in section Mentha, both in wild populations and in cultivation. Most commercial hybrids are sterile or subfertile, but vegetative propagation enables them to persist. Complex hybrid populations may arise, and if they are subfertile, they may cross with parental or nonparental species. This situation leads to large genetic diversity and to several taxonomic problems, further complicated by polyploidy and vegetative propagation phenomena. These events may have generated the genetic differences detected by trnH-psbA among different analysed mints (Fig. 1a). Based on these data we can therefore conclude that the DNA barcoding approach cannot be considered as a good traceability tool for mint group, because it is not able to distinguish different hybrids and these from their parents. It should be considered that this is not a problem of DNA barcoding only, but a clear limitation of all the molecular approaches based on plastidial markers in plant kingdom (Bruni et al., 2010). A similar situation was observed for the Origanum L. (Group III). This genus contains two important spices commonly used as spices for cooking with different secondary metabolite content: marjoram and oregano. The aromatic quality of marjoram is generally found in one species in the section Majorana only (O. majorana L.). In contrast to marjoram, the quality of oregano arises from many different species, subspecies, varieties, and hybrids that can be distinguished individually, although extensive variation still exists. However, the best qualities of oregano come from different subspecies of O. vulgaris, O. onites and O. syriacum (Baser, Azek, Tümen, & Sezik, 1993; Azizi et al., 2009). Our molecular data, obtained using trnH-psbA marker, confirm these considerations: a moderate genetic variability was detected among the marjoram samples while large genetic differences were observed among O. vulgaris accessions and related species. We conclude that the DNA barcoding approach is not suitable for Origanum traceability because this genus seems to show a large genetic promiscuity. In particular, commercial accession often derive from hybridization events between different species (Gounaris et al., 2002) thus the intraspecific genetic diversity could be higher than the interspecific one. The situation is different in the case of basil: both trnH-psbA and matK clearly distinguish the Ocimum basilicum L. from the other two species, as well as different analysed cultivars (Fig. 1). The genus Ocimum L., comprises 30–160 annual and perennial herbs and shrubs (Paton, Harley, & Harley, 1999) with a lot of these deriving from hybridization events; moreover, several species are commercial cultivars. Among the genus, O. basilicum L. is the most economically important species consisting of a large number of cultivars with different genetic constitution as detected by discontinuous markers such as AFLP — Amplified Fragments Length Polymorphism — (Labra et al., 2004; Carovic-Stanko et al., 2010). Our analyses confirmed these data by using universal DNA barcoding tools; considering that the analysed basil cultivars showed private DNA barcoding profiles, we can conclude the DNA barcoding is a suitable tool for tracking the basil from the field to the consumer's table. In the case of sage, thyme and rosemary (Groups IV, V and VI), the commercial spices showed the same DNA barcoding profiles of the
F. De Mattia et al. / Food Research International 44 (2011) 693–702
related original plant species. In this preliminary work, for rosemary and thyme, congeneric species or cultivars were not analysed, while in the case of sage clear genetic differences were observed between S. officinalis — commercial sage and the other Salvia species for all the tested markers. These data suggest that a DNA barcoding approach can univocally identify edible sage from the other ornamental species which in some cases can be toxic for humans (Vohra, Seefeld, Cantrell, & Clark, 2009). 5. Conclusion In conclusion, the European Union has considered the use of highquality raw material in food production as a prerequisite to obtain a genuine and safe product of adequate nutritional value (Commission of the European Communities, 2000). Consequently molecular traceability is assuming a particular relevance in the global process of food production and marketing (Dalvit et al., 2008; Costa, Mafra, Amaral, & Oliveira, 2010). We consider DNA barcoding as a promising tool in providing a practical and standardized identification of aromatic plants (useful also for their traceability). The next step in this research would be the establishment of a dedicated aromatic plant DNA barcoding database in which all species and cultivars are described under the morphological and molecular approaches (based on trnH-psbA alone or in combination with matK). Based on this large database it will be possible to better evaluate the discrimination power of different DNA barcoding markers and the support of proper bioinformatic tools (Casiraghi, Labra, Ferri, Galimberti, & De Mattia, 2010) will lead to the development of an innovative tool suitable for rapid spices identification during the industrial production process. Acknowledgements This work was supported by Fondazione Cariplo with the project entitled “Dai geni all'ecosistema: il DNA barcoding come supporto innovativo per la protezione della biodiversità e l'analisi della funzionalità delle reti ecologiche” and by PRIN-MIUR project entitled “Tassonomia integrata per lo studio della biodiversità vegetale: DNA barcoding e analisi morfologiche”. References Azizi, A., Wagner, C., Honermeier, B., & Wolfgang, F. (2009). Intraspecific diversity and relationship between subspecies of Origanum vulgare revealed by comparative AFLP and SAMPL marker analysis. Plant Systematics and Evolution, 281, 151−160. Barbuto, M., Galimberti, A., Ferri, E., Labra, M., Malandra, R., Galli, P., et al. (2010). DNA barcoding reveals fraudulent substitutions in shark seafood products: The Italian case of “palombo” (Mustelus spp.). Food Research International, 43, 376−381. Baser, K. H. C., Azek, T., Tümen, G., & Sezik, E. (1993). Composition of the essential oils of Turkish Origanum species with commercial importance. Journal of Essential Oil Research, 5, 619−623. Bruni, I., De Mattia, F., Galimberti, A., Galasso, G., Banfi, E., Casiraghi, M., et al. (2010). Identification of poisonous plants by DNA barcoding approach. International Journal of Legal Medicine, doi:10.1007/s00414-010-0447-3. Carovic-Stanko, K., Liber, Z., Besendorfer, V., Javornik, B., Bohanec, B., Kolak, I., et al. (2010). Genetic relations among basil taxa (Ocimum L.) based on molecular markers, nuclear DNA content, and chromosome number. Plant Systematics and Evolution, 285, 13−22. Casiraghi, M., Labra, M., Ferri, E., Galimberti, A., & De Mattia, F. (2007). DNA barcoding: A six-question tour to improve users' awareness about the method. Briefings in Bioinformatics, 11, 440−453. Chase, M. W., Cowan, R. S., Hollingsworth, P. M., van den Berg, C., Madriñán, S., Petersen, G., et al. (2007). A proposal for a standardized protocol to barcode all land plants. Taxon, 56, 295−299. Chase, M. W., Salamin, N., Wilkinson, M., Dunwell, J. M., Kesanakurthi, R. P., Haidar, N., et al. (2005). Land plants and DNA barcodes: Short-term and long-term goals. Philosophical Transactions of the Royal Society B: Biological Sciences, 360, 1889−1895. Chen, S., Yao, H., Han, J., Liu, C., Song, J., Shi, L., et al. (2010). Validation of the ITS2 Region as a novel DNA Barcode for identifying medicinal plant species. PLoS ONE, 5, e8613. Commission of the European Communities (2000). White paper on food safety COM (1999) 719 final. Belgium: Bruxelles. Costa, J., Mafra, I., Amaral, I. S., & Oliveira, M. B. P. P. (2010). Monitoring genetically modified soybean along the industrial soybean oil extraction and refining processes
701
by polymerase chain reaction techniques. Food Research International, 43, 301−306. Cuènoud, P., Savolainen, V., Chatrou, L. W., Powell, M., Grayer, R. J., & Chase, M. W. (2002). Molecular phylogenetics of Caryophyllales based on nuclear 18 S rDNA and plastid rbcL, atpB and matK DNA sequences. American Journal of Botany, 89, 132−144. Dalvit, C., De Marchi, M., Targhetta, C., Gervaso, M., & Cassandro, M. (2008). Genetic traceability of meat using microsatellite markers. Food Research International, 41, 301−307. Dhanya, K., & Sasikumar, B. (2010). Molecular marker based adulteration detection in traded food and agricultural commodities of plant origin with special reference to spices. Current Trends in Biotechnology and Pharmacy, 4, 454−489. European Commission (2002). Regulation (EC) No. 178/2002 of the European Parliament and of the Council of 28 January 2002 laying down the general principles and requirements of food law, establishing the European Food Safety Authority and laying down procedures in matters of food safety. Official Journal of the European Communities, L31, 1−24. Fay, M. F., Bayer, C., Alverson, W. S., de Bruijn, A. Y., & Chase, M. W. (1998). Plastid rbcL sequence data indicate a close affinity between Diegodendron and Bixa. Taxon, 47, 43−50. Fazekas, A. J., Burgess, K. S., Kesanakurti, P. R., Graham, S. W., Newmaster, S. G., Husband, B. C., et al. (2008). Multiple multilocus DNA barcodes from the plastid genome discriminate plant species equally well. PLoS ONE, 3, e2802. Fazekas, A. J., Steeves, R., & Newmaster, S. G. (2010a). Improving sequencing quality from PCR products containing long mononucleotide repeats. Biotechniques, 48, 277−285. Fazekas, A. J., Steeves, R., Newmaster, S. G., & Hollingsworth, P. M. (2010b). Stopping the stutter: Improvements in sequence quality from regions with mononucleotide repeats can increase the usefulness of non-coding regions for DNA barcoding. Taxon, 59, 694−697. Gobert, V., Moja, S., Colson, M., & Taberlet, P. (2002). Hybridization in the section Mentha (Lamiaceae) inferred from AFLP markers. American Journal of Botany, 89, 2017−2023. Gounaris, Y., Skoula, M., Fournaraki, C., Drakakaki, G., & Makris, A. (2002). Comparison of essential oils and genetic relationship of Origanum x intercedens to its parental taxa in the island of Crete. Biochemical Systematics and Ecology, 30, 249−258. Gurcharan, S. S. (2004). Plant systematics: An integrated approach. Enfield, NH: Science Publishers. Hebert, P. D. N., Cywinska, A., Ball, S. L., & DeWaard, J. R. (2003). Biological identification through DNA barcodes. Proceedings of the Royal Society of London. Series B, 270, 313−321. Hollingsworth, M. L., Clark, A., Forrest, L. L., Richardson, J. E., Pennington, R. T., Long, D., et al. (2009). Selecting barcoding loci for plants: Evaluation of seven candidate loci with species level sampling in three divergent groups of land plants. Molecular Ecology Resources, 9, 439−457. Hollingsworth, P. M., Forresta, L. L., Spougeb, J. L., Ratnasingham, M. H. S., van der Bank, M., Chase, M. W., et al. (2009). A DNA barcode for land plants. Proceedings of the National Academy of Sciences of the United States of America, 106, 12794−12797. Kress, W. J., & Erickson, D. L. (2007). A two-locus global DNA barcode for land plants: The coding rbcL gene complements the non-coding trnH-psbA spacer region. PLoS ONE, 2, e508. Kress, W. J., Wurdack, K. J., Zimmer, E. A., Weigt, L. A., & Janzen, D. H. (2005). Use of DNA barcodes to identify flowering plants. Proceedings of the National Academy of Sciences of the United States of America, 102, 8369−8374. Labra, M., Miele, M., Ledda, B., Grassi, F., Mazzei, M., & Sala, F. (2004). Morphological characterization, essential oil composition and DNA genotyping of Ocimum basilicum L. cultivars. Plant Science, 167, 725−731. Le Clerc-Blain, J. R., Starr, J., Bull, R. D., & Saarela, J. M. (2009). A regional approach to plant DNA barcoding provides high species resolution of sedges (Carex and Kobresia, Cyperaceae) in the Canadian Arctic Archipelago. Molecular Ecology Resources, 10, 69−91. Lefébure, T., Douady, C. J., Gouy, M., & Gibert, J. (2006). Relationship between morphological taxonomy and molecular divergence within Crustacea: Proposal of a molecular threshold to help species delimitation. Molecular Phylogenetics and Evolution, 40, 435−447. Marieschi, M., Torelli, A., Poli, F., Sacchetti, G., & Bruni, R. (2009). RAPD-based method for the quality control of Mediterranean Oregano and its contribution to pharmacognostic techniques. Journal of Agricultural and Food Chemistry, 57, 1835−1840. Newmaster, S. G., & Ragupathy, S. (2009). Testing plant barcoding in a sister species complex of pantropical Acacia (Mimosoideae, Fabaceae). Molecular Ecology Resources, 9, 172−180. Novak, J., Lukas, B., Bolzer, K., Grausgruber-Gröger, S., & Degenhardt, J. (2008). Identification and characterization of simple sequence repeat markers from a glandular Origanum vulgare expressed sequence tag. Molecular Ecology Notes, 8, 599−601. Paton, A., Harley, M. R., & Harley, M. M. (1999). Ocimum: An overview of classification and relationships. In R. Hiltunen, & Y. Holm (Eds.), Basil: The genus Ocimum (pp. 1−38). Amsterdam: Harwood. Pignatti, S. (1982). Flora d'Italia. Italy: Bologna Ed. Agricole. Sasikumar, B., Syamkumar, S., Remya, R., & Zachariah, T. J. (2004). PCR based detection of adulteration in the market samples of turmeric powder. Food Biotechnology, 18, 299−306. Segarra-Moragues, J. G., & Gleiser, G. (2009). Isolation and characterisation of di and tri nucleotide microsatellite loci in Rosmarinus officinalis (Lamiaceae), using enriched genomic libraries. Conservation Genetics, 10, 571−575.
702
F. De Mattia et al. / Food Research International 44 (2011) 693–702
Tamura, K., Dudley, J., Nei, M., & Kumar, S. (2007). MEGA 4: Molecular evolutionary Genetics Analysis (MEGA) software version 4.0. Molecular Biology and Evolution, 24, 1596−1599. Trindade, H. (2007). Molecular biology of aromatic plants and spices. Flavour and Fragrance Journal, 25, 272−281. Tucker, A. O. (1992). The truth about mints. Herb Companion, 4, 51−52.
Vohra, R., Seefeld, A., Cantrell, F. L., & Clark, R. F. (2009). Salvia divinorum: Exposures reported to a statewide poison control system over 10 years. The Journal of Emergency Medicine, doi:10.1016/j.jemermed.2009.05.019. Wong, E. H. K., & Hanner, R. H. (2008). DNA barcoding detects market substitution in North American seafood. Food Research International, 41, 828−837.