A Comparative Study on Memory Allocators in Multicore and Multithreaded Applications Rivalino Matias Taís Borges Autran Macêdo Lúcio Borges School of Computer Science & School of Mathematics Federal University of Uberlândia Uberlândia MG, Brazil
2011 IEEE International Conference on Systems, Man, and Cybernetics
Oct 2011, Anchorage AK, US
1/X
AGENDA • Introduction • User-level Memory Allocators
• Experimental Study • Result Analysis • Final Remarks
2011 IEEE International Conference on Systems, Man, and Cybernetics
Oct 2011, Anchorage AK, US
2/X
Introduction • Memory allocations are one of the most ubiquitous operations in computer programs. – sophisticated real-world applications need to allocate/ deallocate memory many times during their lifetime. – thus the performance of memory mgmt routines is very important, but it is frequently neglected in software design.
• A memory allocator is the code responsible for implementing the memory mgmt routines.
2011 IEEE International Conference on Systems, Man, and Cybernetics
Oct 2011, Anchorage AK, US
3/X
Introduction
Memory Allocators • A memory allocator manages the heap of application processes
• The heap is the region of the process address space used to meet requests for dynamic memory allocations (malloc, new, …). stack
unmapped address space heap bss data
data segment
text
• Therefore, understanding how memory allocators work is very important to improve software performance
2011 IEEE International Conference on Systems, Man, and Cybernetics
Oct 2011, Anchorage AK, US
4/X
Introduction
Memory Allocators (cont’d) • There are two classes of memory allocators – User-Level MA (UMA) • it serves the requests from application processes
– Kernel-Level MA (KMA) • it serves the requests from OS kernel subsystems
• When a memory request exceeds the available memory size in the process’ heap, the UMA requests additional memory to the OS (the KMA). – this received portion of additional memory is then linked into the heap of the process and managed by its UMA.
2011 IEEE International Conference on Systems, Man, and Cybernetics
Oct 2011, Anchorage AK, US
5/X
Introduction
Memory Allocators (cont’d) • The UMA is an integral part of the applications – its code is usually stored in the standard C library (e.g., glibc) – glibc is automatically linked (statically or dynamically) to all programs, bringing in its default UMA.
• It is possible to use another UMA than that available in the glibc. – this is up to the programmer to choose the UMA of interest
– however, many programmers don’t know about this possibility – the transparent use of glibc hides these details
2011 IEEE International Conference on Systems, Man, and Cybernetics
Oct 2011, Anchorage AK, US
6/X
Introduction
Memory Allocators (cont’d) • Nowadays there are plenty of memory allocators: – hoard, jemalloc, nedmalloc, TCMalloc, TSLF, Dlmalloc, ptmalloc, …
• Each memory allocator algorithm has a different approach to manage the heap • Experimented software engineers may decide to write a specific memory allocator for their application needs – e.g., Firefox, Chrome, PostgreSQL, Apache httpd, …
• Currently, there are several proprietary and open source memory allocator algorithms – the choice of the allocator that provides the best performance for a given application must be based on experimental tests. 2011 IEEE International Conference on Systems, Man, and Cybernetics
Oct 2011, Anchorage AK, US
7/X
Introduction
Motivation • Several studies have investigated the performance of UMA algorithms. – most of them are based on synthetic benchmarks (e.g., mtmalloctest ) – they stress the UMA routines and data structures using random operations
• The above approach can hardly be generalized for real world applications. • We present a study that experimentally compares seven UMA, using real applications and workloads. – the chosen applications are part of a high-performance stock trading middleware, which is composed of three main applications.
• Our motivation for this choice is that middleware applications in general have high demand for memory allocations – they also usually do not bring their own UMA, relying on the default allocator for portability purpose. 2011 IEEE International Conference on Systems, Man, and Cybernetics
Oct 2011, Anchorage AK, US
8/X
User-level Memory Allocators
Background • When a process calls malloc/new for the first time, the UMA requests to the OS a heap area. – it may require one or more heaps.
• Subsequently, it creates and initializes the heap header. – the header structures are practically the same for all today’s memory allocators.
2011 IEEE International Conference on Systems, Man, and Cybernetics
Oct 2011, Anchorage AK, US
9/X
User-level Memory Allocators
Background (cont’d) • The Headers/Directories keep the list of free blocks – e.g., the memory slice 1016 is free.
• New heaps may be integrated to previous heaps. • Although the allocators have many similarities in terms of data structures, they do differ considerably in terms of heap management.
2011 IEEE International Conference on Systems, Man, and Cybernetics
General structures of an UMA
Oct 2011, Anchorage AK, US
10/X
User-level Memory Allocators
Background (cont’d) • Each UMA implements a different approach to deal with the problems in this area, such as blowup, false sharing, and memory contention. – all these problems are strongly affected by multithreading and multiprocessing.
• Blowup is the consumption of the whole system memory by a process. • False sharing is the phenomenon of two or more threads sharing the same cache line. – this occurs when two or more threads have acquired memory slices whose addresses are too close that they are located in the same cache line.
• Memory contention corresponds to the locking of threads due to a race condition for the same heap. – if multiple threads assigned to the same heap make memory requests, then contention will occur. 2011 IEEE International Conference on Systems, Man, and Cybernetics
Oct 2011, Anchorage AK, US
11/X
User-level Memory Allocators
Background (cont’d) • Each UMA deals with these problems using a different approach, which imposes a different performance among the allocators. • For this reason we evaluate the performance of seven different memory allocators: – Hoard (3.8), Ptmalloc (2), Ptmalloc (3), TCMalloc (1.5), Jemalloc (2.0.1), TLSF (2.4.6), Miser (cilk_8503-i686);
• We selected these allocators because – their source code are available allowing us to investigate their algorithms and also they are widely adopted.
2011 IEEE International Conference on Systems, Man, and Cybernetics
Oct 2011, Anchorage AK, US
12/X
User-level Memory Allocators
UMA Internals • To show how an UMA works, we select the memory allocator currently embedded in glibc – this means that all applications running under Linux, and without their specific implementation of UMA, use it.
• This allocator is the ptmalloc (version 2) – ptmallocv2 is based on another popular allocator called DLMalloc
• The design of ptmallocv2 is focused on – multithreaded applications running on multiprocessor computers
2011 IEEE International Conference on Systems, Man, and Cybernetics
Oct 2011, Anchorage AK, US
13/X
User-level Memory Allocators
UMA Internals (ptmallocv2) • Several UMA’s don’t show good performance for multithreaded applications – because the contention caused by multiples threads trying to access the same memory area (the Heap !)
• ptmallocv2 implements multiple heap areas (aka “Arenas”) to reduce contention in multithreaded applications – whenever a thread requests a memory block and all arenas are in use (locked by other threads), a new arena is created – as soon as the new request is served, the other threads can also share the recently created arena.
2011 IEEE International Conference on Systems, Man, and Cybernetics
Oct 2011, Anchorage AK, US
14/X
User-level Memory Allocators
UMA Internals (ptmallocv2) (cont’d)
2011 IEEE International Conference on Systems, Man, and Cybernetics
Oct 2011, Anchorage AK, US
15/X
User-level Memory Allocators
UMA Internals (ptmallocv2) (cont’d) • When the application frees a chunk, ptmallocv2 puts it back in one of these lists. • There are 2 classes of lists according to the chunk sizes : – Small bins (chunks of 16 – 512 bytes) – Large bins (up to 128 Kbytes)
2011 IEEE International Conference on Systems, Man, and Cybernetics
Oct 2011, Anchorage AK, US
16/X
User-level Memory Allocators
UMA Internals (ptmallocv2) (cont’d) • The ptmallocv2 provides memory chunks whose sizes are in power of two, starting from 16 (24) bytes. – if an application requests 20 bytes, ptmallocv2 provides a chunk of 32 bytes (25)
– this is the smaller chunk size (in power of two) that fits the request – note that 12 bytes are unused, which leads to internal fragmentation prev size size
block (chunk)
payload unused
2011 IEEE International Conference on Systems, Man, and Cybernetics
MP
internal fragmentation
Oct 2011, Anchorage AK, US
17/X
User-level Memory Allocators
UMA Internals (ptmallocv2) (cont’d) • External fragmentation also occurs – when there are non-contiguous free chunks to satisfy the request, although the heap area has enough space
2011 IEEE International Conference on Systems, Man, and Cybernetics
Oct 2011, Anchorage AK, US
18/X
User-level Memory Allocators
UMA Internals (ptmallocv2) (cont’d)
•
If the application requests 55 bytes, ptmallocv2 can not provide this chunk from the current heap.
•
although there are 160 bytes of free chunks, none of these chunks are large enough
•
In this case ptmallocv2 should request a new memory chunk to the operating system –
2011 IEEE International Conference on Systems, Man, and Cybernetics
it is significantly slower than using the process’ heap area.
Oct 2011, Anchorage AK, US
19/X
User-level Memory Allocators
UMA Internals (ptmallocv2) (cont’d) • This UMA is also vulnerable to memory leak – caused by programming mistakes chunk references
32 64 128 256 512 1024 allocated chunks
freelist[]
2011 IEEE International Conference on Systems, Man, and Cybernetics
Oct 2011, Anchorage AK, US
20/X
User-level Memory Allocators
UMA Internals (ptmallocv2) (cont’d) • This UMA is also vulnerable to memory leak – caused by programming mistakes chunk references
32 64 128 256 512 1024 allocated chunks
freelist[]
2011 IEEE International Conference on Systems, Man, and Cybernetics
Oct 2011, Anchorage AK, US
21/X
User-level Memory Allocators
UMA Internals (ptmallocv2) (cont’d) r1 pt ptr2
… ptr1=malloc(60) ptr2=malloc(250)
chunk references
…
… …
allocated chunks
32 64 128 256 512 1024 freelist[] Leaked chunk !!! Since this is not referenced anymore, it cannot be freed calling free(ptr1)
…
ptr1=malloc(1000)
chunk references ptr2
ptr1
allocated chunks 2011 IEEE International Conference on Systems, Man, and Cybernetics
32 64 128 256 512 1024 freelist[] Oct 2011, Anchorage AK, US
22/X
User-level Memory Allocators
Summary of the Evaluated UMA UMA Hoard Ptmallocv2 Ptmallocv3 TCMalloc Jemalloc Miser TLSF
Complexity Blowup False Sharing Contention O(n) yes yes yes O(1); O(n) no no yes O(1); O(log n) no no yes O(1) yes no yes O(1); O(log n) yes no yes O(1) no no No O(1) yes yes yes
2011 IEEE International Conference on Systems, Man, and Cybernetics
Oct 2011, Anchorage AK, US
23/X
Experimental Study
Methodology • Our experimental study is composed of two phases. • Characterization of application memory usage – we firstly ran a set of tests to characterize the memory usage of each investigated middleware applications.
– it is very important to understand the memory allocation pattern for each tested application, since each allocator has a specific approach to deal with different request sizes
• Evaluate UMA performance for each application – we linked the three applications to each investigated allocator and analyzed their performance in terms of: • transaction (selling/buying order) rate
• memory consumption • memory fragmentation
2011 IEEE International Conference on Systems, Man, and Cybernetics
Oct 2011, Anchorage AK, US
24/X
Experimental Study
Methodology • All tests were executed varying the number of processor cores – we tested for 1, 2, 3, and 4 cores
• All tests were replicated 15 times and used the averaged values to reduce the influence of experimental errors.
2011 IEEE International Conference on Systems, Man, and Cybernetics
Oct 2011, Anchorage AK, US
25/X
Experimental Study
Instrumentation • The middleware used is composed of three major applications. – App1 is responsible for the middleware core services (e.g., FIX protocol communication).
– App2 is the session manager controlling all user sessions. – App3 is the data manager responsible for all transactional control, keeping track of each order flow and implementing all business rules (e.g., risk analysis).
• The whole middleware runs under Linux and its applications are implemented as multithreaded processes.
2011 IEEE International Conference on Systems, Man, and Cybernetics
Oct 2011, Anchorage AK, US
26/X
Experimental Study
Instrumentation • To characterize the memory usage for each application, we use the glibc memory allocation hook mechanism [14] – it let’s to modify the behavior of malloc/free, new/delete, and realloc standard operations.
– we install our own data collection routines using these hooks to keep track of all allocation and deallocation operations, for each application.
2011 IEEE International Conference on Systems, Man, and Cybernetics
Oct 2011, Anchorage AK, US
27/X
Experimental Study
Instrumentation • We replace the default UMA of each application for each one of the seven evaluated allocators. – we instruct the Linux dynamic linker to load each evaluated allocator before we start a test.
– this is accomplished by exporting the LD_PRELOAD environment variable [15]. • $ export LD_PRELOAD = libjemalloc.so; ./middleware_start • it ensures all middleware applications are linked dynamically to the Jemalloc allocator.
2011 IEEE International Conference on Systems, Man, and Cybernetics
Oct 2011, Anchorage AK, US
28/X
Experimental Study
Instrumentation • We monitor the Linux RSS (resident set size) variable for each application process. • We also use Kernel instrumentation, SystemTap [16], to monitor the number of kernel events related to memory fragmentation. • To the best of our knowledge, none of the related experimental works have considered memory fragmentation in their studies.
2011 IEEE International Conference on Systems, Man, and Cybernetics
Oct 2011, Anchorage AK, US
29/X
Result Analysis
Memory Usage Characterization Cumulative Allocation Sizes Distribution for App1 3500000
# of requests
3000000 2500000 2000000
64 bytes
1500000 1000000 500000 0 1
31 61 93 125 159 194 229 265 296 326 356 386 416 446 476 506 request size
2011 IEEE International Conference on Systems, Man, and Cybernetics
Oct 2011, Anchorage AK, US
30/X
Result Analysis
Memory Usage Characterization Cumulative Allocation Sizes Distribution for App2 300000
# of requests
250000 200000 150000
64 bytes
100000 50000 0 2
22
42
62
83
2011 IEEE International Conference on Systems, Man, and Cybernetics
107 132 159 request size
Oct 2011, Anchorage AK, US
190
221
278
500
31/X
Result Analysis
Memory Usage Characterization Cumulative Allocation Sizes Distribution for App3 # of requests
5000000 4000000 3000000
64 bytes
2000000 1000000 0 2
32 62 92 122 152 182 215 247 285 315 345 375 405 435 468 498 request size
2011 IEEE International Conference on Systems, Man, and Cybernetics
Oct 2011, Anchorage AK, US
32/X
Result Analysis
Memory Usage Characterization • These results show that memory request sizes in the three applications are predominantly smaller than 64 bytes. – specially, the requests for twenty-four bytes are the most prevalent observed in the three applications.
• Due to the high number of allocations per second (App1=4600, App2=80000, App3=50000), the charts just show the dataset related to one-minute load. • The observed patterns indicate that good allocators for these applications should be optimized for smaller memory blocks.
2011 IEEE International Conference on Systems, Man, and Cybernetics
Oct 2011, Anchorage AK, US
33/X
Result Analysis
Performance Tests • We process 20,000 stock orders and measured: – the time spent by the middleware – memory consumption per application – number of memory fragmentation events per application
• We did these tests for each different number of cores – 1 up to 4.
2011 IEEE International Conference on Systems, Man, and Cybernetics
Oct 2011, Anchorage AK, US
34/X
Result Analysis
Performance Tests Middleware Throughput PTMALLOCv2 HOARD TLSF PTMALLOCv3
600
TCMALLOC MISER JEMALLOC
time (s)
500 400 300 200 100 0 1 Cores
2 Cores
3 Cores
4 Cores
•
TCMalloc shows the best performance for all number of cores, followed by Jemalloc and Hoard.
•
Hoard improves as the number of cores increases over two, most probably because it starts having a higher number of local heaps.
•
These three allocators implement local heaps, which are responsible for serving requests of small size in a faster way, thus being appropriate to the middleware memory usage pattern.
•
For all number of cores, the Ptmallocv2 shows worse performance than TCMalloc and Jemalloc.
2011 IEEE International Conference on Systems, Man, and Cybernetics
Oct 2011, Anchorage AK, US
35/X
Result Analysis
Performance Tests
memory consumption (kB)
Middleware Memory Consumption PTMALLOCv2 HOARD TLSF PTMALLOCv3
3000
TCMALLOC MISER JEMALLOC
2500 2000 1500 1000 500 0 1 Cores
2 Cores
3 Cores
4 Cores
• Except for one core, in all other tests the TCMalloc shows the lowest average memory consumption, and the TLSF the highest one. 2011 IEEE International Conference on Systems, Man, and Cybernetics
Oct 2011, Anchorage AK, US
36/X
Result Analysis
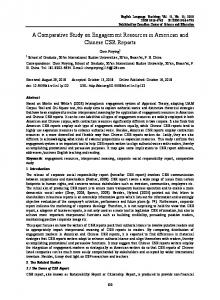
Performance Tests # of fragmentation events
Memory Fragmentation Level 700 600
PTMALLOCv2
TCMALLOC
HOARD
500
MISER
TLSF
JEMALLOC
400
PTMALLOCv3
300 200 100 0 1 Core
2 Cores
3 Cores
4 Cores
•
TLSF shows the lowest level of memory fragmentation, followed by TCMalloc, possibly because it uses only one heap from where all requests are served, simplifying its address space.
•
Hoard and Jemalloc show the worst performance for all number of cores. This result is consistent considering that Jemalloc is strongly based on the Hoard design.
2011 IEEE International Conference on Systems, Man, and Cybernetics
Oct 2011, Anchorage AK, US
37/X
Result Analysis
Conclusion • TCMalloc showed the best results in all evaluation criteria.
• Jemalloc and Hoard show very good performance in terms of response time, but they present high memory consumption and fragmentation. – in long lasting applications, fragmentation should be the smallest possible because it contributes significantly to the memory exhaustion in long-term executions.
• Hence, we consider the Ptmallocv3 as a second option among all the evaluated allocators.
2011 IEEE International Conference on Systems, Man, and Cybernetics
Oct 2011, Anchorage AK, US
38/X
Conclusion
Final Remarks •
We present a systematic approach to evaluate UMA, highlighting the importance of the characterization phase.
•
We compare the allocators based on their response time, memory consumption, memory fragmentation, and a combination of these aspects on different numbers of processor cores.
•
This four-dimension approach allows the experimenter to have a better view of each allocator benefits and limitations, per application.
•
Finally, the results obtained in the stock trading middleware case study are discussed in general terms (e.g., request sizes and number of requests) – It allows one to apply these results to applications showing similar allocation patterns. – e.g., Jemalloc should not be used for a multithreading application running in a single core machine, whose request sizes are less than 64 bytes and where fragmentation is a major concern.
2011 IEEE International Conference on Systems, Man, and Cybernetics
Oct 2011, Anchorage AK, US
39/X
Acknowledge • Rivalino Matias thanks CAPES for the Grant nr. 3938/11-5 (AEX).
2011 IEEE International Conference on Systems, Man, and Cybernetics
Oct 2011, Anchorage AK, US
40/X
Thank You! Rivalino Matias Jr.
[email protected]
2011 IEEE International Conference on Systems, Man, and Cybernetics
Oct 2011, Anchorage AK, US
41/X