A Comparative Usability and End-User Satisfaction Analysis of Two GIS Applications Mark E. Barner US Air Force Academy USAF Academy, CO 80840 719-333-8387 email:
[email protected] Summer E. Bartczak University of Central Arkansas 201 Donaghey Ave. Conway, Arkansas 72035 501-852-2359 e-mail:
[email protected] Kevin L. Elder Georgia Southern University Statesboro, GA 30460-7998 912-478-5474 email:
[email protected] James P. Downey University of Central Arkansas 201 Donaghey Ave. Conway, Arkansas 72035 501-450-5327 e-mail:
[email protected]
ABSTRACT U.S. Air Force installations are making increasing use of geographic information systems. Without AF-wide oversight early on, however, multiple applications, which serve similar purposes, emerged. As such, continuing support is problematic and has generated interest in a comparison method for determining which of similar applications perform better. This research details a first attempt at developing such a methodology focusing specifically on usability and end-user satisfaction. Two different GIS applications being used in the AF Civil Engineer (CE) community for the management of airfield obstructions—the Airfield Obstruction Management System (AOMS) and the Airfield Obstruction Tracking, Analysis, and Management System (AIROBS)--were the focus of this study. The results showed that the proposed methodology can be a start in attempts to compare GIS applications as it revealed that AOMS had fewer usability issues and rated slightly higher in end-user computing satisfaction.
119
The views expressed in this paper are those of the author and do not reflect the official policy or position of the United States Air Force, Department of Defense, or the United States Government.
120
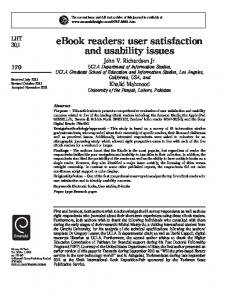
INTRODUCTION The U.S. Air Force has recognized that organizations across AF installations often require geospatial information resources or maps to accomplish mission essential tasks such as land use planning, identifying disaster response cordon/stand-off distances and emergency response routes, and locating underground utilities just to name a few. To provide an AF-wide approach to addressing this need, in 2001, the Headquarters Air Force Geo Integration Office (HAF GIO) formed the USAF GeoBase program. As GeoBase has been implemented across the AF, there have been no mandated product standards for GIS applications. As such, the use of multiple applications, many of which serve similar purposes, have emerged. As a result, accountability for the many applications in use and financial and technical support has become problematic. These issues have generated interest in the use of a comparison method for determining which of similar applications perform better in order to perhaps, in the future, provide support for elimination of duplicative applications. This research highlights an initial attempt at developing a methodology that allows for a basic comparison of GIS applications. This methodology was applied to two similar GIS applications used across the Civil Engineer (CE) community for the management of airfield obstructions--the Airfield Obstruction Management System (AOMS) and the Airfield Obstruction Tracking, Analysis, and Management System (AIROBS). The following research questions were addressed: 1. What key attributes should be evaluated in a methodology used to compare GIS applications and what would an accompanying measurement instrument consist of? 2. How do AOMS and AIROBS compare in software usability, where usability criteria measures error abatement, responsiveness, descriptiveness, consistency, and simplicity? 3. How do AOMS and AIROBS compare in end-user computing satisfaction (EUCS), as determined by the measures of content, format, and ease of use provided by each application? LITERATURE REVIEW GIS Defined “A GIS is a special type of information system concerned with geographically referenced data” (Worboys & Duckham, 2004, p.2). A GIS has two distinguishing characteristics that make it different from a standard information system. First, the data in a GIS are “spatially referenced, usually with x-y or latitude-longitude coordinates.” Second, a GIS will normally have mapping capabilities associated with them (Pittman, 1990, p. 4). As with a standard IS, the central part of any GIS is the database. The database contains map layers (Figure 1) that represent geographic features, which are referenced to a 121
standard coordinate system such as the Universal Transverse Mercator or State Plane Coordinate system (Fung & Remsen, 1997, p. 18).
Figure 1. A GIS database may be conceptualized as a stack of floating map layers registered to a common map base. (Adapted from Fung & Remsen, 1997) AF GISs--Airfield Obstruction Management Systems On July 24, 1998, at Misawa Air Base, Japan, an F-16 pilot aborted takeoff and crashed. The aircraft went off the runway and struck various structures of the approach lighting and instrument landing system localizer antenna systems. The external fuel tanks were damaged and the aircraft caught fire. Although the pilot ejected, he drifted into the fire before reaching the ground and suffered fatal burns (Holliday, 2001, p. 1). As a result, in late 1999, the AF Inspector General conducted a review of construction and repair projects at Misawa AB. In response, the AF Chief of Staff directed that corrective action be taken to reduce airfield obstructions. Airfield obstructions can be objects such as signs, towers, buildings, landforms, trees and other vegetation that “penetrate regulatory airspace surfaces” (CH2M-Hill, n.d.). This directive included instructions that all AF bases identify airfield obstructions and stated a plan should be developed to mitigate airfield obstructions (Air Force Tiger Team, 2000 p. 7). Eventually, both airfield obstruction management (GIS) systems—AOMS and AIROBS--were specifically developed to facilitate the documenting, mapping, analysis, tracking, and management of airfield obstructions (AIROBS: Airfield Obstruction Management System, 2004; HB&A, 2004). AOMS is being used at approximately 60 military installations worldwide while AIROBS is in use at approximately 12 AF installations world-wide. According to Mr Michael Ates, Civil Engineer Division at the Air Force Civil Engineer Support Agency (AFCESA), “AOMS and AIROBS are essentially the same but refined by two different companies” (Ates, 2005). Comparing Attributes of Information Systems A review of the information systems literature indicated that there are many attributes by which information systems can be compared such as usability, end-user satisfaction, systems success, etc. Given the nature of the GIS applications being researched, the desired outcomes of the comparative analysis, and the measurement instruments already 122
available in the literature, the researchers chose to focus on usability and satisfaction attributes specifically. METHODOLOGY As a result of the literature review, it was decided to conduct the research using an overall qualitative methodology focusing on two key comparative attributes—usability and end-user satisfaction. A preliminary evaluation instrument was developed that consisted of a combination of the elements of the Air Force Operational Test and Evaluation Center (AFOTEC) software usability evaluation tool along with an adapted version of a validated end-user computing satisfaction (EUCS) instrument. The assessment of the software by respondents required the development of specific task scenarios (by the researchers and CE community planners) such as loading a new obstruction, editing an existing obstruction, and producing a summary report—all activities required for effective management of airfield obstruction information. The usability portion of the evaluation gathered qualitative responses with regard to problem areas within both applications as seen by respondents. The EUCS evaluation allowed the use of descriptive statistics to measure the constructs of content, format, and ease of use along with the overall satisfaction provided by the application. The following paragraphs detail the development of the methodology and assessment instrument in detail. Usability Evaluation Since the research was conducted in order to provide feedback to an AF audience on an AF system, it was decided to use of the AFOTEC Software Usability Evaluation instrument in deference to other usability assessment tools. The purpose of this tool is to focus on the user’s interaction with a software-intensive system (HQ Air Force Operational Test and Evaluation Center, 1994, p. 26). There are many views on the definition of usability. Bevan, et al, defines usability as “the ease of use and acceptability of a system or product for a particular class of users carrying out specific tasks in a specific environment” (Bevan et al., 1991). The ISO/International Electrotechnical Commission (IEC), 9126-1 (2000) defines usability as “the capability of the software product to be understood, learned, used and attractive to the user, when used under specified conditions” (Bevan, 2003). Along with the many definitions of usability, there are many attributes associated with the usability construct. Some of those attributes include learnability, understandability, reliability, and satisfaction, just to name a few (Bevan, 2003; Juristo et al., 2003). The AFOTEC Software Usability Evaluation identifies the attributes of error abatement, responsiveness, descriptiveness, consistency, and simplicity (HQ AFOTEC, 1994, p. 148). See Table 1 below for definitions. The usability assessment portion of the final evaluation instrument consisted of a subset of 35 out of the 177 original items covering the attributes described in Table 1. )
123
AFOTEC Usability Attributes and Definitions Error Abatement
Aids in validating data and avoiding or correcting errors
Responsiveness
Allows the user to effectively direct system operation
Descriptiveness
Provides the user with adequate explanations of every function he/she is required to perform and every function the system performs
Consistency Simplicity
The behavior of the software corresponds to the expectations of the user Information presented to the user is grouped into short, readily understandable structures
Table 1. AFOTEC Software Usability Evaluation Attributes The 35 items chosen were selected by the researcher and three additional experts after reviewing both GIS applications and the applicability of the evaluation items to functions of the software. Each of the 35 items were assessed using a nominal scale depicted in the excerpt in Table 2 below. 10. Menu selection options are readily understandable. ALWAYS
NOT ALWAYS
DON’T KNOW
NOT APPLICABLE
○
○
○
○
For a response of “NOT ALWAYS”, please provide an example of where the feature is lacking: ____________________________________________________________________________________ ____________________________________________________________________________________ What is the overall impact of this feature on operational effectiveness? VERY LOW
○
LOW
MEDIUM
HIGH
VERY HIGH
○ ○ ○ Table 2. AFOTEC Software Usability Evaluation Example
○
End-User Computing Satisfaction Evaluation Doll and Torkzadeh’s primary goal in the development of the EUCS instrument was to “focus on satisfaction with the information product provided by a specific application” (Doll & Torkzadeh, 1988, p. 260). They also conceptualized EUCS as the “affective attitude towards a specific computer application by someone who interacts with the application directly” (Doll & Torkzadeh, 1988, p. 261). The EUCS construct contains five subscales (content, accuracy, format, ease of use, and timeliness). The EUCS instrument used to measure overall satisfaction and the five subscales consists of 12 items. The instrument has been validated in a number of past studies by Doll and Torkzadeh (1988); Torkzadeh and Doll (1991); McHaney and Cronan (1998); and Abdinnour-Helm, et al (2005). The internal consistency reliability (Cronbach’s alpha) for the overall EUCS instrument used in the previous studies was .92, .94, .91, and .94 respectively. For the purpose of this research the subscales of accuracy and timeliness 124
were not assessed. The resulting instrument used in this research had eight items measuring content, format, and ease of use. The original EUCS instrument items and the modified items are shown in Table 3 below. Subscale
Original Question
Content (Doll & Torkzadeh, 1988, p. 268)
Format
Does the system provide the precise information you need?
Does the application provide the precise information you need?
Does the information content meet your needs?
Does the information content meet your needs?
Does the system provide reports that seem to be just about exactly what you need?
Does the application provide reports that seem to be just about exactly what you need?
Does the system provide sufficient information?
Does the application provide sufficient information?
Do you think the output is presented in a useful manner?
Do you think the output is presented in a useful manner?
Is the information clear?
Is the information clear?
Is the system user friendly?
Is the application user friendly?
Is the system easy to use?
Is the application easy to use?
(Doll & Torkzadeh, 1988, p. 268)
Ease of Use (Doll & Torkzadeh, 1988, p. 268)
Modified Question
Table 3. List of Original Questions and Modified EUCS Questions Each of the eight EUCS items were assessed using a using a five item Likert scale ranging from Almost Always to Almost Never depicted in the excerpt in Table 4 below.
Almost Never
Some of the Time
About Half Of the Time
Most of the Time
Almost Always
36. Does the application provide the precise information you need?
37. Does the information content meet your needs?
38. Does the application provide reports that seem to be just about exactly what you need?
39. Does the application provide sufficient information?
40. Do you think the output is presented in a useful manner? 41. Is the information clear? 42. Is the application user friendly? 43. Is the application easy to use? Table 4. EUCS Evaluation Items 125
The final evaluation instrument consisted of 48 items. Demographic information to include rank, time in service, and experience level with GIS/GeoBase applications was also collected. A copy of the complete evaluation instrument can be provided upon request. Data Collection and Sample The application evaluations were conducted in a small conference room. Two PCs were set up with AIROBS loaded on one and AOMS loaded on the other. The AIROBS and AOMS applications and the respective databases used for the evaluations came from active AF installations. ESRI’s ArcGIS 8.3 provided the mapping capability and was used with both applications. ESRI ArcGIS is a GIS software used for visualizing, managing, and analyzing geographic data (ESRI, 2006). The scenarios and questionnaire was provided to the respondents at the beginning of the evaluation process. The respondents worked through the scenarios prior to answering the questionnaire. They were assigned to an application on an alternating basis. This allowed for the researchers to get an equal number of evaluations for each application. There were 20 respondents who provided ten evaluations for each application. The respondents chosen for this research consisted of CE officers and civilians who were Air Force Institute of Technology master’s degree program students or staff personnel from the Civil Engineering School. All were volunteers who were contacted via email. The group was selected based on their knowledge of CE organizational processes. The average time-inservice for all respondents was six years and five months with only four months separating the average time-in-service for the AIROBS and AOMS evaluators. Just over half of the evaluators had worked with GIS/GeoBase applications, and those evaluators rated their level of experience as “some”. Data Analysis The analysis of the usability portion of the evaluation focused on the qualitative analyses of the Not Always responses and accompanying comments. A three step process was used. First, the items that received a Not Always response were grouped together in order of the impact ratings (Very High to Very Low). Next, the responses were grouped by attribute and function for easier identification of related problems. Finally, a content analysis of the comments was conducted to further identify problem areas. The analysis of the EUCS items was conducted using descriptive statistics. The questionnaire used a five-item Likert scale ranging from Almost Never (1), Some of the Time (2), About Half of the Time (3), Most of the Time (4), and Almost Always (5). Based on this scale, a mean of 4 (Most of the Time) or better indicated that the evaluators found the application provided the intent of the questionnaire item between Most of the Time (4) and Almost Always (5). Means above 4.5 indicated a higher number of evaluators rated the application as Almost Always in terms of the content, format, and ease of use as specified by the questionnaire items. The internal consistency measure for the modified instrument was .76 where a value of .70 is considered acceptable (Nunnally & Bernstein, 1994). 126
RESULTS AND DISCUSSION The methodology developed, although not without limitations, provided a sufficiently rigorous, yet preliminary, approach to comparing two GIS applications. The outcomes offered an initial comparison of two very similar GIS applications with respect to various usability and user satisfaction constructs. Specifically, the usability evaluation revealed that AOMS demonstrated fewer usability problems than AIROBS. AOMS received 19 Not Always responses versus 25 by AIROBS. Also, AOMS received fewer negative comments (37) than did AIROBS (61). As shown in Table 5, there were five items that received a significant difference of Always responses between the two applications. A significant difference meant that one application received a majority of Always responses for the same item. The AOMS application received a majority of Always responses for four of the five items. Item #
Attribute
Item
# Always AOMS
# Always AIROBS
6
Consistency
Where data are entered from source documents, the format for data entry corresponds to that of the source documents.
6
2
9
Error Abatement
The system provides adequate notification when it detects a data entry error.
3
6
17
Simplicity
Information is easy to find on the screen.
7
5
25
Simplicity
Where several windows are displayed simultaneously, it is easy for the user to shift among them to select which window is to be made active.
9
4
28
Simplicity
Graphic symbology is appropriate for the information it represents.
10
5
n=10
Table 5. Items with a Significant Difference of Always Responses As for the end-user computing satisfaction comparison, the analysis revealed that AOMS had higher means for overall EUCS, content, and ease of use. As shown in Table 6 below, the means for the subscales and the overall AOMS EUCS construct range from 4.55 to 4.65. As shown in Table 7, the means for the subscales and the overall AIROBS EUCS construct range from 4.2 to 4.55. The ratings received for the subscales and the overall questionnaire as applied to the task scenarios revealed that the aspects of the application (content, format, ease of use) highly influenced the satisfaction of the evaluators. Since the internal consistency of the format construct for the AIROBS EUCS assessment was so low (“< .5 is unacceptable” George & Mallery, 2005), it was not used in any comparative judgment.
127
α
M
SD
Overall EUCS Statistics for AOMS
.83
4.61
3.81
Content
.78
4.65
2.37
36. Does the application provide the precise information you need?
4.70
.67
37. Does the information content meet your needs?
4.50
1.10
38. Does the application provide reports that seem to be just about exactly what you need?
4.70
.48
39. Does the application provide sufficient information?
4.70
.67
4.60
1.14
40. Do you think the output is presented in a useful manner?
4.50
.70
41. Is the information clear?
4.70
.48
4.55
1.37
42. Is the application user friendly?
4.60
.70
43. Is the application easy to use?
4.50
.70
Item/Subscale
Format
.86
Ease of Use
.95
n=10
Table 6. AOMS EUCS Statistics α
M
SD
Overall EUCS Statistics for AIROBS
.62
4.43
2.72
Content
.67
4.55
1.55
36. Does the application provide the precise information you need?
4.60
.52
37. Does the information content meet your needs?
4.40
.52
38. Does the application provide reports that seem to be just about exactly what you need?
4.40
.70
39. Does the application provide sufficient information?
4.80
.42
4.40
1.03
40. Do you think the output is presented in a useful manner?
4.50
.71
41. Is the information clear?
4.30
.67
4.20
1.51
42. Is the application user friendly?
4.20
.63
43. Is the application easy to use?
4.20
.92
Item/Subscale
Format
.21
Ease of Use
.90
n=10
Table 7. AIROBS EUCS Statistics 128
LIMITATIONS A first limitation was that the usability evaluation portion of this research was conducted using an assessment tool intended to be used in the application design process. Secondly, the respondents had no prior experience with the airfield obstruction management GIS applications. Thirdly, the small number of respondents (10 per application) make it difficult to generalize the results to a larger population. Finally, there could be issues with validity and reliability of the final assessment results. With regard to the AFOTEC usability assessment tool, results from previous testing as to validity and reliability were not available. IMPLICATIONS FOR THEORY AND PRACTICE This was the first time a comparative analysis has been conducted on two similar GIS applications being used in the AF. In addition to offering a new methodology for conducting such a comparison, this research provided practical results with respect to the AOMS and AIROBS GIS applications. In general, the results appear to indicate a connection between usability and end-user satisfaction where, with respect to results of this research, applications are assessed as more usable the users express more satisfaction with them. Additionally, the AF Civil Engineer leaders now have some new information to build upon if constraints drive the elimination of one application or the other. Future research to refine the evaluation instrument, evaluate with more respondents, and apply to other GIS applications would be extremely beneficial. REFERENCES Abdinnour-Helm, S., F., Chaparro, B., S., & Farmer, S., M. (2005). Using the End-User Computing Satisfaction (EUCS) Instrument to Measure Satisfaction with a Web Site. Decision Sciences, 36(2), 341. Air Force Tiger Team. (2000). Airfield Obstruction Reduction Initiative Report (pp. 36): HQ AF/ILE. AIROBS: Airfield Obstruction Management System. (2004). Retrieved 18 October, 2005, from https://tsc.wes.army.mil/products/AIROBS/Website/airobs.asp Ates, M. (2001). A-Gram: Airfield Obstruction Reduction Initiative (pp. 1): Air Force Civil Engineer Support Agency. Bevan, N. (2003). International Standards for HCI and Usability. Retrieved 30 December 2005, from http://www.usabilitynet.org/tools/r_international.htm Bevan, N., Kirakowski, J., & Maissel, J. (1991, September). What Is Usability? Paper presented at the 4th International Conference on Human Computer Interface, Stuttgart, Germany. 129
CH2MHill. (n.d.). Airfield Obstructions Management at DoD Installations: GIS/CADD Technology Center. Doll, W. J., & Torkzadeh, G. (1988). The Measurement of End-User Computing Satisfaction. MIS Quarterly, 12(2), 16. ESRI. (2006). Arcview-Desktop GIS for Mapping, Data Integration, and Analysis. Retrieved 15 January, 2006, from http://www.esri.com/software/arcgis/arcview/index.html Fung, D. S., & Remsen, A. P. (1997). Geographic Information Systems Technology for Business Applications. Journal of Applied Business Research, 13(3), 17. George, D., & Mallery, P. (2005). SPSS for Windows Step by Step: A Simple Guide and Reference, 12.0 Update (5th ed.). Boston: Pearson Education. Holliday, M. D. (2001). Pacific Air Forces Implementation of Airfield Obstruction Management System Software. Unpublished thesis, University of Alaska at Fairbanks, Fairbanks. HQ Air Force Operational Test and Evaluation Center. (1994). AFOTEC Pamphlet 99102: Software Usability Evaluation Guide (Vol. 4). Juristo, N., Lopez, M., Moreno, A. M., & Sanchez, M. I. (2003, May 3-4). Improving Software Usability through Architectural Patterns. Paper presented at the International Conference on Software Engineering, Portland, Oregon. McHaney, R., & Cronan, T. P. (1998). Computer Simulation Success: On the Use of the End-User Computing Satisfaction Instrument: A Comment. Decision Sciences, 29(2), 525. Nunnally, J. C., & Bernstein, I. H. (1994). Psychometric Theory (3rd ed.). New York: McGraw-Hill. Pittman, R. H. (1990). Geographic Information Systems: An Important New Tool for Economic Development Professionals. Economic Development Review, 8(4), 4. Torkzadeh, G., & Doll, W. J. (1991). Test-Retest Reliability of the End-User Computing Satisfaction Instrument. Decision Sciences, 22(1), 26. Worboys, M., & Duckham, M. (2004). GIS: A Computing Perspective (2nd ed.). Boca Raton, Fla.: CRC Press.
130