Australasian Accounting, Business and Finance Journal Volume 9 | Issue 2
Article 4
A Comparison Between a Dynamic and Static Approach to Asset Management Using CAPM Models on the Australian Securities Market Paul Mazzola University of Wollongong, Australia,
[email protected]
Dionigi Gerace University of Wollongong, Australia,
[email protected]
Follow this and additional works at: http://ro.uow.edu.au/aabfj Copyright ©2015 Australasian Accounting Business and Finance Journal and Authors. Recommended Citation Mazzola, Paul and Gerace, Dionigi, A Comparison Between a Dynamic and Static Approach to Asset Management Using CAPM Models on the Australian Securities Market, Australasian Accounting, Business and Finance Journal, 9(2), 2015, 43-58. Available at:http://ro.uow.edu.au/aabfj/vol9/iss2/4 Research Online is the open access institutional repository for the University of Wollongong. For further information contact the UOW Library:
[email protected]
A Comparison Between a Dynamic and Static Approach to Asset Management Using CAPM Models on the Australian Securities Market Abstract
Despite the capital asset pricing model being one of the most influential models in modern portfolio theory, it has also been a victim of criticism in numerous academic papers. Its assumptions which seem to be rather unrealistic, have caused many academics to improve the model by relaxing some of its restrictive statements. In this journal article, we compare the performance of an optimal portfolio of securities in the Australian securities market by constructing two theoretical portfolios; one using the capital asset pricing model which uses a single beta throughout a static investment horizon; and another, which allows the optimal portfolio to be rebalanced each week with an adjusted beta. The performance of the two theoretical portfolios is compared to determine the superior model. Overall, findings showed that due to rebalancing of the portfolio, the multiple period model was the superior model based on before and after transaction cost returns. Keywords
Financial Markets, Efficiency, Portfolio Optimization
This article is available in Australasian Accounting, Business and Finance Journal: http://ro.uow.edu.au/aabfj/vol9/iss2/4
A Comparison Between a Dynamic and Static Approach to Asset Management Using CAPM Models on the Australian Securities Market Paul Mazzola1 and Dionigi Gerace2 Abstract Despite the capital asset pricing model being one of the most influential models in modern portfolio theory, it has also been a victim of criticism in numerous academic papers. Its assumptions which seem to be rather unrealistic, have caused many academics to improve the model by relaxing some of its restrictive statements. In this journal article, we compare the performance of an optimal portfolio of securities in the Australian securities market by constructing two theoretical portfolios; one using the capital asset pricing model which uses a single beta throughout a static investment horizon; and another, which allows the optimal portfolio to be rebalanced each week with an adjusted beta. The performance of the two theoretical portfolios is compared to determine the superior model. Overall, findings showed that due to rebalancing of the portfolio, the multiple period model was the superior model based on before and after transaction cost returns. JEL Classification: G10, G20, C30 Keywords: Financial Markets, Efficiency, Portfolio Optimization.
1
University of Wollongong, Australia.
[email protected]
2
University of Wollongong, Australia.
[email protected]
Mazzola & Gerace | A Comparison Between Dynamic and Static Approach to Asset Management
1. Introduction and Literature Review The main objective of fund managers is to manage various assets and securities on behalf of investors and whilst doing so meet their specific investment goals. Many Fund managers attempt to construct portfolios to achieve the needs of investors by following what has now become one of the most widely used theories in modern finance, the Modern Portfolio Theory. One of the main aims of Modern Portfolio Theory is to construct an optimal portfolio by maximising returns whilst minimising risk. The objective of this study is to compare the performance of two portfolios of Australian securities: one portfolio using the Capital Asset Pricing Model (CAPM) and another using the Multiple Period Capital Asset Pricing Model (MP-CAPM). This is achieved by implementing optimal weights required for each model for the specified periods. Unlike some other research on this topic that uses simulated data, this study uses real data from securities listed on the Australian Securities Exchange to test whether the MP-CAPM is the superior model based on its ability to optimally rebalance the portfolio periodically (in this study weekly) according to changing market conditions whilst the CAPM model optimises the portfolio on day one and remains static for the selected time horizon. The obvious trade-off is between an anticipated superior return from the regularly rebalanced portfolio versus the transaction costs necessarily incurred in the rebalancing process. Despite CAPM being widely used as an accepted pricing model, it has not prevented academics to either develop their own models that follow more realistic real world scenarios, or make extensions to the CAPM in order to avoid any unrealistic assumptions found within CAPM itself. CAPM assumes the relevant source of risk is variation associated with security returns and the risk captured by the market portfolio (Bodie et al. 2007). Moreover, it presupposes that investors base their decisions on a single-period time horizon. A model developed by Merton (1973) makes an extension to CAPM by dropping the assumption of a singleperiod investment horizon and the existence of the abovementioned sources of risk. Merton’s model known as the Intertemporal Capital Asset Pricing Model (ICAPM) also incorporates a larger set of economic factors that can explain security returns more accurately. Amongst those characteristics examined by Merton (1973), multi-periodicity is the main focus of this study. Merton (1973) introduces us to the concept of multi-periodicity within the CAPM model, as he explains that in addition to investors facing multiple factors of risk, they also face an investment horizon with various phases related to economic cycles as opposed to the single-period horizon outlined by CAPM. In a multiple period domain, investors are concerned with unfavourable market movements that can lead to an unwanted shift in the efficient frontier. Merton (1973) explains that investors need to be compensated for this risk of unwanted shift in the efficient frontier in addition to the market risk. The former risk can be hedged by investors if they are able to identify the variables, known as hedged factors that cause such uncertainties, (Faff and Chan 1998). Merton emphasises the significance of constructing a hypothetical hedging portfolio that will protect investors from changes in these variables. This study selects the multipleperiodicity of Merton’s ICAPM whilst ignoring other factors to highlight the benefits of a 44
Mazzola & Gerace | A Comparison Between Dynamic and Static Approach to Asset Management
dynamic model over the static model represented by CAPM where beta is calculated over a single time horizon. Other studies have examined multiple factors in addition to multi-periodicity (Friend et al. 1976, McDonald and Solnick 1977, Faff and Chan 1998 and Bodie et al. 2007). While these studies provided extensions of the traditional CAPM model, none of them were able to isolate the effects of multi-periodicity. This study further adopts the key assumption given by ICAPM that trading in all securities takes place continually in time. In the case of no transaction cost and continuous time-trading of securities, any rational investor would prefer to revise their portfolio. Merton (1973) illustrates that an investor who is basing their decision on a single long-term investment will construct their portfolio on different criteria compared to an investor who has the choice of revising their portfolio if they wish to do so. Other papers such as, Fama (1970), Elton and Gruber (1974a) and Elton and Gruber (1974b) suggest that the multiple period investmentconsumption decisions can be cut down to a maximisation problem where an investor faces a single-period utility function. However, Merton (1971) argues that an investor who is seeking to maximise utility intertemporally, will change their behaviour and portfolio selection dramatically as the investor will face a changing efficient frontier instead of a fixed constant one established by the standard CAPM. Finally, the paper follows findings by Stoll and Whaley (1983), who find that transaction costs have a significant impact on short investment horizons by reducing CAPM’s returns for small firms; this paper shows significant effects for MP-CAPM’s after transaction costs over a long term horizon for the small capitalisation market segment as well as for the large capitalisation market segment which consists of high liquidity stocks. The paper is organised as follows: hypothesis testing is discussed in Section 2; Section 3 presents the data; Section 4 states the methodology employed; and Section 5 sets out the results and robustness tests whilst the findings and summary are shown in Section 6. 2. Key Hypothesis The major motivational factor for this study is the scarcity of existing literature on MPCAPM. In this paper, the aim is to compare the alpha arising from the MP-CAPM transaction cost adjusted returns, versus the standard CAPM returns. Alpha for the multi-period model is calculated as the difference between the optimal returns based on weekly rebalancing and the historical average for the corresponding weekly period. Similarly, alpha for the CAPM model is calculated as the difference between the return per annum on the optimised ASX 200 portfolio and the historical average for the same portfolio which has not been optimised for the corresponding yearly period. It is expected that the MPCAPM alpha should not be equal to the CAPM alpha given the frequency of the rebalancing. In summary, the following hypothesis is tested: 45
Mazzola & Gerace | A Comparison Between Dynamic and Static Approach to Asset Management
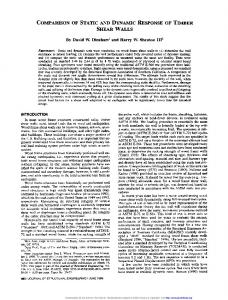
H0 : alphaMP−alphaCAPM=0 H1 : alphaMP−alphaCAPM ≠ 0 Intuitively, a frequently optimised portfolio should generate higher returns, all other conditions remaining constant. However, results may vary subject to transaction costs, period selection and the market capitalisation segmentation (that is small versus medium versus large capitalisation stocks) being tested. Methodologies used to obtain alphas are discussed in section 4. 3. Data Sample Stock price data was obtained from the SIRCA3 database. This included stock prices as well as market index data. Selection included all stocks within the S&P ASX 200 which is a market-capitalisation weighted and float-adjusted index of Australian stocks listed on the Australian Securities Exchange. The market index selected was the S&P/ASX 200, while the data for the risk-free rate was obtained from the Reserve Bank of Australia4. The RBA cash rate5 was used as a proxy for the risk-free interest rate as this is the rate charged on overnight loans between financial intermediaries and the RBA. It has a powerful influence on other interest rates and forms the base on which the structure of interest rates in the Australian economy is built. This annual rate was transformed into a weekly rate for the purpose of this study. An alternative is to use an Australian Government bond rate, however as is shown in chart 1 below, the spread between the 10 year government bond rate and the cash rate, traded between a relatively narrow range during the period of this study and is therefore the difference is deemed insignificant. The data period used for this study is 1 January 2001 to 31 December 2009. This 9 year period covers various economic cycles and therefore captures a period with a variety of changes in market conditions including the shock of the Global Financial Crisis and its impact on securities returns.
3
Securities Industry Research Centre Australia is a world-leading provider of finance related data and
technology (e-research) services to universities, public sector agencies and financial market participants worldwide. 4
The website for RBA is http://www.rba.gov.au/.
5
The Reserve Bank of Australia's measure of the cash rate is the interest rate which banks pay or charge to
borrow funds from or lend funds to other banks on an overnight unsecured basis. This measure is also known as the interbank overnight rate. The Reserve Bank of Australia calculates and publishes this cash rate each day on the basis of data collected directly from banks. This measure of the cash rate has been published by the Reserve Bank of Australia since June 1998. The Reserve Bank uses its domestic market operations (sometimes called "open market operations") to keep the cash rate as close as possible to the target set by the Reserve Bank Board, by managing the supply of funds available to banks in the money market. The choice of cash rates over a longer term government bond rate is justified because of its relative stability on a yearly basis over the sample period selected. 46
Mazzola & Gerace | A Comparison Between Dynamic and Static Approach to Asset Management
The adjusted closing price for stocks which takes into account any dividends payable for the period was used to determine the daily returns and standard deviation of the securities, and market spread was used in calculating transaction costs.
Chart 1.0
One of the key expenses that arise when maintaining a portfolio are transaction costs (Glosten et al 1985). When taken into account, many appealing investment opportunities do not seem so attractive. These costs include the spread as well as explicit costs which are estimated at 0.1% (retail investors may pay explicit costs as high as 0.30% per transaction value, while most institutional investors pay around 0.10%)6. The trade-off between incurring transaction costs and rebalancing portfolios has been taken into consideration, as modifying a portfolio too often will incur transaction costs that are likely to have material impact on returns. 4. Methodology The ability to monitor a portfolio with market movements is an important priority for some investors. CAPM produces an expected return based on a single period which presents limitations to investors. The construction of a portfolio which yields an expected return predicted by CAPM given its risk, may be optimal at the time of evaluation, but may not 6
An explicit cost of 0.1% was selected representing institutional fees, given that institutional transactions
account for the bulk of trades – 78% equity turnover by value (asx.com.au, accessed 10/09/2014). 47
Mazzola & Gerace | A Comparison Between Dynamic and Static Approach to Asset Management
remain optimal in the future as market conditions change. A popular portfolio strategy known as Strategic Asset Allocation (SAA) (Lintner 1965, Bawa 1975 and Brinson et al. 1986), refers to a plan for a portfolio that is designed to meet the investors’ goals over time. This is done by rebalancing the portfolio as the underlying market’s performance changes. Rebalancing is the method of changing the weights of each security within the portfolio by buying and selling in order to achieve the optimal portfolio. In this study, we consider the target portfolio to be the optimal portfolio. The act of rebalancing reduces risk relative to return in a portfolio. As the portfolio weights diverge from the SAA, the portfolio will not perform like the optimal portfolio in the then current market conditions. This is a form of risk, as the mis-weightings within the portfolio cause the risk profile and the expected returns for the portfolio to drift away from the optimal portfolio. This risk naturally needs to be considered in light of the transaction cost / rebalancing trade-off mentioned above. In the USA, The strategy of rebalancing can increase the average portfolio return by approximately half a percentage point per year (Zweig 2009). Robustness tests are also conducted according to both market sizes and different time lengths to check the consistency in results. 4.1 Weekly MP-CAPM Using the optimal weights for each week, we are able to easily determine the return and the standard deviation of the optimal weekly MP-CAPM portfolios using all the stocks forming the ASX200 index. The weekly optimal weights were obtained by using a risk minimisation, return maximisation function to generate the optimal portfolio. The optimal portfolio is represented as the tangent to the efficient frontier hyperbola with the highest Sharpe ratio7 (Sharpe 1994). This will give an important insight of how the portfolio is performing over time as the new optimal weights are required to keep the portfolio at the optimum level relative to the changes in the market compared to the single-horizon return performance produced by CAPM. 4.2 MP-CAPM Alphas Vs CAPM Alpha The CAPM and the MP-CAPM models are compared to assess which of the models generate the higher return relative to risk. This is achieved by comparing the alphas of the rebalanced MP-CAPM portfolio and the CAPM portfolio. The alphas are calculated on a weekly basis for the MP-CAPM model and once for the CAPM model at the end of the 9 year period. In general alpha is calculated as follows: (4.1) E (rp ) E (rm ) where E(rp) is the annualised expected return produced from either MP-CAPM or CAPM and, E(rm) is the annualised expected return of the market, using the ASX 200 as its proxy. Since CAPM and MP-CAPM are both equilibrium models, under perfect market conditions, alpha should be zero as all portfolios or securities should be fairly priced. Under these 7
The Sharpe ratio is a measure of the excess return (or risk premium) per unit of deviation in an investment
asset or a trading strategy, typically referred to as risk (and is a deviation risk measure), named after William Forsyth Sharpe. 48
Mazzola & Gerace | A Comparison Between Dynamic and Static Approach to Asset Management
conditions, the optimal portfolio is the market portfolio since all investors face the same efficient frontier. However given the existence of transaction costs and a less than perfect market, we expect to find variances. The first step is to build a set of alphas without considering transaction costs; specifically one is produced by using MP-CAPM, or Alpha_p_w, while the other is produced by CAPM, or Alpha_p, with the aim of determining whether these alphas are equal. Specifically, the hypothesis presented earlier can be restated as follows: (4.2) Dp pw p 0 where, Dp is the difference between the annualised weekly MP-CAPM alphas over the 9 year period ( p ) and the annualised CAPM alpha ( p ). w
To find whether the difference is significant, we perform a paired t-test, at the 5% significance level. If |t| ≥ tcritical, we reject the hypothesis H0. 4.3 Transaction Costs Stemming from the methodology above, this paper reassesses the transaction cost impact on returns abnormality analysed by Stoll and Whaley (1983), where their finding confirms that small firms show a significantly negative mean abnormal return after transaction costs for an investment horizon below one month. Therefore Dp is adjusted by a transaction cost measure equal to the proportional spread (Glosten and Milgron 1985) for each stock and an explicit cost of 0.1%, assuming the investor is institutional in nature (Stoll and Whaley, 1983). 5. Results Below are reported all the results for both the case where transaction costs are not considered and the case where transaction costs are taken into consideration. 5.1 Before Transaction Costs This section exhibits results obtained using CAPM and MP-CAPM on a yearly basis. Table 1, panel A, displays results for alphas obtained by weekly MP-CAPM’s and CAPM’s before transaction costs for the years 2001 to 2009. Six of the nine MP-CAPM alphas are positive and statistically significant (according to the t-test, meaning outperformance from the market benchmark), except for the years 2001, 2002 and 2008 which covered periods of significant market corrections; the aftermath of the ‘dot-com’ crash of 2000-2002 and the ‘global financial crisis’ of 2008 when average returns on the ASX declined by 48% and 56% respectively.
49
Mazzola & Gerace | A Comparison Between Dynamic and Static Approach to Asset Management
Table1 – Panel A: Overall Portfolio Before transaction costs Year MP_CAPM_Alpha 2001 -7.04% 2002 -11.81% 2003 8.14% 2004 1.62% 2005 5.48% 2006 4.54% 2007 2.64% 2008 -5.44% 2009 1.06% Average -0.09%
CAPM_alpha -1.95% -1.31% 0.09% 0.80% 0.51% -4.39% 0.67% -4.72% -0.45% -1.19%
The expected returns from the CAPM model show similar patterns with negative alphas for five of the nine years, i.e. 2001, 2002, 2006, 2008 and 2009. The overall average alpha before transaction costs for the MP-CAPM model over the 9 year period was superior at -0.09 % versus the average alpha for the CAPM model of -1.19%. 5.2 After Transaction Costs Table1 – Panel B: Overall Portfolio After transaction costs Year 2001 2002 2003 2004 2005 2006 2007 2008 2009 Average
MP_CAPM_Alpha -7.23% -12.00% 7.95% 1.43% 5.29% 4.35% 2.45% -5.63% 0.87% -0.47%
CAPM_alpha -1.95% -1.31% 0.09% 0.80% 0.51% -4.39% 0.67% -4.72% -0.45% -1.19%
Panel B of Table 1 shows lower returns in the MP-CAPM model after transaction costs are taken into consideration. After transaction costs the MP-CAPM model produced a statistically significant average alpha over the nine years of -0.47%, again outperforming the CAPM model, which produced a statistically significant average alpha of -1.19%.
50
Mazzola & Gerace | A Comparison Between Dynamic and Static Approach to Asset Management
The average transaction cost for MP-CAPM was 0.38% which narrows the difference between MP-CAPMs and CAPM results. Based on the above results, benchmark returns are superior to either MP-CAPM or CAPM returns on a total portfolio basis, accounting for negative alphas under both scenarios. 6. Robustness Tests In order to confirm the significance of these results, robustness tests are conducted. These include market segmentation analysis, and time varying analysis, as shown in the following sections. Market segmentation is a valuable robustness tool as it reveals whether the pattern of returns is repeated across different sized stocks. Time varying analysis is another useful test to check whether the rebalancing produces optimal portfolio performance over different timing intervals after considering transaction costs. 6.1 Market Segmentation Analysis This section exhibits results obtained using CAPM and MP-CAPM on a yearly basis for small market capitalisation stocks8. Table 2 – Panel A displays results for alphas obtained by weekly MP-CAPM’s and CAPM’s before transaction costs for the years 2001 to 2009. Six of the nine MP-CAPM alphas are positive and statistically significant (meaning outperformance from the market benchmark), except for the years 2001, 2002 and 2008, very similar to the results reported in Table 1 – Panel A. Table 2 Small Capitalisation Segment Panel A: Before transaction costs Year MP_CAPM_Alpha 2001 -6.85% 2002 -14.65% 2003 8.74% 2004 0.94% 2005 5.75% 2006 4.81% 2007 3.00% 2008 -5.84% 2009 1.33% Average -0.31%
CAPM_alpha -2.45% -3.56% -1.35% -0.24% -0.09% -4.89% 0.17% -5.22% -0.95% -2.06%
The expected returns from the CAPM model show very different patterns from the results 8
Small-cap stock can vary in interpretation, but typically on the ASX, it means companies that are valued at
between $20 million and $200 million. Medium-cap stocks are valued between $200 million and $800 million, whilst Large-cap stocks are valued above $800 million. Alphas for each segments were calculated using their respective indices as proxies for the benchmark (S&P/ASX SMALL ORDINARIES or AXSO for small cap, S&P/ASX MIDCAP50 or AXMD for mid cap, S&P/ASX 50 or AFLI for large cap). 51
Mazzola & Gerace | A Comparison Between Dynamic and Static Approach to Asset Management
shown in Table 1 – Panel A, with negative alphas for eight of the nine years, excluding the year 2007. The overall average alpha before transaction costs for the MP-CAPM model over the 9 year period was superior at -0.31 % versus the average alpha for the CAPM model of 2.06%. Table 2 Small Capitalisation Segment Panel B: After transaction costs Year MP_CAPM_Alpha 2001 -7.42% 2002 -15.22% 2003 8.17% 2004 0.37% 2005 5.18% 2006 4.24% 2007 2.43% 2008 -6.41% 2009 0.76% Average -0.88%
CAPM_alpha -2.45% -3.56% -1.35% -0.24% -0.09% -4.89% 0.17% -5.22% -0.95% -2.06%
Panel B of table 2 shows lower returns in MP-CAPM after transaction costs are taken into consideration, as expected given the results in table 1 – Panel B. After transaction costs, the MP-CAPM model which produced an average alpha over the nine years of -0.88% again outperformed the CAPM model which produced an average alpha of -2.06%. The average transaction cost for MP-CAPM was 0.57% which narrows the difference between MPCAPMs and CAPM results for small caps. Based on the above results, benchmark returns are still superior to either MP-CAPM or CAPM returns on a total portfolio basis, accounting for negative returns under both scenarios. Table 3 Mid-Capitalisation Segment Panel A: Before transaction costs Year MP_CAPM_Alpha -6.88% 2001 -5.57% 2002 5.14% 2003 1.32% 2004 2.28% 2005 2.16% 2006 0.19% 2007 -4.58% 2008 -0.85% 2009 -0.75% Average
CAPM_alpha -2.52% 1.63% 1.42% 1.31% 0.16% -4.96% 0.10% -5.29% -1.02% -1.02%
52
Mazzola & Gerace | A Comparison Between Dynamic and Static Approach to Asset Management
This section exhibits results obtained using CAPM and MP-CAPM on a yearly basis for medium market capitalisation stocks. Table 3 displays similar pattern of results as for small caps above, whereby the MP-CAPM after transaction cost returns significantly differ from the before transaction cost returns by approximately 39bps. Benchmark returns remain superior over both MP-CAPM and CAPM. Table 3 Mid-Capitalisation Segment Panel B: After transaction costs Year MP_CAPM_Alpha 2001 -7.27% 2002 -5.96% 2003 4.75% 2004 0.93% 2005 1.89% 2006 1.77% 2007 -0.20% 2008 -4.97% 2009 -1.24% Average -1.14%
CAPM_alpha -2.52% 1.63% 1.42% 1.31% 0.16% -4.96% 0.10% -5.29% -1.02% -1.02%
For large market capitalisation stocks, Table 4 – Panel A shows similar pattern of returns and an average outperformance of the MP-CAPM model. Table 4 Large Capitalisation Segment Panel A: Before transaction costs Year MP_CAPM_Alpha -5.29% 2001 -13.09% 2002 10.30% 2003 2.50% 2004 7.31% 2005 6.37% 2006 4.56% 2007 -4.28% 2008 2.89% 2009 1.25% Average
CAPM_alpha -0.89% -2.00% 0.21% 1.32% 1.47% -3.33% 1.73% -3.66% 0.61% -0.50%
53
Mazzola & Gerace | A Comparison Between Dynamic and Static Approach to Asset Management
Table 4 Large Capitalisation Segment Panel B: After transaction costs Year MP_CAPM_Alpha 2001 -5.44% 2002 -13.24% 2003 10.15% 2004 2.32% 2005 7.16% 2006 6.05% 2007 4.21% 2008 -4.61% 2009 2.72% Average
1.04%
CAPM_alpha -0.89% -2.00% 0.21% 1.32% 1.47% -3.33% 1.73% -3.66% 0.61% -0.50%
Table 4 – Panel B again indicates the importance of transaction costs on average returns. In this portfolio however, transaction costs approximated 21bps, which is significantly smaller than both small and medium capitalisation segments, and it is explained by a significant higher liquidity and market depth. Table 5 Transaction Costs MP-CAPM Segment Small Cap Medium Cap Large Cap Overall Portfolio
Total Transactions Commissions and Fees bps Spread bps Costs bps 10 47 57 10 29 39 10 11 21 10 28 38
Table 5 represents an analysis of transaction costs attributed between commissions and fees, and spread for the various segments of the portfolio. As explained above the lower level of transaction costs for the large cap portfolio results from the significantly higher levels of liquidity and high market depth of orders involved in the optimization under the MP-CAPM model. 6.2 Time Varying Analysis Table 6, panels A and B below represent the MP-CAPM after transaction cost alphas using 3 month and 6 month portfolio rebalancing respectively. These alphas were calculated to ascertain the impact on returns of a less frequent portfolio rebalancing. As expected, the after transaction cost returns of both 3 month and 6 month rebalancing, significantly outperformed the market portfolio by 223bps and 291bps respectively. 54
Mazzola & Gerace | A Comparison Between Dynamic and Static Approach to Asset Management
Table 6 Panel A: 3 Months MP-CAPM Alphas Set_year 2001 2002 2003 2004 2005 2006 2007 2008 2009 Average
3-Mth_MPCAPM_Alphas -0.09% 0.52% 2.42% 3.42% 3.42% 1.62% 3.42% -0.89% 6.42% 2.23%
Panel B: 6 Months MP-CAPM Alphas versus CAPM Alphas Set_year 2001 2002 2003 2004 2005 2006 2007 2008 2009 Average
6-Mth_MPCAPM_Alphas -0.37% 0.96% 4.09% 4.73% 5.74% 2.89% 4.39% -1.89% 5.65% 2.91%
7. Conclusion The lack of existing empirical research on Merton’s model in the Australian market was one of the main factors that prompted this empirical study. This study is merely based on the key assumption given by ICAPM that any rational investor would prefer to revise their portfolio as new information becomes available (Merton 1973]. Comparison between a dynamic and a static portfolio has been conducted in accordance with a maximisation problem approach where multiple period investment-consumption decisions are expected to be superior to a single-period utility function (Fama 1970, Elton and Gruber 1974a, and Elton and Gruber 1974b]. Following Stoll and Whaley (1983], this paper takes into account transaction costs, which have been shown to have a significant impact on short investment horizons by reducing CAPM’s returns. 55
Mazzola & Gerace | A Comparison Between Dynamic and Static Approach to Asset Management
The first step was to build a set of alphas without considering transaction costs; specifically one is produced using multi-period CAPM alphas on a weekly based rebalancing, labelled MP-CAPM, while the other was produced using a single-period CAPM. This was followed by determining alphas after accounting for transaction costs. Further tests were undertaken to check the validity of preliminary results by splitting the main sample into three segments according to market capitalisation, followed by a rebalancing using different time intervals. As expected by optimizing a portfolio through the process of rebalancing on a regular basis in response to market changes, a superior return is produced compared to a portfolio that was optimised at the commencement of the time period, without accounting for transaction costs. However once transaction costs are incurred, returns are impacted. The total portfolio returns after transaction costs underperformed the benchmark given the impact of transaction costs. The magnitude of this impact was greater for small and mid-cap stocks, when compared to large-cap stocks, in view of the smaller spreads associated with the large-cap stocks due to that segment’s higher liquidity and market depth. Results improve when testing the robustness of preliminaries. A less frequent portfolio rebalancing significantly outperformed the weekly balanced portfolio as well as the benchmark, concluding that a multiple period model is superior regardless of transaction costs. Future studies could involve a breakeven analysis to determine the optimal time period between rebalancing after taking into account transaction costs.
References Rolf W. Banz. The relationship between return and market value of common stocks. Journal of Financial Economics, 9(1):3 – 18, 1981. ISSN 0304-405X. Fischer Black. Capital market equilibrium with restricted borrowing. The Journal of Business, 45(3):444–455, 1972. ISSN 00219398. Fischer Black and Robert Litterman. Global portfolio optimization. Financial Analysts Journal, 48(5):28–43, 1992. Bodie, M Ari, R da Silva Rosa, A Kane, and A Marcus. Investments. McGraw-Hill Irwin, 2007. ISBN 9780074716946. Bawa, 1975, V.S. Bawa, Optimal rules for ordering uncertain prospects, Journal of Financial Economics, 2 (1975), pp. 95–121. Gary P. Brinson, L. Randolph Hood, and Gilbert L. Beebower, Determinants of Portfolio Performance, The Financial Analysts Journal, July/August 1986 Gaither, Chris; Chmielewski, Dawn C. (July 16, 2006). "Fears of Dot-Com Crash, Version 2.0". Los Angeles Times. Retrieved March 9, 2013.
56
Mazzola & Gerace | A Comparison Between Dynamic and Static Approach to Asset Management
John Y. Campbell. Stock returns and the term structure. Journal of Financial Economics, 18(2):373 – 399, 1987. ISSN 0304-405X. Ray Yeutien Chou. Volatility persistence and stock valuations: Some empirical evidence using garch. Journal of Applied Econometrics, 3(4): 279–94, October-D 1988. Edwin J. Elton and Martin J. Gruber. The multiple period consumption investment problem and single period analysis. Oxford Economic Papers, 26(2): 289–301, 1974a. ISSN 00307653. Edwin J. Elton and Martin J. Gruber. Finance as a dynamic process [by] Edwin J. Elton [and] Martin J. Gruber. Prentice-Hall Englewood Clis, N.J., 1974b. ISBN 0133146901 0133146820. Brown. S Goetzmann. W Elton. E, Gruber. M. Modern Portfolio Theory And Invesment Analysis. John Wiley, seventh edition, 2007. ISBN 0470050829. Robert Faff and Howard Chan. A test of the intertemporal capm in the Australian equity market. Journal of International Financial Markets, Institutions and Money, 8(2):175 – 188, 1998. ISSN 1042-4431. http://dx.doi.org/10.1016/S1042-4431(98)00026-2 Eugene F. Fama. Multiple period consumption-investment decisions. The American Economic Review, 60(1):163–174, 1970. ISSN 00028282. Eugene F. Fama and Kenneth R. French. The cross-section of expected stock returns. The Journal of Finance, 47(2):427–465, 1992. ISSN 00221082. Eugene F. Fama and Kenneth R. French. Common risk factors in the returns on stocks and bonds. Journal of Financial Economics, 33(1): 3 – 56, 1993. ISSN 0304-405X. Eugene F. Fama and Kenneth R. French. Multifactor explanations of asset pricing anomalies. The Journal of Finance, 51(1):55–84, 1996. ISSN 00221082. Lawrence R. Glosten and Paul R. Milgron. Bid, Ask and Transaction Prices in a Specialist Market with Heterogeneously Informed Traders. Journal of Financial Economics, 14:71100, 1985. ISSN 0304.405X Irwin Friend, Yoram Landskroner, and Etienne Losq. The demand for risky assets under uncertain inflation. The Journal of Finance, 31(5):1287–1297, 1976. ISSN 00221082. Deepak Gupta. Empirical testing of strong form of market efficiency. Asia-Pacific Business Review, 4(3):53, 2008. ISSN 0973-2470. John Lintner. The valuation of risk assets and the selection of risky investments in stock portfolios and capital budgets. Review of Economics and Statistics, 47:13–37, 1965. http://dx.doi.org/10.2307/1924119 Sydney C. Ludvigson and Serena Ng. The empirical risk-return relation: A factor analysis approach. Journal of Financial Economics, 83(1):171 – 222, 2007. ISSN 0304-405X. Harry Markowitz. Portfolio selection. The Journal of Finance, 7(1):77–91, 1952. ISSN 57
Mazzola & Gerace | A Comparison Between Dynamic and Static Approach to Asset Management
00221082. John G. McDonald and Bruno H. Solnick. Valuation and strategy for gold stocks. Journal of Portfolio Management, 3(3):29 – 33, 1977. ISSN 00954918. Robert C. Merton. Optimum consumption and portfolio rules in a continuous-time model. Journal of Economic Theory, 3(4):373 – 413, 1971. ISSN 0022-0531. Robert C. Merton. An intertemporal capital asset pricing model. Econometrica, 41(5):867– 887, 1973. ISSN 00129682. Jonas Mockus and Aistis Raudys. On the efficient-market hypothesis and stock exchange game model. Expert Systems with Applications, 37(8):5673 – 5681, 2010. ISSN 09574174. doi: DOI:10.1016/j.eswa. 2010.02.043. Richard Roll. A critique of the asset pricing theory’s tests part i: On past and potential testability of the theory. Journal of Financial Economics, 4(2):129 – 176, 1977. ISSN 0304-405X. Jack L. Treynor and Fischer Black. How to use security analysis to improve portfolio selection. The Journal of Business, 46(1):66–86, 1973. ISSN 00219398. URL http://www.jstor.org/stable/2351280. Jason Zweig. the intelligent investor:’rebalancing’ your portfolio can be a tough ride..Wall Street Journal, 2009.
58