growth featuring a well-ventilated (i.e., fuel limited) fire and a hot smoke layer that develops near the ... developed fire dynamics featuring a ventilation-controlled (i.e., air limited) fire. The ... Typical values of the lower oxygen index are. 10-15% ...
A Comparison between Observed and Simulated Flame Structures in Poorly Ventilated Compartment Fires ZHIXIN HU1, YUNYONG UTISKUL2, JAMES G. QUINTIERE1, and ARNAUD TROUVE1 1 Department of Fire Protection Engineering 2 Department of Mechanical Engineering University of Maryland College Park, MD 20742 U.S.A. ABSTRACT This study is aimed at characterizing the dynamics of compartment fires under poorly ventilated conditions. The study considers four cases that correspond to different values of the fire room global equivalence ratio and are representative of strikingly different flame behaviors. The study is based on a detailed comparison between experimental and computational data. The numerical simulations are performed with the Fire Dynamics Simulator (FDS) developed by the National Institute of Standards and Technology, USA. The comparative tests serve to evaluate the general ability of FDS to describe the transition from over- to under-ventilated fire conditions, as well as the transition from extinction-free conditions to conditions in which the flame experiences partial or total quenching. KEYWORDS: compartment fires, under-ventilated combustion, air vitiation, flame extinction, unstable combustion INTRODUCTION The development of a fire in a building compartment generally goes through a succession of stages, from pre-flashover to post-flashover fire conditions, and a basic understanding of these individual stages is a key ingredient that determines our general predictive capability for fire spread [1] and carbon monoxide emissions [2] in buildings, as well as our ability to mitigate against these fire hazards. A typical enclosure fire scenario involves the following successive stages: (A) ignition and early growth; (B) pre-flashover growth featuring a well-ventilated (i.e., fuel limited) fire and a hot smoke layer that develops near the compartment ceiling; (C) flashover that corresponds to a dramatic increase in the amount of burning liquid/solid materials; (D) post-flashover, fullydeveloped fire dynamics featuring a ventilation-controlled (i.e., air limited) fire. The focus of the present study is the near- or post-flashover stages of a compartment fire. Near- or post-flashover stages in enclosure fires exhibit unique features associated with smoke accumulation and restricted air ventilation. In typical large fire situations, the smoke layer spreads over most of the compartment volume, so that large sections of the flame are supplied with vitiated air, i.e., a mixture of pure air and re-circulating combustion products. Air vitiation results in global and local modifications of the flame structure. For instance, if the global equivalence ratio (GER) in the fire room becomes larger than unity, the flame may experience a dramatic change and migrate from the fuel source to the compartment vents location. This transition is similar to the flame opening process observed in Burke-Schumann-type laminar diffusion flames when going from over- to under-ventilated conditions [3,4]. FIRE SAFETY SCIENCE–PROCEEDINGS OF THE EIGHTH INTERNATIONAL SYMPOSIUM, pp. 1193-1204 COPYRIGHT © 2005 INTERNATIONAL ASSOCIATION FOR FIRE SAFETY SCIENCE
1193
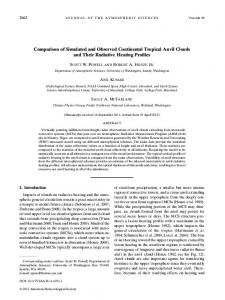
In addition to these global effects, air vitiation also affects the local values of the flame burning intensity. As discussed in Ref. [5], air vitiation has the double effect of changing the oxidizer stream composition (a dilution effect) as well as its temperature (a preheating effect). The dilution effect has a negative impact on the flame burning rate, whereas the preheating effect has a positive effect. Due to inherent heat losses in the compartment system, the dominant effect is that of dilution and the net effect of air vitiation is to decrease the burning rate. Sufficient levels of air vitiation will result in subcritical oxygen concentrations and consequent flame extinction. The issue of flame extinction is also related to that of incomplete combustion. In hood or compartment fire experiments, products of incomplete combustion (carbon monoxide, hydrogen, unburnt hydrocarbons) are observed for sufficiently large degrees of air vitiation [2,6-8], typically when the GER in the fire room is above 0.5, or equivalently when the oxygen mass fraction in the bulk region of the ceiling layer is below a critical value called the lower oxygen index. Typical values of the lower oxygen index are 10-15% and depend on fuel type [9,10]. The presence of products of incomplete combustion in the ceiling layer may be explained by flame extinction phenomena occurring in some sections of the flame. These local extinction events may lead in turn to oscillatory combustion or total flame extinction. The objective of the present study is to characterize air vitiation effects and the dynamics of enclosure fires under poorly ventilated conditions. The approach consists in analyzing a previously developed experimental database [11,12] and in performing detailed comparisons with a newly developed numerical simulation database. The numerical simulations are performed using an advanced Computational Fluid Dynamics solver called the Fire Dynamics Simulator (FDS). FDS is developed by the National Institute of Standards and Technology, USA, and is oriented towards fire applications; it uses a Large Eddy Simulation approach (and the classical Smagorinsky model) for turbulence and an equilibrium-chemistry (i.e., fast chemistry), mixture-fraction-based model for combustion and soot formation [13,14]. EXPERIMENTAL CONFIGURATION The experimental set-up corresponds to a scaled-down cubic-shaped compartment that communicates to the exterior through an adjustable wall vent arrangement (Fig. 1). The compartment size is (40×40×40) cm3. The wall vent arrangement consists of two vents of equal size located at the top and bottom of one of the compartment vertical walls. The vents width varies between 2 and 40 cm; the vents height varies between 1 and 3 cm. The compartment walls are made of type-M Kaowool® board and are 2.54 cm thick. One side wall is equipped with a viewing glass window and allows for direct flame observation. The fire is fueled by a round-shaped heptane pool located at the center of the compartment floor. The fuel pans are modified Pyrex® glass containers of different size, with diameters ranging from 6.5 to 19 cm. The compartment instrumentation includes a load cell system, an array of 19 thermocouples, 4 heat flux gauges, 2 pressure transducers, and a gas analysis system (Fig. 1). The load cell is installed below the fuel pan and is used to monitor total fuel mass consumption, thereby providing the time history of the fuel mass loss rate (MLR); the load cell data are corrected for pressure variations inside the compartment. Thermocouples are used to monitor gas temperatures at various locations, including near the compartment floor and ceiling; note that the thermocouples data are not corrected for radiation losses. Heat flux gauges are used to quantify the thermal feedback to the 1194
heptane pool, as well as the heat transfer to the inert wall surfaces; the gauges are watercooled. Pressure transducers are used near the top and bottom vents, thereby providing an estimate of the flow rates across the vents. Gas sampling probes are installed near the compartment floor and ceiling, and are used to monitor the concentrations of important chemical species, such as oxygen, carbon dioxide and carbon monoxide; the gas analysis data are time-corrected for the delays associated with sampling and detection. Inner Size: 40x40x40 cm3
Heat Flux Gauge Adjustable Back Wall
Top Vent Upper Gas Tube
Heat Flux Gauge Back Wall Thermocouples
Front Wall Thermocouples Lower Gas Tube Bottom Vent Stand to Load Cell with Water Seal
Center Thermocouple Heat Flux Gauge Heat Flux Gauge Fuel Pan
Fig. 1. Schematic half-view of the experimental configuration. A wide variety of flame behaviors is observed in the experimental database, as reported in Refs. [11,12]. These flame behaviors are analyzed in the following and are assumed to belong to one of the following four categories: (R1) steady well-ventilated fires in which the flame is stabilized above the burner; (R2) steady under-ventilated fires in which the flame is stabilized near the vents; (R3) unsteady under-ventilated fires featuring large periodic oscillations and temporary flame quenching; (R4) unsteady under-ventilated fires leading to complete flame extinction. Note that this classification is slightly different from the one proposed in Refs. [11,12]. The main parameter that controls transition from one flame regime to the other has previously been identified as being a non-dimensional ventilation parameter that can be directly related to the fire room GER noted φ. In short, regime R1 corresponds to small values of φ; regime R4 to large values of φ; and regimes R2 and R3 to intermediate, near-stoichiometric values. The value of GER alone is not sufficient to differentiate between the domains of occurrence of regimes R2 and R3. One important result from Refs. [11,12] is that the effect of the compartment always seems dominant. The enclosure effect accounts for either increased or reduced values of the fuel MLR (MLR is here compared to its reference open-burn value): increased values are due to the formation of a hot ceiling layer and to the resulting enhanced thermal feedback; reduced values are due to limited ventilation and oxygen starvation. We consider in the following four particular cases from the experimental database (see Table 1). These cases differ due to variations in vent size and fuel surface area; each case is believed to be representative of one of the four flame regimes introduced above. The figure in parenthesis in the third column of Table 1 gives the equivalent (square-shaped) fuel source dimension used in the FDS simulations (see below). Table 1. Ventilation and fuel source parameters in cases 1-4. 1195
Case
Venta Heightb × Widthb
1
3 × 40
9.5 (8)
R1
2
1 × 40
19 (16)
R2
3
3 × 10
9.5 (8)
R3
Fuel Pan Diameterb
1×2 9.5 (8) 4 Single vent dimensions; multiply by 2 to get the total venting area b In units of cm
Flame Regime
R4
a
NUMERICAL CONFIGURATION The calculations are performed using FDS, Version 4.0 [13]. The computational domain corresponds to the fire compartment, as described in Fig. 1, plus a portion of the air space adjacent to the compartment front wall. The extension of the computational domain beyond the fire compartment is motivated by the desire to maintain adequate computational accuracy in the simulated vent flow regions and to avoid treating the vents as numerical boundary conditions. Comparisons between calculations performed with and without an extended domain indicate, however, that the improvements in the numerical solution remain somewhat marginal (as discussed below, the computational accuracy in the vent flow regions remains marginal because of both insufficient grid resolution and the absence of a proper representation of the vented wall thickness). The computational domain is decomposed into two non-overlapping blocks corresponding to the fire compartment and to the adjacent exterior air space. In cases 1, 3, and 4, the two blocks have the same dimensions equal to (40×40×40) cm3. In contrast, in case 2, the air block is made 4 times larger and has a size equal to (40×80×80) cm3. The computational grid in the fire compartment block corresponds to a uniform rectangular mesh; the mesh size is (40× 40× 40), which corresponds to cubic grid cells with a 1 cm3 volume. In cases 1, 3, and 4, the computational grid in the air block is also uniform and uses the same 1 cm3 grid resolution. In case 2, the computational grid in the air block is stretched and designed to match the compartment block 1 cm3 grid resolution at the vent locations. Simulations are performed either on a single- or a multi-processor Linux machine; the latter case uses the parallel MPI-based version of FDS [13]. Several simplifications are made in the present FDS simulations. First, the heptane pool geometry is treated as square-shaped. The choice of a square geometry is explained by the rectangular grid framework adopted in FDS and by the desire to avoid the difficulties found in a FDS treatment of curved boundaries. The third column of Table 1 gives the equivalent source dimension used in the FDS square-shaped representation of the fuel pan. With our choice of grid resolution, the resulting error in fuel source surface area is approximately 10%. Note that no attempt has been made to correct for this discrepancy. Another difference between the experimental and numerical configurations is found in the description of the compartment vents. While, as seen in Fig. 1, the experimental vent geometry corresponds to a flow passage section that is 2.54 cm thick, the numerical vent geometry corresponds to a razor-thin flow passage section, treated as having zero thickness. This simplification is deemed acceptable here and may be removed in future work. Note that an accurate description of the vent flow passage section would also require a finer computational grid than that used in the present simulations. Finally, the FDS calculations for cases 1-4 are performed twice. The two runs correspond to two different treatments of the fuel mass loss rate: a prescribed-MLR treatment in 1196
which the time history of MLR is directly taken from the experimental database and treated as an input variable; a computed-MLR treatment in which the MLR is calculated from the gas-to-pool thermal feedback and treated as a solution variable. In the following, numerical simulations performed with a prescribed-MLR treatment are identified with an extra letter P (cases 1P-4P), whereas simulations performed with a computed-MLR treatment are identified with an extra letter C (cases 1C-4C). In cases 1C-4C, the fuel pyrolysis is initiated using a removable pilot-flame-like ignition device corresponding to a 4.8 kW flame, sustained for a duration of 5 seconds, over a 16 cm2 area centrally located above the heptane pool surface. We now turn to a brief evaluation of the quality of the selected grid resolution. We start by considering the ability of the computational grid to resolve the geometrical features of the fire compartment. The only two features of interest here are the fuel pan and the vents. The numerical fuel source area is 64 or 256 cm2 (Table 1); and with our choice of grid resolution, the corresponding footprint on the compartment floor is described by 64 or 256 grid cells. This number is large and the resolution of the fuel source is therefore rated as good. The description of the vents is clearly much less satisfactory. For instance, the vents height may be as small as 1 cm (cases 2 and 4 in Table 1), which corresponds to the dimension of a single computational grid cell. This simplification is deemed acceptable at the present stage but it is worth emphasizing again that in the present simulations, the resolution of the vents is marginal. Next, we consider the ability of the computational grid to resolve the expected flame structure. The fire size in cases 1-4 takes values on the order of a few thousand Watts; and the flame length varies between 10 and 20 centimeters, which corresponds to the dimension of 10 to 20 grid cells. This number is reasonably large and the resolution of the flame is therefore rated as fair. The simulations use the standard default options proposed in FDS, with two exceptions. The first exception is related to the heat of vaporization of the fuel. While the thermodynamic value of the heat of vaporization for heptane is approximately equal to 0.45 MJ/kg, the apparent heat of vaporization evaluated from the experimental load cell and heat flux data gives a significantly higher value, close to 1.4 MJ/kg (this value is obtained as the ratio of the net gas-to-pool-surface heat flux divided by the fuel mass loss rate). This higher value may be interpreted as an effective heat of gasification that accounts for unresolved physics, such as: heat losses to the water sub-layer and to the fuel container walls, possible convective motion inside the liquid pool, semi-transparent radiation transport inside the liquid fuel layer, etc. In the present FDS simulations, we choose to use the experimentally-determined effective heat of vaporization. The second exception to using default options is related to the FDS flame extinction model: in the present study, this model has been deactivated. The extinction model is intended to represent air vitiation and flame quenching effects under poorly ventilated fire conditions [13]. While these phenomena are clearly an important part of the observed flame dynamics (see the discussion of the results below) and are in fact central to the present study, the current version of the extinction model is viewed as a temporary expedient that awaits further scrutiny and developments. Instead of focusing on a discussion of the proposed FDS flame extinction model, we adopt in the following a slightly different perspective and choose to work with the original, equilibrium-chemistry (extinction-free) FDS combustion model [14]. Our objective in this strategy is to deliberately allow for areas of discrepancies between numerical results and experimental
1197
data, and to try to interpret those discrepancies in terms of the neglected air vitiation and flame extinction physics. RESULTS We start our discussion with case 1 and compare the experimental data to the FDS-based prescribed–MLR computational results obtained in case 1P (Fig. 2). Case 1 is representative of regime R1 in which the combustion is fuel-limited and the flame is stabilized above the fuel source; turbulent fluctuations account for a certain level of unsteadiness but the flame behavior is essentially stable. Fig. 2a indicates that the fuel mass loss rate per unit surface area fluctuates around 20 g/s/m2; this value is about twice as large as the estimated open-burn value (we refer the reader to Refs. [15,16] for a discussion of methods and input data used to evaluate open-burn values of MLR for small heptane pool fires), which suggests that in regime R1, the net effect of the compartment is to increase the rate of combustion. Note that the total mass of heptane used in case 1 is 45 g, and that given the observed value of MLR, it takes approximately 320 s to consume all the fuel. Figure 2b presents the time variations of the mass flow rates across the upper and lower compartment vents. The experimental curves are based on pressure transducers data combined with temperature readings and Bernoulli theory. The agreement between experimental and computational data is excellent, and the implication is that despite the approximations made in the numerical treatment of the vents, the mass exchange between the compartment and the exterior appears to be correctly described in the simulations. Using the data presented in Figs. 2a-b, the fire room GER may now be evaluated as φ = (rs / YO 2,a ) × (m& f / m& a ) , where rs is the stoichiometric oxygen-to-heptane mass ratio, rs ≈ 3.52; YO2,a the oxygen mass fraction in ambient air, YO2,a ≈ 0.233; m& f the total fuel
MLR, m& f ≈ 0.14 g/s ; and m& a the air mass flow rate though the lower compartment vent, m& a ≈ 10 g/s . We find φ ≈ 0.2, which quantifies the amount of excess air still present in case 1.
Figure 2c presents the time variations of the oxygen mole fraction at points located near the compartment floor and ceiling. The observed differences between the floor and ceiling data are consistent with the classical two-layer structure of the compartment gas, in which a ceiling layer, filled with combustion products and air, lies above a fresh air floor layer. The agreement between experimental and computational data is very good, which shows that the simulations are capable of successfully reproducing the mixing patterns and room stratification that are observed under over-ventilated fire conditions. Figure 2d presents an instantaneous snapshot of mixture fraction taken from the FDS solution. The snapshot is taken at an arbitrarily chosen time and the isocontours are plotted in a central vertical plane of the compartment that cuts through the fuel pan and the vents. The stoichiometric isocontour (Zst ≈ 0.062) may be used to identify the flame location in this plot: in Fig. 2d, this contour lies at the interface between the black and light gray regions. The flame features a classical cone-like shape, and is attached to the fuel pan and deflected towards the back wall.
1198
(a)
(b)
(c)
(d)
Fig. 2. Comparison between experimental data (dashed lines) and FDS data (solid lines). Case 1P: (a) Fuel mass loss rate; (b) Vent flow rates (upper and lower vents); (c) Oxygen mole fraction (near floor and ceiling); (d) FDS-based isocontour plot of mixture fraction in the compartment central vertical plane. We now turn to case 2 (Fig. 3). Compared to case 1, the vent area in case 2 is decreased by a factor three, whereas the fuel source area is increased by a factor four. A first rough estimate is that this change will lead to a twelve-fold increase in the fire room GER and that the fire will switch to an under-ventilated regime. This is indeed the case and case 2 is representative of regime R2 in which the combustion becomes oxygen-limited and the flame is stabilized near the compartment vents. Figure 3a indicates that the fuel mass loss rate per unit surface area fluctuates around 25 g/s/m2; this value is about 30% larger than the estimated open-burn value but note that due to the change in flame structure, the comparison to the open-burn value has now limited validity. Figure 3b presents the vent flow rates data. The agreement between experimental and computational data is not as good as that obtained in case 1, but remains fair. Using the data presented in Figs. 3a-b, the fire room GER may now be evaluated as φ = (rs / YO 2, a ) × (m& f / m& a ) = (3.52 / 0.233) × (0.7 / 3) ≈ 2.6 , which quantifies the amount of excess fuel now present in case 2. Figure 3c presents the oxygen mole fraction data. A finite level of stratification between the floor and ceiling is clearly maintained. The agreement between experimental and computational data is fair, and both sets of data indicate that the upper layer is now fuelrich and fully depleted of oxygen, as expected for under-ventilated fire conditions.
1199
(a)
(b) 0.4
z (m)
0.3
0.2
0.3 0.28 0.26 0.24 0.22 0.2 0.18 0.16 0.14 0.12 0.1 0.08 0.06
0.1
0 -0.2
-0.1
0
x (m)
(c)
(d)
Fig. 3. Case 2P, see caption of Fig. 2 for details.
(a)
(b)
(c)
(d)
Fig. 4. Case 3P, see caption of Fig. 2 for details.
1200
0.1
0.2
Figure 3d presents an isocontour plot that is similar to Fig. 2d, with the difference that a different range of isolevels has been selected. In Fig. 3d, the stoichiometric flame contour lies at the interface between the white and dark gray regions. It is seen that the flame now stands away from the fuel pan and in the proximity of the air stream coming in through the lower vent. The excess fuel that does not burn at the flame, and escapes the fire compartment at the upper vent, burns outside in the adjacent air space. Next we turn to case 3 (Fig. 4). Compared to case 1, the vent area in case 3 is decreased by a factor four, whereas the fuel source area is unchanged. A first rough estimate is that this change will lead to a four-fold increase in the fire room GER and that the fire will be near-stoichiometric. This is indeed the case, but a more remarkable result from the experimental database is that the combustion becomes unstable (the instability frequency is close to 1 Hz). Case 3 is representative of regime R3 in which the combustion features large oscillations and periodic flame extinction and re-ignition events. Figure 4a indicates that the fuel mass loss rate per unit surface area continuously increases up to around 30 g/s/m2; this value is about three times larger than the estimated open-burn value, which suggests that in regime R3, the net effect of the compartment is also to increase the rate of combustion (and this despite periodic flame extinction events). Figure 4b presents the vent flow rates data. The agreement between experimental and computational data is good as far as time-averaged values are concerned, but the FDS simulation clearly fails to reproduce the large flow rate oscillations observed in the experiment (the oscillations at the lower vent are so large that the flow is found to alternate between inflow and outflow conditions). Using the data presented in Figs. 4a-b, the fire room GER may now be evaluated as φ = (rs / YO 2,a ) × (m& f / m& a ) = (3.52 / 0.233) × (0.21 / 3) ≈ 1 , which confirms the nearstoichiometric conditions of case 3. Figure 4c presents the oxygen mole fraction data. The experimental curves show little difference between the floor and ceiling data and suggest that a transition to a well-mixed single-layer structure of the compartment gas has occurred. Both experimental and computational curves agree on predicting very low levels of oxygen in the smoke layer. Thus, it appears that the FDS solution in case 3P correctly reproduces many of the global time-averaged features found in the experiment. The main discrepancy lies in the fact that while the experimental flame is unstable, the numerical flame remains stable. Figure 4d shows that the flame (identified as the interface between the black and light gray regions) is attached to the fuel pan and deflected towards the back wall. This picture suggests that in case 3P, the combustion remains fuel-limited. Next we turn to case 4 (Fig. 5). Compared to case 1, the vent area in case 4 is decreased by a factor equal to sixty, whereas the fuel source area is unchanged. A first rough estimate is that this change will lead to a sixty-fold increase in the fire room GER and that the fire will become ultra-rich. These ultra-rich conditions are not observed, however, because the flame extinguishes prior to reaching them. Case 4 is representative of regime R4 in which the combustion experiences complete extinction. Figure 5a indicates that the fuel MLR abruptly decreases at time t = 40 s. Prior to extinction, the fuel mass loss rate per unit surface area fluctuates around 10 g/s/m2; this value is approximately equal to the estimated open-burn value.
1201
(a)
(b) 0.4
z (m)
0.3
0.0625 0.0575 0.0525 0.0475 0.0425 0.0375 0.0325 0.0275 0.0225 0.0175 0.0125 0.0075 0.0025
0.2
0.1
0 -0.2
-0.1
0
0.1
0.2
x (m)
(c)
(d)
Fig. 5. Case 4P, see caption of Fig. 2 for details. Figure 5b presents the vent mass flow rates data. The agreement between experimental and computational data is good and both data sets capture the short transient period that occurs immediately after extinction: this transient period corresponds to a sudden pressure drop inside the fire compartment and a subsequent inflow of air, both through the lower and upper vents. While the data presented in Figs. 5a-b may be used to evaluate the fire room GER, this estimate would lead to a large over-estimation of φ at the time of extinction. This is due to the transient nature of the fire dynamics; for instance, given the compartment size and using the value of MLR in Fig. 5a, one can show that a characteristic time to deplete the fire room of the initial oxygen mass present prior to ignition is on the order of 70 s. This suggests that at time t = 40 s, the fire room GER will be much less than its steady state value. The data are consistent with this picture and it is estimated that at extinction time, φ ≈ 1. Figure 5c presents the oxygen mole fraction data. The experimental curves show little difference between the floor and ceiling data and suggest that a well-mixed single-layer structure has been established, similar to that observed in case 3; this structure is reproduced in the FDS simulation. The experimental curves also suggest that flame extinction occurs when the oxygen mole fraction in the fire room is close to 15%. Flame extinction is not simulated in the FDS calculation and the oxygen mole fraction keeps decreasing to almost zero (the zero value marks transition to an under-ventilated regime). We now turn to the FDS data obtained with the computed–MLR treatment; in this treatment, the fire size is now part of the solution. It may be argued that a good prediction of MLR is sufficient to produce good predictions of the overall structure of the compartment fire dynamics. This assumption is in fact implicitly tested in the data presented in Figs. 2-5. The discussion above suggests that while the assumption is 1202
essentially valid in cases 1 and 2, it fails to apply to cases 3 and 4. In cases 3-4, significant discrepancies between experimental and numerical data are observed, even though the MLR is prescribed to its correct experimental value. These discrepancies are associated with the occurrence of flame extinction phenomena. While not shown here, the MLR levels predicted by FDS in cases 1C and 2C are in good agreement with the experimental data presented in Figs. 2a-3a. Figure 6 presents the MLR results for cases 3C and 4C. In case 3C, the FDS predictions are poor, with MLR values being in error by more than 50%. The results in case 4C are more satisfactory, in particular with regard to the finding that despite the absence of a flame extinction modeling capability, the simulation clearly captures some of the underlying physics and features a gradual decrease of MLR, which may be interpreted as a slow transition to an asymptotic extinction regime.
(a)
(b)
Fig. 6. Time variations of the fuel mass loss rate: experimental data (dashed line) and FDS data (solid line): (a) case 3C; (b) case 4C. CONCLUSION
This study presents a detailed comparison between experimental and computational data aimed at characterizing the dynamics of compartment fires under poorly ventilated conditions. The study considers four cases that are representative of four different flame behaviors, i.e., steady over-ventilated fires, steady under-ventilated fires, unstable fires with partial flame quenching, transient fires leading to total flame quenching. The numerical simulations are performed with the Fire Dynamics Simulator. Overall, the agreement between experimental and computational results is good, except for the cases that involve flame quenching. Ongoing work is now aimed at testing and modifying the FDS flame extinction modeling capability. ACKNOWLEDGMENTS
This work is supported by the U.S. National Institute of Standards and Technology, Building and Fire Research Laboratory (Grant No. 60NANB3D1103). Interactions with our contract monitors, A. Hamins and K. McGrattan, are gratefully acknowledged. REFERENCES
[1]
Quintiere, J.G., “Fire Behavior in Building Compartments,” Proceedings of the Combustion Institute, 29, pp.181-193, 2002.
1203
[2]
[3]
[4]
[5] [6]
[7] [8]
[9]
[10]
[11]
[12]
[13]
[14]
[15] [16]
1204
Pitts, W.M., “The Global Equivalence Ratio Concept and the Formation Mechanisms of Carbon Monoxide in Enclosure Fires,” Progress in Energy and Combustion Science, 21, pp.197-237, 1995. Leonard, S., Mulholland, G.W., Puri, R., and Santoro, R.J., “Generation of CO and Smoke during Underventilated Combustion,” Combustion and Flame, 98, pp. 20-34, 1994. Tolocka, M.P., Richardson, P.B., and Miller, J.H., “The Effect of Global Equivalence Ratio and Postflame Temperature on the Composition of Emissions from Laminar Ethylene/Air Diffusion Flames,” Combustion and Flame, 118, pp. 521-536, 1999. Quintiere, J.G., and Rangwala, A.S, “A Theory of Flame Extinction Based on Flame Temperature,” Fire and Materials, 28, pp. 387-402, 2003. Beyler, C.L., “Major Species Production by Solid Fuels in a Two-Layer Compartment Fire Environment,” Fire Safety Science – Proceedings of the First International Symposium, Hemisphere Publishing Corporation, 1986, pp. 431440. Tewarson, A., “Ventilation Effects on Combustion Products,” Toxicology 115, pp. 145-156, 1996. Gottuk, D.T., and Lattimer, B.Y., “Effect of Combustion Conditions on Species Production,” The SFPE Handbook of Fire Protection Engineering, National Fire Protection Association (3rd ed.), pp. 2/54-2/82, 2002. Mulholland, G., Janssens, M., Yusa, S., Twilley, W., and Babrauskas, V., “The Effect of Oxygen Concentration on CO and Smoke Produced by Flames,” Fire Safety Science – Proceedings of the Third International Symposium, Elsevier Science Publishers, pp. 585-594, 1991. Morehart, J.H., Zukoski, E.E., and Kubota, T., “Chemical Species Produced in Fires Near the Limit of Flammability,” Fire Safety Journal, 19, pp. 177-188, 1992. Utiskul, Y., Quintiere, J.G., and Naruse, T., “Wall-Vent Compartment Fire Behavior under Limited Ventilation,” Proceedings of the Tenth International Interflam Conference, InterScience Communications, pp. 105-116, 2004. Utiskul, Y., Quintiere, J.G, Rangwala, A.S, Ringwelski, B.A., Wakatsuki, K., and Naruse, T., “Compartment Fire Phenomena Under Limited Ventilation,” Fire Safety Journal, submitted for publication, 2004. McGrattan, K. B., “Fire Dynamics Simulator (Version 4). Technical Reference Guide,” National Institute of Standards and Technology NIST, Special Publication 1018, Gaithersburg, MD, 2004. McGrattan, K., Floyd, J., Forney, G., Baum, H., and Hostikka, S., “Improved Radiation and Combustion Routines for a Large Eddy Simulation Fire Model,” Fire Safety Science – Proceedings of the Seventh International Symposium, International Association for Fire Safety Science, pp. 827-838, 2003. Karlsson, B., and Quintiere, J.G., Enclosure Fire Dynamics, CRC Press, pp. 3234, 2000. Babrauskas, V., “Heat Release Rates,” The SFPE Handbook of Fire Protection Engineering, National Fire Protection Association (3rd ed.), pp. 3/25-3/26, 2002.