356
IEEE TRANSACTIONS ON POWER SYSTEMS, VOL. 26, NO. 1, FEBRUARY 2011
A Comparison of Different Frequency Scanning Methods for Study of Subsynchronous Resonance Nicklas Johansson, Student Member, IEEE, Lennart Ängquist, Member, IEEE, and Hans-Peter Nee, Senior Member, IEEE
Abstract—This paper compares four different methods for determining the electrical damping of a power system seen from one generator as a function of frequency. This information is useful when the risk for subsynchronous resonance (SSR) in the system is evaluated. The study compares one frequency scanning method which is implemented in a time-domain digital simulation program with three methods of different complexity based on analytical calculations. The time-domain simulation method is easily implemented with a detailed model of the power system including complex load and generator models, whereas the analytical methods are based on simpler models of the power system. The computational effort is much larger for the time-domain method than for the analytical methods. In the study, all methods were used to determine the damping characteristics of a four-machine power system in different configurations. The study shows that fast analytical methods may provide results which closely agree with the detailed method of time-domain simulation. However, the study also shows that the level of accuracy in the analytical model is very important. Index Terms—Frequency scanning, subsynchronous oscillations, subsynchronous resonance (SSR), torsional interaction.
I. INTRODUCTION
UBSYNCHRONOUS resonance (SSR) is a phenomenon where the electrical power system exchanges significant oscillating energy with the mechanical turbine-generator system of a particular generator in the system. It occurs when capacitive series compensation in a power system with a synchronous fresuch that quency yields an electrical resonance frequency the complementary frequency closely matches a resonance frequency of the mechanical system of one turbo-generator in the system. SSR may cause fatigue and eventually failure of the turbine shaft of the affected generator. The SSR phenomenon [1] has been intensively studied since the well-known incidents at the Mohave generator in Arizona in 1971 and 1972 where the generator shaft was subject to a growing vibration which eventually lead to a shaft fracture [2]. This is the only reported case of shaft failure caused by SSR to date.
S
Manuscript received November 25, 2009; revised December 07, 2009 and February 08, 2010; accepted March 13, 2010. First published April 15, 2010; current version published January 21, 2011. This work was supported by the Elektra program at Elforsk AB, Stockholm, Sweden. Paper no. TPWRS-009192009. The authors are with the School of Electrical Engineering, Royal Institute of Technology (KTH), 100 44 Stockholm, Sweden (e-mail: nicklas.johansson@ee. kth.se;
[email protected];
[email protected]). Digital Object Identifier 10.1109/TPWRS.2010.2046345
One way to avoid SSR is to limit the total amount of series compensation in the power system either at the design stage or by bypassing existing series capacitor segments. This approach shifts the electrical resonance frequencies away from the torsional resonances of the generator shafts. In order to determine the limits for the level of compensation, detailed studies are necessary. As a first step in the analysis, frequency scanning methods are commonly applied. Analytical frequency scanning techniques [3]–[6] determine the system impedance viewed from the neutral of the generator under study as a function of frequency. This impedance can, together with the mechanical parameters of the turbine-generator shaft, be used to estimate the damping of the shaft torsional modes of the generator. Another class of frequency scanning methods are those which use a time-domain simulation tool to simulate the power system. These add a test signal of variable frequency to the shaft speed of the generator under investigation [7]–[9]. The response in the electrical torque delivered from the generator is then recorded, and its frequency components are analyzed in order to calculate the damping torque of each frequency component during the frequency scan. Even though several methods for frequency scanning are found in the literature, comparisons are scarce. However, one recent study of two analytical methods is found in [10]. In this paper, a larger study comparing one time-domain simulation method and three different analytical approaches for frequency scanning is presented. The methods are of different complexity, and the study is performed to investigate the effect of the different simplifying assumptions of the methods on the results of the frequency scanning. The paper is organized as follows: Section II reviews the used methods of frequency scanning, and Section III describes the test system. In Section IV, the results are presented and discussed and the conclusions are found in Section V. II. METHODS FOR FREQUENCY SCANNING A. Simplified Analytical Method This method was first proposed in [3] and [4]. The method is frequently used in the industry to estimate the probability of SSR. The approach is to calculate the driving point impedance over the interesting frequency range as viewed from the neutral bus of the generator under study. The turbine-generator shaft generally has its mechanical resonance frequencies at subsynchronous frequencies. If a torsional oscillation of frequency exists, it can be shown [3] that this will give rise to currents of one subsynchronous frequency and one suin the armature. persynchronous frequency
0885-8950/$26.00 © 2010 IEEE
JOHANSSON et al.: A COMPARISON OF DIFFERENT FREQUENCY SCANNING METHODS FOR STUDY OF SUBSYNCHRONOUS RESONANCE
To include both sub- and supersynchronous components in the analysis, the driving point impedance must thus be calculated for frequencies from zero to the double electrical frequency of the grid when the electrical damping for torsional frequencies Hz is evaluated. The study machine is between zero and here represented by its induction generator equivalent while all other machines in the power system are represented by their subtransient reactances. The transmission lines are represented by their nominal -equivalents. The grid representation is found by setting up the admittance matrix of the system including the step-up transformer of the study machine. For each studied electrical frequency , the short-circuit equivalent impedance of the grid seen from the study machine is calculated including the impedance of the machine itself found from its induction generator equivalent (1) with the slip factor denoted (2) It has been assumed that the resulting synchronous subtrancan be constructed as the sient reactance of the machine arithmetical average of the subtransient reactances in the d-axis and , while the effective rotor reand q-axis directions, is calculated as the average of the effective rotor sistance resistance in the d-axis and the q-axis, and . The d-axis and q-axis subtransient and and open-circuit time constants are here denoted . the armature resistance is denoted Requiring that each mode of torsional oscillation can be evaluated independently, the electrical damping of mode of torsional oscillation is given by the interaction relationship
(3) Here, and are the resistance and reactance of the grid including the study machine impedance in per unit at the , respectively, while and subsynchronous frequency are the corresponding values at the supersynchronous frequency . The total damping of the th torsional mode is and the mecalculated by adding the electrical damping of the mode chanical damping
357
values are hard to measure and not always available, typical are for a steam-turbine generator in the values used for range of 0.02 to 0.05 [1/s] at no load and 0.2 [1/s] at full load [11]. Obviously, if the total damping constant according to (5) is negative, an SSR problem is indicated. This method exists in two versions where the method according to [4] neglects the supersynchronous damping contribution while the method according to [3] uses both the sub- and supersynchronous contributions. Also in [12], it is argued that the supersynchronous component is often neglected, and it is stated that it can be shown that the subsynchronous conductance included in the first term of (3) is generally much larger that the supersynchronous conductance included in the second term of (3). In this paper, both approaches have been used to obtain a comparison of the methods. B. Two-Axis Analytical Method This section describes a method for frequency scanning based on the full d-q representation of the study machine developed in [5] and [6]. This method, sometimes referred to as the method of complex torque coefficients, is frequently used academically [13], [14]. Some possible limitations of the method are studied in [15]. The method is based on a two-axis representation of the machine and grid, and assumes small rotor oscillations of a certain frequency. This yields variations of an oscillatory nature in the terminal voltage, stator current, and flux linkage of the machine. These pulsations are calculated in the d-q frame, and the resulting electrical torque oscillations resulting from the shaft excitation are calculated. Assuming that the rotor oscillations can be represented by a rotating phasor and the torque pul, the electrical complex torque sations by another phasor coefficient can be introduced as (7) . To investigate the interaction between the elecwith trical system and the mechanical system of the generator and turbines, it is assumed that the interaction effect can be described by the equation of motion of the generator rotor, which is assumed to execute a small oscillation. To this end, a mechanical , analogous complex torque coefficient , is introduced, and the equation of oscillation govto erning the interaction can be written as (8)
(4) The effective damping constant is determined by (3): (5) can be divided into one subsynchronous term and one corresponding to each term in (5) supersynchronous term
The torque coefficient can be determined if all mass inertias, spring constants, and damping constants in the massspring model of the turbine-generator axis system are known. From (8), it can be shown that an interaction can only occur at frequencies where (9)
(6) is the electrical damping constant, and The first term in the second term is the mechanical counterpart while is the modal inertia of the torsional mode. As the mechanical damping
derived in [5] and [6] is more acThe method to calculate curate than the simplified method described in the previous section. However, the method is also more demanding to implement, and it requires more detailed machine data. In the method
358
IEEE TRANSACTIONS ON POWER SYSTEMS, VOL. 26, NO. 1, FEBRUARY 2011
proposed in [5], the curve plot of versus frequency is comversus frequency. The areas in the pared to the plot of plot which are bounded by the two curves where indicate ranges in frequency where SSR is likely to occur. In this paper, the calculation of the electrical damping coefficient versus frequency from [6] is used while the calculation of the mechanical damping coefficient versus frequency is omitted since it requires detailed information of the mechanical characteristics of the generator-turbine shaft. This type of information is often lacking in real cases. The evaluation of the SSR probability is done in the same way as in the simplified analytical method by comparing electrical damping coefficients and the mechanical damping coefficients at the known torsional resonance frequencies. C. Test Signal Method This section describes the used test signal method, described in [7] and [8]. The version of the method which is used here is implemented as in [9]. The method, also known as the “complex torque coefficient method realized by time domain simulation”, was also used in [16]. This method models the power system in a time-domain simulation software which makes it possible to use complex models of the power system loads and generators if required. The drawback of the method is naturally that it is computationally demanding and thus time-consuming compared to the other methods. The time-domain simulation software used in this work was PSCAD/EMTDC. The differential of the electrical torque delivered from the generator of study can be expressed in per unit as (10) Here, the synchronizing torque coefficient is denoted [p.u. torque/rad.], and the damping torque coefficient is denoted [p.u. torque/p.u. speed]. [rad.] is the electrical angle of the [rad/s] machine and [rad/s] the speed of the machine with denoting the nominal speed. Now, assume that the generator axis is excited with a small angular perturbation corresponding to a variation in the electrical angle of the machine (11) which yields (12) This is the real part of a rotating phasor . When this speed modulation excites the shaft, it will result in a torque modulation of the same frequency . If the electrical torque delivered from the generator is measured, it can be resolved into an average and an oscillating component (13) where the complex phasor is
. Thus (14)
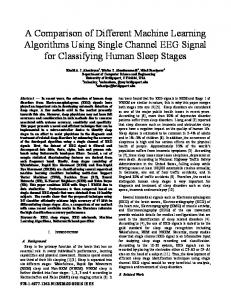
Fig. 1. Four-machine test system.
By inserting (11), (12), and (14) into (10), and identifying terms, the unknown torque coefficients can be identified as (15) In the implementation of the method used in this paper, the oscillating component of the measured electrical torque and its are found by means of a recursive least squares phasor (RLS) algorithm. In order to find the power system damping for all subsynchronous frequencies of interest, the excitation frequency is varied between zero and the nominal electrical frequency. In the time-domain simulation, it is necessary to adapt the speed of the frequency scan such that the estimator has sufficient time to stabilize in each frequency region. In the simulations performed in this paper, it was found suitable to use a scanning speed of 0.4 Hz/s and a bandwidth of the RLS algorithm corresponding to 0.2 Hz.
III. TEST SYSTEM The test system used to illustrate the function of the different methods for frequency scanning is a four-machine system shown in Fig. 1. The four-machine system is based on a commonly used 230 kV/60 Hz system for studies of inter-area oscillations [17]. The loads are modeled as impedances and the rating of all generators in the system is 20 kV/900 MVA. Some changes are made from the original system: one tie line is added and the length of the lines interconnecting the two grid areas is stretched to 300 km. Nominal -models were used for the transmission lines. Shunt compensation in node 8 is also inserted to maintain a good voltage profile. Series compensation of variable degree is assumed to be inserted by means of a thyristor switched series capacitor (TSSC) installed on one of the lines connecting node 8 and 9. The TSSC may be installed in the system to mitigate power oscillations, improve the transient stability, and control the power flows on the lines between node 8 and 9 [18]. The generator under study is here chosen to be G1 and the other generators are thus represented by their subtransient impedances in the analytical calculations. In the time-domain simulations of the test signal method in PSCAD, generator G1 is modeled using a standard two-axis model while the other generators are represented by voltage sources behind the corresponding subtransient reactances. G1 is assumed to be equipped with a turbine-generator shaft system with the same parameters as in the IEEE first benchmark model for studies of SSR [19]. This is a mechanical system with four turbines in addition to the generator and exciter. The resonant characteristics of this system are given in Table I.
JOHANSSON et al.: A COMPARISON OF DIFFERENT FREQUENCY SCANNING METHODS FOR STUDY OF SUBSYNCHRONOUS RESONANCE
TABLE I TURBINE-GENERATOR SHAFT MODAL PARAMETERS
359
TABLE II APPROXIMATIVE OPERATING POINTS OF THE FOUR-MACHINE SYSTEM
IV. RESULTS AND DISCUSSION A. Method Performance Comparison The methods which were presented in Section II are here compared using first a frequency scan where the electrical damping is calculated as a function of torsional frequency and then a scan where the level of compensation is varied at a fixed frequency which is chosen as one of the torsional resonance frequencies of the generator-turbine axis. The values obtained for the electrical damping are compared to the mechanical damping values for the used axis system in order to indicate if the studied situations are prone to SSR or not. It should be stressed that since the study is focused on comparing different methods of frequency scanning, only a limited number of grid operating points have been investigated. Thus, this study is not sufficient to determine the maximum TSSC compensation level which could be allowed in the test system. versus : The comparison of 1) Frequency Scanning the different methods of frequency scanning was first made in the four-machine system in four different contingency configurations at 70% TSSC compensation level. The level of compensation is here given in percent of the inductive reactance of a single line between nodes 8 and 9. The studied test cases are given as follows: 1) four-machine system with no lines disconnected; 2) four-machine system with one line N8-N9 in parallel to the TSSC line disconnected; 3) four-machine system with both lines N8-N9 in parallel to the TSSC line disconnected; 4) four-machine system with one line N7-N8 disconnected. Each case is studied with the generator G2 connected and disconnected. The operating points of the four-machine system used in the study are given in Table II. The compared methods of frequency scanning are: the Test signal method, the Two-axis analytical method, and the Simplified analytical method. The Simplified analytical method is tested in two versions, including to the and excluding the supersynchronous contribution damping constant . The electrical damping constant of the system was in each case calculated as a function of generator shaft torsional frequency with all four methods. The results for the cases with generator G2 connected are shown in Figs. 2–5. In the figures, the mechanical damping constants of each torsional mode are also given. To account for inaccuracies, the -markers are shown to cover an interval of each torsional resonance frequency. With a certain margin, an SSR indication according to a certain method is thus given -marker extends above the -line correif any part of a sponding to this method. It can be seen that the Test signal- and Two-axis methods give almost identical results in the range between 5 and 60 Hz. As these methods are the most detailed,
D
f
Fig. 2. Comparison of versus for different methods of frequency scanning, case I, G2 connected, 70% TSSC compensation.
they are also expected to yield the most accurate results. The Simplified method including the supersynchronous component which are slightly higher than those of the yields values of other more detailed methods at frequencies below about 30 Hz while the Simplified method excluding the supersynchronous component yields values which are slightly lower than those of the detailed methods in the whole frequency range. The deviation from the detailed methods is accentuated at lower frequencies for both methods. At very low frequencies, the results of the methods diverge significantly. However, since SSR seldom occurs at such low torsional frequencies, the behavior in this region is less important. It can be concluded that the mechanical damping constant of the system in the cases with G2 connected is more positive than the negative contribution of the electrical damping constant and SSR is thus not expected. The results of the cases with G2 disconnected are shown in Figs. 6–9. In these cases, it can be seen that the Test signal method, the Two-axis analytical method, and the Simplified anyield approximately the same alytical method including results in the region between 10 and 60 Hz. The Simplified method excluding the supersynchronous damping component appears to underestimate the electrical damping significantly. As in the previous cases, the methods diverge at frequencies lower than about 5–10 Hz. The Two-axis method and the Test signal method are the methods which agree to the largest extent at low and high frequencies while there is a slight difference between these detailed methods at the resonance peak, especially
360
IEEE TRANSACTIONS ON POWER SYSTEMS, VOL. 26, NO. 1, FEBRUARY 2011
D
f
D
f
Fig. 3. Comparison of versus for different methods of frequency scanning, case II, G2 connected, 70% TSSC compensation.
Fig. 4. Comparison of versus for different methods of frequency scanning, case III, G2 connected, 70% TSSC compensation.
D
f
Fig. 5. Comparison of versus for different methods of frequency scanning, case IV, G2 connected, 70% TSSC compensation.
in case III. It is interesting to note the comparably good outcome of the Simplified analytical method including which
D
f
D
f
Fig. 6. Comparison of versus for different methods of frequency scanning, case I, G2 disconnected, 70% TSSC compensation.
Fig. 7. Comparison of versus for different methods of frequency scanning, case II, G2 disconnected, 70% TSSC compensation.
is easy to implement and requires very little computational effort. The Two-axis method also performs well with a low computational effort even though it is more complicated to implement. It is also important to note the large deviations between the Simplified method with the supersynchronous contribution neglected and the other methods. At least in this test system, this method appears to yield overly conservative damping estimates. is disregarded, no If the Simplified method neglecting SSR indication is seen in cases I, II, and IV while a problem with the third resonance mode at 25.55 Hz and possibly the fourth torsional mode at 32.28 Hz is indicated in case III. These modes are studied further in the next section. versus Compensation Level: Here, the 2) Scanning level of compensation was varied while studying the electrical damping seen from the generator neutral for a certain torsional frequency. For completeness, all possible levels of compensation between 0 and 90% were studied even though only a fixed number of discrete levels of TSSC compensation is possible in a real installation. In Figs 10 and 11, the results for the third and the fourth torsional resonance modes are shown for case III with G2 disconnected. As before, it can be seen that the
JOHANSSON et al.: A COMPARISON OF DIFFERENT FREQUENCY SCANNING METHODS FOR STUDY OF SUBSYNCHRONOUS RESONANCE
D
f
D
f
Fig. 8. Comparison of versus for different methods of frequency scanning, case III, G2 disconnected, 70% TSSC compensation.
361
D
versus level of compensation for different methods Fig. 10. Comparison of of frequency scanning, torsional mode 25.55 Hz, case III, G2 disconnected.
D
Fig. 9. Comparison of versus for different methods of frequency scanning, case IV, G2 disconnected, 70% TSSC compensation.
Fig. 11. Comparison of versus level of compensation for different methods of frequency scanning, torsional mode 32.28 Hz, case III, G2 disconnected.
Simplified method neglecting gives significantly lower values of the electrical damping constant than the rest of the methods which agree to a large extent. According to the detailed methods and the Simplified analytical method including , SSR is indicated at compensation levels of the TSSC which are higher than about 65% for the third torsional mode and for compensation levels between about 40 and 60% for the fourth mode. This is actually a comparably low level of compensation for the total interconnection N7-N9, but the studied case is also an N-3 case which is not very likely to occur. Note that, for the Test signal method, only data for compensation levels above 5% are presented. For compensation levels below approximately 5%, the method yields unreliable results due to startup transients when the scanning in compensation level starts. The inaccuracy in this region can, however, be decreased to an arbitrarily low level on the expense of a longer simulation time by decreasing the scanning speed. In the results of the versus scanning, the deviations between the methods are the largest at low frequencies. This is also seen in this study, where the largest deviations are seen at the lowest torsional mode. In
Figs. 12 and 13, the results for this mode in case II with the generator G2 connected and disconnected are plotted. From Figs. 12 and 13, it can be seen that the Simplified method with neglected gives a lower damping estimate than the other methods at all levels of compensation in both configurations. This deviation is very significant when G2 is disconnected. It can also be noted that the other methods disagree slightly when G2 is connected. In this case, the Simplified method yields a slightly higher value of the damping constant than the more detailed methods in the whole compensation range. 3) Influence of the Generator Load on the Damping Characteristics: The methods based on a d-q representation of the studied generator take into account the influence of the generator operating point on the electrical damping whereas the Simplified analytical method does not. This is exemplified in Fig. 14 where the Simplified method including is compared to the Two-axis analytical method for different generator loads. Fig. 14 shows that the methods closely coincide when G1 is lightly loaded and diverge slightly when the loading of G1 is increased. In the high load cases, the Two-axis method yields
362
IEEE TRANSACTIONS ON POWER SYSTEMS, VOL. 26, NO. 1, FEBRUARY 2011
D
Fig. 12. Comparison of versus level of compensation for different methods of frequency scanning, torsional mode 15.71 Hz, case II, G2 connected.
D
Fig. 13. Comparison of versus level of compensation for different methods of frequency scanning, torsional mode 15.72 Hz, case II, G2 disconnected.
a more conservative estimate of the electrical damping. However, since the lowest mechanical damping values are generally seen at low load levels of the generator, it can be argued that the Simplified method agrees to a larger extent with the two-axis method in the most important cases. 4) Possible Causes for the Discrepancies Between the Methods: The most obvious difference between the methods is the significantly lower values of the damping constant found . In this test using the Simplified method neglecting system, the assumption that the supersynchronous contribution to the electrical damping is much smaller in magnitude than its subsynchronous counterpart is apparently not valid. The other methods agree quite well generally, even though small differences are found. The Simplified method appears to differ slightly from the detailed methods when generator G2 in the test system is connected. This is a case where the impedance to ground seen from the neutral of Generator G1 is low. This means that the generator model (of G1) itself has a large contribution to the total impedance. Thus, the modeling of the generator becomes more important in this case, and this may be one cause of the observed differences. Furthermore, it is seen that the studied methods diverge at low frequencies. To this
D
f
versus for the two-axis analytical method and the simplified Fig. 14. analytical method in case III with G2 disconnected at different operating points , , half load— of G1: Full load— , , and low load— .
P = 900 MW Q = 200 MVAr P = 500 MW Q = 100 MVAr P = 100 MW Q = 20 MVAr end, it should be noted that the performance for the Test signal method at low frequencies is dependent on the speed of the frequency scan and the bandwidth of the RLS algorithm. The performance can be improved if a slower speed of the frequency scan is selected together with a more narrow bandwidth. This will naturally require a longer simulation time. One reason for the performance degradation of the Simplified analytical method at low frequencies is the fact that while the method assumes the effective reactance of the machine to be equal to the subtransient value, the generator reactance is in reality increasing from the subtransient value to the transient value as the frequency decreases from about 10 Hz to 2 Hz. This effect is taken into account by the Two-axis analytical method, and the results of this method also show a larger agreement to the results of the Test Signal method in this region. These methods are based on two-axis models of the studied generator and are thus likely to produce similar results. The reason behind the small differences between the damping estimates of these two methods which are seen particularly where the electrical damping is at its lowest in Fig. 10 and Fig. 11 is currently not fully understood. The generator models in the two methods as well as the load and line models are very similar. However, one source of deviations between the two methods may be that the Two-axis analytical model is based on a small-signal representation of the grid while the Test signal method handles signals with larger magnitudes, especially when a resonance is excited. As it may be argued that the symmetry of the test system may skew the results of the study, an additional study was done on a modified version of the system. In this less symmetric system, the distance between nodes 9 and 10 was changed from 10 km to 50 km and the distance from node 10 and 11 was changed from 25 km to 100 km. The comparison of the methods in this system resulted in the same qualitative differences which were found for the original system with damping curves which where slightly shifted when compared to the results of the original system. This indicates that the qualitative differences between
JOHANSSON et al.: A COMPARISON OF DIFFERENT FREQUENCY SCANNING METHODS FOR STUDY OF SUBSYNCHRONOUS RESONANCE
the different methods of frequency scanning which were found in this paper may persist also in power systems which are less symmetric than the four-machine test system. V. CONCLUSIONS It can be concluded from the study that there are fast analytical methods for frequency scanning which give reliable results when compared to a more detailed time-domain simulation method, the Test signal method. The analytical method which gives the best agreement with the Test signal method is the Two-axis analytical method. This is not surprising since this method is derived from a complete two-axis representation with no simplifications. The Simplified analytical method inwhich models the studied generator by its induccluding tion machine equivalent also provides good results, even if it appears to overestimate the electrical damping slightly in some system configurations. The Simplified analytical method neunderestimates the damping significantly in this glecting test system and thus gives overly conservative results when the risk of SSR is assessed. REFERENCES [1] Subsynchronous Resonance Working Group of the System Dynamic Performance Subcommittee, “Reader’s guide to subsynchronous resonance,” IEEE Trans. Power Syst., vol. 7, no. 1, pp. 150–157, Feb. 1992. [2] D. N. Walker, C. E. J. Bowler, R. L. Jackson, and D. A. Hodges, “Results of subsynchronous resonance test at Mohave,” IEEE Trans. Power App. Syst., vol. PAS-94, no. 5, pt. 1, pp. 1878–1889, Sep. 1975. [3] L. A. Kilgore, D. G. Ramey, and M. C. Hall, “Simplified transmission and generation system analysis procedures for subsynchronous resonance problems,” IEEE Trans. Power App. Syst., vol. PAS-96, no. 6, pt. 1, pp. 1840–1846, Nov. 1977. [4] B. L. Agrawal and R. G. Farmer, “Use of frequency scanning techniques for subsynchronous resonance analysis,” IEEE Trans. Power App. Syst., vol. PAS-98, no. 2, pp. 341–349, Mar. 1979. [5] I. M. Canay, “A novel approach to the torsional interaction and electrical damping of the synchronous machine, part I: Theory,” IEEE Trans. Power App. Syst., vol. PAS-101, no. 10, pp. 3630–3638, Oct. 1982. [6] I. M. Canay, “A novel approach to the torsional interaction and electrical damping of the synchronous machine, part II: Application to an arbitrary network,” IEEE Trans. Power App. Syst., vol. PAS-101, no. 10, pp. 3639–3647, Oct. 1982. [7] T. Hara, N. Kobayashi, A. Takei, F. Koyanagi, K. Tanomura, and J. Arai, “Development of a damping analysis program for multi-generator power systems,” IEEE Trans. Power Syst., vol. 9, no. 4, pp. 1803–1810, Nov. 1994. [8] Z. Xu and Z. Feng, “A novel unified approach for analyzing small-signal stability of power systems,” in Proc. IEEE Power Eng. Soc Winter Meeting 2000, Singapore, Jan. 2000. [9] Q. Liu, C. Zhou, L. Ängquist, and C. Rehtanz, “A novel active damping control of TCSC for SSR suppression in a radial corridor,” in Proc. DRPT 2008, Nanjing, China, Apr. 2008, pp. 136–142. [10] T. Rauhala, P. Järventausta, and H. Kuisti, “Frequency scanning program for SSR studies implemented to function in connection of PSS/E power flow analysis program,” in Proc. 15th PSCC, Liege, Belgium, Aug. 2005. [11] D. H. Baker, G. E. Boukarim, R. D’Aquila, and R. J. Piwko, “Subsynchronous resonance studies and mitigation methods for series capacitor applications,” in Proc. Power Eng. Soc. Inaugural Conf. Expo. Africa, Durban, South Africa, Jul. 2005, pp. 386–392.
363
[12] P. M. Anderson and R. G. Farmer, Series Compensation of Power Systems. : PBLSH! Inc., 1996, p. 241. [13] N. Prabhu and K. R. Padiyar, “Investigation of subsynchronous resonance with VSC-based HVDC transmission systems,” IEEE Trans. Power Del., vol. 24, no. 1, pp. 433–440, Jan. 2009. [14] C. Yu, Z Cai, Y. Ni, and J. Zhong, “Generalised eigenvalue and complex-torque-coefficient analysis for SSR study based on LDAE model,” Proc. Inst. Elect. Eng., Gen., Transm., Distrib., vol. 153, no. 1, pp. 25–34, Jan. 2006. [15] A. Tabesh and R. Iravani, “On the application of the complex torque coefficients method to the analysis of torsional dynamics,” IEEE Trans. Energy Convers., vol. 20, no. 2, pp. 268–275, Jun. 2005. [16] H. Liu, Z. Xu, and Z. Gao, “Study on SSR Characteristics of power systems with static VAR compensator,” in Proc. 7th Int. Conf. AC-DC Power Transmission, London, U.K., Nov. 2001. [17] P. Kundur, Power System Stability and Control. New York: McGrawHill, 1994, pp. 813–816. [18] N. Johansson, L. Ängquist, and H.-P. Nee, “An adaptive controller for power system stability improvement and power flow control by means of a Thyristor Switched Series Capacitor (TSSC),” IEEE Trans. Power Syst., vol. 25, no. 1, pp. 381–391, Feb. 2010. [19] IEEE Subsynchronous Resonance Task Force of the Dynamic System Performance Working Group Power System Engineering Committee, “First benchmark model for computer simulation of subsynchronous resonance,” IEEE Trans. Power App. Syst., vol. PAS-96, no. 5, pp. 1565–1572, Sep. 1977. Nicklas Johansson (S’05) was born in Luleå, Sweden, in 1973. He received the M.Sc degree in engineering physics from Uppsala University, Sweden, in 1998. He worked at ABB Corporate Research, Västerås, Sweden, from 1998–2002 as a Development Engineer within the group of Power Electronics. He later worked as a hardware electronics consultant before joining the School of Electrical Engineering at the Royal Institute of Technology in Stockholm, Sweden, as a Ph.D. student in 2005. His research is focused on control of FACTS devices.
Lennart Ängquist (M’06) was born in Växjö, Sweden, in 1946. He received the M.Sc. degree from Lund Institute of Technology, Lund, Sweden, in 1968 and the Ph.D. degree from the Royal Institute of Technology, Stockholm, Sweden, in 2002. He was with ABB (formerly ASEA) in various technical departments. He was working with industrial and traction motor drives from 1974–1987. Thereafter, he has been working with FACTS applications in electrical power systems. He is an Adjunct Professor at the Royal Institute of Technology, Stockholm, Sweden.
Hans-Peter Nee (S’91–M’96–SM’04) was born in 1963 in Västerås, Sweden. He received the M.Sc., Licentiate, and Ph.D. degrees in electrical engineering from the Royal Institute of Technology, Stockholm, Sweden, in 1987, 1992, and 1996, respectively. In 1999, he was appointed Professor of power electronics in the Department of Electrical Machines and Power Electronics, Royal Institute of Technology. His interests are power electronic converters, semiconductor components and control aspects of utility applications, like FACTS and HVDC, and variable-speed drives.