Short Technical Reports A comparison of inoculation methods to simplify recombinant protein expression screening in Escherichia coli Didier Busso, Matthieu Stierlé, Jean-Claude Thierry, and Dino Moras Plate-forme de Biologie et de Génomique Structurales, Institut de Génetique et de Biologie Moléculaire et Cellulaire/Centre National de Recherche Scientifique/Institut National de la Santé de la Recherche Médicale, Université Louis Pasteur, Illkirch, France BioTechniques 44:101-106 (January 2008) doi 10.2144/000112632
In the past five years, Structural Genomics (SG) initiatives have established an automated pipeline for protein production in Escherichia coli to rapidly screen various conditions, resulting in soluble expression of recombinant proteins to aid in carrying out structural studies. However, some steps of the procedure are still extensive and require manual handling. Here, we present a comparative study of one step of the process, E. coli cultivation, using a set of 12 expression vectors encoding for fusion proteins of seven independent target proteins. First, we show that performing E. coli growth in auto-inducible medium (ZYM-5052) results in a comparable protein expression/solubility profile to that obtained when growing cells in classical Luria-Bertani (LB) medium. Second, we show that the transformation mix can be used directly to inoculate a culture, saving time and circumventing the error-prone step of colony picking, without impairing cell growth and the protein expression/solubility profile. Thus, we show that a basic, but nevertheless essential, step of a protein production pipeline, E. coli cultivation, can be simplified to a single event that is fully compatible with complete automation.
INTRODUCTION A key step for structural studies is the preparation of soluble and homogeneous protein at high levels. Even though mammalian proteins often require the use of eukaryotic expression systems or cell-free expression systems to be correctly folded, protein expression in Escherichia coli is still the system of choice in most laboratories and in SG projects (Reference 1 and references herein; References 2–4). However, working with E. coli to produce soluble recombinant protein requires the combination of different strategies, such as (i) cloning homologous sequences from different organisms (www.strgen.org), (ii) using a wide range of fusion partners (5–7), (iii) changing host strains as well as growth conditions (8–11), or even (iv) using directed protein evolution (12,13). Whatever the approach(es) used, testing a large number of parameters to produce samples suitable for structure determination led to new developments using automation Vol. 44 ı No. 1 ı 2008
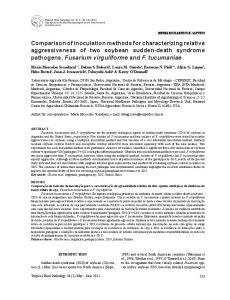
for fast and reliable screening (for reviews, see References 14–16). In most cases, such developments resulted in elaborating new protocols and adapting “classical” bench protocols to automation using multiwell plates that fit the ANSI/SBS (American National Standards Institute/Society for Biomolecular Sciences) format. Nevertheless, even with automation, the protein production pipeline often consists of several steps that have to be linked and require manual intervention. The number of events may not only result in an extended procedure but, more importantly, will certainly increase the risk of error. Here, we present a comparative study of the first part of the protein production pipeline: the expression in E. coli. This part, depending on the strategy used, may include up to six events (that is, transformation, plating, colony picking, preculture, culture, and induction). To reduce the number of events and to eliminate the manual intervention as much as possible, we compared different strategies to perform
the inoculation step (Figure 1). To validate the study, 12 expression vectors encoding fusion proteins corresponding to seven independent targets have been used (Table 1). Three independent experiments were conducted in the same conditions and led to identical conclusions. Here we present the results obtained for one of them. We show that performing E. coli growth following the different strategies resulted in a similar protein expression/ solubility profile for the set of expression vectors used, demonstrating that a simple multi-event step can be reduced to a single event—saving time, minimizing manual handling, and reducing the risk of error. MATERIALS AND METHODS Target Vectors All plasmids used in this study have been constructed within the Structural Proteomics in Europe (SPINE) network. Target vectors harbored the T7 promoter for transcriptional regulation in combination with E. coli strains that have the DE3 prophage for T7 RNA polymerase production (17). All vectors encoded an N- or Cterminal His6 tag, and sometimes an extra N-terminal fusion was added to the protein (see Table 1). Competent Cell Transformation For this study, we used the well established E. coli BL21(DE3) host strain. Transformations were performed in parallel using a MicroAmpR optical 96-well PCR plate (PE Applied Biosystems, Foster City, CA, USA). Briefly, expression vectors (50 ng) were dispensed with a multichannel pipettor at the bottom of each well and 25 μL of chemical-competent cells were added by the Tecan Genesis robot (Tecan, Maennedorf, Switzerland). The competent cells, dispensed into 0.6mL PCR tubes, were kept cold during the transfer by using a prechilled cooling rack (Stratagene, La Jolla, CA, USA). The transformation mixes were maintained at 4°C for 20 min using the cooling rack installed on the robot. After a heat shock at 45°C for www.biotechniques.com ı BioTechniques ı 101
Short Technical Reports
1 min using a PCR machine (Bio-Rad Laboratories, Hercules, CA, USA), the PCR plate was placed on the robot’s deck and 100 μl of LB medium were added. The plate was sealed with aluminum foil and incubated for 1 h at 37°C in a 2-mm orbital shaker (Infors, Bottmingen, Switzerland). Thus transformation mixes were used to: (i) inoculate the preculture, (ii) inoculate the culture, and (iii) plate LB-Agar Petri dishes (Figure 1). Culture Conditions Standard procedure. A 500-μL preculture in LB medium + 2% glucose was started from an isolated colony and grown overnight at 37°C. The day after, the optical density at 600 nm (OD600nm) was measured, and both cultures in LB + 2% glucose and in auto-inducible media were inoculated at 0.05 OD600nm with the preculture. For cultivation in LB medium, 2 mL of LB + 2% glucose were dispensed into a 24-deep well plate and the culture was grown after inoculation at 25°C up to OD600nm = 0.5. Thus, the expression of fusion proteins was induced by addition of isopropyl β-D thiogalactopyranoside solution (IPTG) at 0.5 mM, and the culture was extended for an additional 42 h at 25°C. For cultivation in autoinducible medium, 2 mL of ZYM-5052 (18) were dispensed into a 24-deep well plate and the culture was grown at 25°C for 42 h after inoculation. After growth, the OD600nm was recorded (see Table 2), cells were harvested by centrifugation (1300× g, 10 min, 4°C), and pellets were stored at -20°C until protein analysis. Benchmarking procedure. The different strategies tested to carry out E. coli cultivation are summarized in Figure 1. Cell plating was performed onto LB-Agar medium dispensed in a 6-well culture plate using the Tecan robot. The preculture was carried out for 16 h at 37°C in a 2-mm orbital shaker (Infors) at 350 rpm using 500 μL of LB medium + 2% glucose dispensed into a 96-deep well plate. The preculture was inoculated with either an isolated colony (Strategy 1) or 10 μL of the transformation mix (Strategy 3). The 102 ı BioTechniques ı www.biotechniques.com
Figure 1. Steps and time scale for the different strategies used to carry out Escherichia coli cultivation. The different steps for the four strategies used to carry out E. coli growth are boxed. Details concerning some steps or the links between steps are indicated under the boxes and at the right of arrows, respectively. Time scale is indicated on the left and dashed lines represent the limit between days. Boxes placed on a dashed line correspond to a step initiated a given day and finished the following day.
Table 1. Target Vectors Used in the Study #
Code
Fusion Mr (kDa)
Protein Family
Tag (N or C)a
Resistance Gene
Originb
1
VE0330
86.9
Nuclear receptor
(N) NusA-His6
Ampicillin
SBGP
2
VE0454
87.4
Nuclear receptor
(N) NusA-His6
Ampicillin
SBGP
Ampicillin
SBGP
Ampicillin
SBGP
3
VE1294
59.5
Signaling protein
(N) MBP(C) His6
4
VE1295
74
Signaling protein
(N) NusA(C) His6
5
VE1297
43.3
Signaling protein
(N) His6-GST
Ampicillin
SGBP
6
Orsay 4
40.1
NC
(N) His6
Kanamycin
IBBMC
7
OPPF 1446
19.5
NC
(N) His6
Ampicillin
OPPF
8
OPPF 1751
13
NC
(N) His6
Ampicillin
OPPF
9
VE1522
31
Transcriptional activator
(N) His6
Ampicillin
SBGP
10
VE1292
19.1
Signaling protein
(C) His6
Ampicillin
SBGP
Ampicillin
SBGP
Ampicillin
SBGP
11
VE1296
30.9
Signaling protein
(N) TRX(C) His6
12
VE1299
29.6
Signaling protein
(N) His6-TRX
Constructs 1, 2, 6, 7, 8, and 9 correspond to independent proteins. Constructs 3, 4, 5, 10, 11, and 12 correspond to the same protein fused to different fusion(s). a The location as well as the fusion(s) added to the protein of interest is indicated. (N): fusion at the N terminus of the protein of interest. (C): fusion at the C terminus of the protein of interest. b The source of the different target vectors is indicated. SBGP: Structural Biology and Genomics Platform, IGBMC, 1 rue Laurent Fries, 67404 Illkirch, France. IBBMC: Institut de Biochimie et de Biophysique Moléculaire et Cellulaire, UMR8619 Bât 430, Université de Paris-Sud 91405 Orsay Cedex, France. OPPF: Oxford Protein Production Facility, Wellcome Trust Centre for Human Genetics, Roosevelt Drive, Oxford OX3 7BN, UK. GST: glutathione S-transferase; His6: 6 histidine tag encoding sequence; MBP: maltose-binding protein; Mr: molecular mass of the fusion protein; NC: non-communicated; NusA: N-utilizing substance A; TRX: thioredoxin.
Vol. 44 ı No. 1 ı 2008
Short Technical Reports A
protein production consists of a multievent extended procedure requiring manual handling. The procedure is summarized as follows: (i) transformation of expression vectors, (ii) plating of the transformation mix, (iii) picking of an isolated colony to (iv) inoculating a preculture, (v) performing culture inoculation with the preculture, and finally (vi) monitoring OD600nm for protein production induction with IPTG. To simplify this procedure, E. coli growths were carried out in autoinducible medium and we performed inoculation following four strategies (Figure 1). To validate our study, we compared the expression/solubility profile for 12 fusion protein constructs corresponding to 7 independent targets (Table 1).
B
Figure 2. LB vs. auto-induction. Target vectors transformed BL21(DE3) host strain. An isolated colony was used to inoculate a preculture for a 16-h growth at 37°C. Cultivation into LB + 2% glucose and autoinducible ZYM-5052 media were carried out following standard procedures as described in Materials and Methods. After normalization into lysis buffer and cell disruption, 10 μL of total and soluble fractions were loaded onto SDS-PAGE gels. (A) Two SDS-PAGE gels are displayed and are separated by a vertical line (12.5% SDS-PAGE on the left and 15% SDS-PAGE on the right). Protein construct numbers refer to Table 1 and are indicated on the top. The + indicates which medium the culture was grown in (AI: auto-inducible ZYM-5052; LB: Luria-Bertani medium). M: prestained Precision Plus molecular weight markers (Bio-Rad Laboratories) as indicated on the left and on the right of gels; S: soluble proteins; T: total proteins. Stars indicate expressed fusion proteins at the expected molecular weight as indicated in Table 1. (B) Expressed and soluble proteins at the expected molecular weight were quantified by densitometry using the peak area calculation method with a Chemidoc XRS system (Bio-Rad Laboratories). Results are displayed on the histogram.
inoculation of the preculture with the transformation mix was handled by the robot. For Strategies 1 and 3, the OD600nm of the preculture was recorded using the GENios microplate reader (Tecan) and subsequent cultures were inoculated at 0.05 OD600nm. For Strategy 4, 10 μL of the transformation mix were transferred by the Tecan robot directly to the culture. Whatever the strategy used, cultures were carried out in 2 mL of auto-inducible ZYM-5052 medium dispensed into a 24-deep well plate, for 42 h at 25°C in a 2-mm orbital shaker at 350 rpm. After growth, the OD600nm was recorded with the GENios reader (see Table 2). Cells were harvested by centrifugation (1300× g, 10 min, 4°C) and pellets were stored at -20°C until protein analysis. LB and LB-Agar are from Invitrogen (Carlsbad, CA, USA). For solid and liquid media, ampicillin, as well as carbenicillin, was used at 100 Vol. 44 ı No. 1 ı 2008
μg/mL of medium, and kanamycin was used at 50 μg/mL of medium. Protein Analysis Cell density for each culture was normalized to an OD600nm of 20 into lysis buffer (typically, 100 μL of lysis buffer/mL of culture at OD600nm = 2) containing 50 mM Tris-HCl, pH 7.5, 150 mM NaCl, 10% glycerol. A 500-μL aliquot of the suspended cells was disrupted by sonication. An aliquot (10 μL) of total proteins, and of soluble proteins obtained after centrifugation (5000× g, 60 min, 4°C), was analyzed on Coomassieblue-stained SDS-PAGE gels. RESULTS AND DISCUSSION The classical procedure to perform E. coli cultivation for recombinant
Auto-inducible vs. LB Media The recent advent of auto-inducible media (18) is suitable for parallel expression screening in E. coli and is well adapted for automation. The methods have been developed for use with DE3 lysogen cell lines in combination with T7-controlled expression vectors. The auto-inducible method has been described in several laboratories for producing recombinant proteins (2,11,19–23). To determine if the autoinducible medium was well adapted for our procedure, we carried out E. coli cultivations in auto-inducible ZYM5052 and in LB media, and compared the protein expression/solubility profile for our set. We carried out the growth at 25°C to promote soluble expression of fusion proteins, as documented elsewhere (10,24). Each construct was transformed with the robot in the E. coli BL21(DE3) host strain, and growth was done in 2 mL of medium following the standard procedure (see Materials and Methods). After cultivation, cells were harvested and normalized to an OD600nm = 20 into the lysis buffer in order to load on the gel the material produced by the same amount of cells. Cells were disrupted by sonication, and the same volume of total and soluble proteins was loaded onto SDS-PAGE. Figure 2A shows that each fusion protein is expressed at the expected molecular weight (see Table 1). The densitometric analysis of the results, www.biotechniques.com ı BioTechniques ı 103
Short Technical Reports
presented in Figure 2B, shows that the amount of total protein loaded on the gel is comparable whatever the cultivation medium and is even better for sample 1 when cultivation was performed in auto-inducible medium. This result suggests that cultivation media do not have a significant impact on the yield of recombinant protein expressed per cell. A major problem of expressing recombinant protein in E. coli is that a fraction of overexpressed protein often accumulates as inclusion bodies (25). Thus, to determine if growth media had an impact on protein solubility, we analyzed soluble proteins loaded onto SDS-PAGE (Figure 2A). Protein constructs 6 and 7 were expressed as soluble proteins in both media, protein constructs 9 and 10 were expressed as partially soluble in both media, and protein constructs 1, 2, 5, 11 and 12 were produced in the insoluble fraction of cellular extracts whatever the medium. For protein constructs 3, 4 and 8, growth in auto-inducible medium resulted in the expression of a part of the protein in the soluble fraction, although the proteins were produced as insoluble in LB medium (Figure 2A, compare lanes 13, 17, and 33 with lanes 11, 15, and 31, respectively). Together, these results show that 75% of the protein constructs (9 out of 12) behave similarly in both cultivation media and that, for the remaining 25% (3 out of 12), cultivation in auto-inducible medium increased protein solubility slightly, suggesting that auto-inducible medium had a positive effect on protein solubility in our study. Moreover, we observed that the biomass obtained after cultivation in auto-inducible medium was higher than that obtained after cultivation in LB (average OD600nm = 13.3 and 3.4, respectively; see Table 2). Thus, since the yield of recombinant protein expressed per cell is similar whatever the medium (see Figure 2), we conclude that using auto-inducible medium resulted in an enrichment of about four times the amount of expressed protein. Finally, using auto-inducible media reduces manual intervention by eliminating the requirement of monitoring OD600nm and inducing with IPTG. Thus we decided to carry out all our protein expression screening cultures in autoinducible medium. 104 ı BioTechniques ı www.biotechniques.com
A
B
Figure 3. Expression/solubility profile comparison of Escherichia coli cultivation strategies. Transformed BL21(DE3) host strain and E. coli growths were carried out following strategies described in Materials and Methods. Growths were performed in auto-inducible ZYM-5052 medium for 42 h at 25°C. After normalization in lysis buffer and cell disruption, 10 μL of total and soluble fractions were loaded onto SDS-PAGE gels. Four SDS-PAGE gels are displayed. Two 12.5% SDSPAGE gels are displayed in panel A and are separated by a vertical line. Two 15% SDS-PAGE gels are displayed in panel B and are separated by a vertical line. Protein construct number referring to Table 1 is indicated on the top. St1, St2, St3, and St4 refer to the different cultivation strategies detailed in Figure 1. M: prestained Precision Plus molecular weight markers (Bio-Rad Laboratories) as indicated on the left and on the right of gels; S: soluble proteins; T: total proteins. Stars indicate expressed fusion proteins at the expected molecular weight (see Table 1).
Table 2. OD600nm at Harvesting St2b
St3b
12.10
11.42
12.27
10.73
11.50
3.83
11.20
10.92
13.52
10.63
11.12
3.25
15.00
12.71
18.11
16.82
12.18
4
3.40
7.85
6.04
8.54
10.46
6.09
5
3.83
13.27
13.46
13.88
12.16
14.63
6
2.60
7.04
8.14
9.06
7.56
9.33
7
3.80
14.78
12.83
10.66
11.60
10.78
8
2.39
12.92
14.12
12.23
11.20
15.11
9
2.73
11.64
11.18
10.89
10.23
13.00
10
3.89
21.63
18.98
18.67
21.46
17.02
11
3.88
15.10
18.22
15.09
17.38
17.85
12
3.90
17.30
18.47
20.69
18.17
18.64
LBa
1
3.50
2 3
ZYM-5052a
St4b
St1b
#
a
OD600nm after cultivation in LB and ZYM-5052 medium corresponding to results presented in Figure 2. OD600nm after cultivation in ZYM-5052 for Strategies 1 to 4 corresponding to the results presented in Figure 3. b
Vol. 44 ı No. 1 ı 2008
Short Technical Reports
Figure 4. Comparison of OD600nm for cultures performed with either carbenicillin or ampicillin. Cultures were performed as described in Materials and Methods following Strategies 1 and 4 in the presence of either carbenicillin (100 μg/mL) or ampicillin (100 μg/mL). After growth, the final OD600nm was measured. The results obtained for six plasmids are displayed. Protein construct number referring to Table 1 is indicated at the bottom. Dotted bars: culture in presence of ampicillin; dashed bars: culture in presence of carbenicillin; white bars: culture following Strategy 1; gray bars: culture following Strategy 4. A: ampicillin; C: carbenicillin.
Comparison of Cultivation Strategies Protein expression screening was carried out at 25°C following the different strategies summarized in Figure 1. Briefly, Strategy 1 corresponded to the standard procedure where the culture was inoculated from a preculture that started from an isolated colony. This 5-day-long strategy included manual steps for colony picking and for OD600nm measurement of the preculture. This latter step can be automated to minimize risk of error during sample handling. In Strategy 2, the culture was directly inoculated from an isolated colony, circumventing the preculture step and saving 1 day. In Strategy 3, the manual step of colony picking was removed but the preculture step was still included for an experiment duration equivalent to that of Strategy 2. Finally, in Strategy 4, the culture was directly inoculated from the transformation mix, eliminating manual colony picking as well as preculture steps and saving 2 days. When the culture was directly started from the transformation mix, we assumed that 5 × 10⁴ cells received the target vector (efficiency of the competent cells: 1 × 10⁶ cfu/μg of plasmid) versus 1.5 × 10⁷ cells when the inoculum was from a preculture (estimating that 1 OD600nm Vol. 44 ı No. 1 ı 2008
corresponds to 3 × 10⁸ cells). Thus, eight doublings were required when starting with the transformation mix to reach the number of cells present in the culture at the starting point when using a preculture as inoculum. Moreover, since we did not know the number of cells present in an isolated colony, we decided to perform the cultures for 42 h at 25°C, whatever the strategy, to reach saturation. After cultivation, cells were harvested, normalized to an OD600nm = 20 into the lysis buffer, disrupted by sonication, and a comparable amount of total and soluble proteins were loaded onto SDS-PAGE (Figure 3). We observe that for Strategy 1, protein expression/solubility profiles are similar to those obtained for growth following standard procedure, as expected (Figure 3A, compare lanes 1–2, 10–11, 18–19, 26–27, 34–35, and 43–44 with Figure 2A, lanes 3–4, 8–9, 12–13, 16–17, 20–21, and 24–25; Figure 3B, compare lanes 1–2, 10–11, 18–19, 26–27, 34–35, and 43–44 with Figure 2A, lanes 28–29, 32–33, 37–38, 41–42, 45–46, and 49–50). The data presented on Figure 3 and the densitometric measurement (data not shown) show that the expression yield per cell was comparable whatever the strategy used for a given protein (Figure 3A, compare lanes 34, 36, 38, and 40 for an example). To determine if the cultivation strategy had an impact on protein solubility, we analyzed soluble proteins loaded onto SDS-PAGE. As previously observed for total protein, Figure 3 shows that the solubility profile for a given protein is identical to that obtained using the standard procedure, whatever the strategy used. Moreover, since final optical densities were comparable for a given construct (Table 2), we conclude that the total amount of expressed protein is similar, independent of the strategy used. Collectively, these results show that we can use the transformation mix directly to inoculate the culture, saving time and circumventing the errorprone step of colony picking, without impairing growth and the protein expression/solubility profile. Since our procedure is based on an elongated cultivation time to allow the culture inoculated directly from the
transformation mix to reach saturation, we worried whether the ampicillin was stable enough during the growth to maintain the selection. To address this question, we performed cultures for a subset of expression vectors harboring an ampicillin-resistant gene using another antibiotic belonging to the penicillin group: the carbenicillin. Carbenicillin is much more stable than ampicillin for the β-lactamase, the product encoded by the ampicillinresistance gene, maintaining a stronger selection for elongated cultivation. The cultures were performed in autoinducible medium for six protein constructs following the strategy mainly used in laboratories (Strategy 1) and the strategy we found to be suitable for automation (Strategy 4). Cell growths were comparable regardless of the antibiotic used, as illustrated in Figure 4, and the analysis of proteins loaded on SDS-PAGE showed that the amount of protein and expression/ solubility profiles were identical whatever the antibiotic used (data not shown). Those data confirm our results and demonstrate that ampicillin can be used for an extended growth of E. coli following our procedure. This result presents an economical interest for centers conducting high-throughput screening since ampicillin is 20 times cheaper than carbenicillin. In summary, we demonstrate that the basic step of performing E. coli cultivation, which traditionally consists of a multi-event protocol, can be simplified to a single event (Strategy 4), saving not only 2 days but minimizing manual handling and risk of error. This strategy can be easily used in any laboratory performing E. coli transformation for protein production and is fully compatible with automation for laboratories conducting large-scale programs such as SG initiatives (26). ACKNOWLEDGMENTS
We give special thanks to Rosalind Kim for her critical reading of the manuscript and for useful discussions. We thank Nick S. Berrow and Ray J. Owens from the Oxford Protein Production Facility, and Sophie Quevillon-Cheruel and Herman van Tilbeurgh from the www.biotechniques.com ı BioTechniques ı 105
Short Technical Reports
Institut de Biochimie et de Biophysique Moléculaire et Cellulaire for providing protein constructs. M.S. is funded through the Genopole program (RNG 2005-069). This work was supported by funds from SPINE EEC QLG2-CT2002-00988 and SPINE2-complexes, contract no. LSHG-CT-2006-031220. COMPETING INTERESTS STATEMENT
The authors declare no competing interests. REFERENCES 1. Yokoyama, S. 2003. Protein expression systems for structural genomics and proteomics. Curr. Opin. Chem. Biol. 7:39-43. 2. Busso, D., P. Poussin-Courmontagne, D. Rose, R. Ripp, A. Litt, J.C. Thierry, and D. Moras. 2005. Structural genomics of eukaryotic targets at a laboratory scale. J. Struct. Funct. Genomics 6:81-88. 3. Cornvik, T., S.L. Dahlroth, A. Magnusdottir, M.D. Herman, R. Knaust, M. Ekberg, and P. Nordlund. 2005. Colony filtration blot: a new screening method for soluble protein expression in Escherichia coli. Nat. Methods 2:507-509. 4. Vincentelli, R., S. Canaan, J. Offant, C. Cambillau, and C. Bignon. 2005. Automated expression and solubility screening of Histagged proteins in 96-well format. Anal. Biochem. 346:77-84. 5. Kapust, R.B. and D.S. Waugh. 1999. Escherichia coli maltose-binding protein is uncommonly effective at promoting the solubility of polypeptides to which it is fused. Protein Sci. 8:1668-1674. 6. Davis, G.D. and R.G. Harrison. 2003. Discovery of new fusion protein systems designed to enhance solubility in E. coli. Methods Mol. Biol. 205:141-154. 7. Marblestone, J.G., S.C. Edavettal, Y. Lim, P. Lim, X. Zuo, and T.R. Butt. 2006. Comparison of SUMO fusion technology with traditional gene fusion systems: enhanced expression and solubility with SUMO. Protein Sci. 15:182-189. 8. Braun, P., Y. Hu, B. Shen, A. Halleck, M. Koundinya, E. Harlow, and J. LaBaer. 2002. Proteome-scale purification of human proteins from bacteria. Proc. Natl. Acad. Sci. USA 99:2654-2659. 9. Hammarstrom, M., N. Hellgren, S. van Den Berg, H. Berglund, and T. Hard. 2002. Rapid screening for improved solubility of small human proteins produced as fusion proteins in Escherichia coli. Protein Sci. 11:313321. 10. Sorensen, H.P. and K.K. Mortensen. 2005. Advanced genetic strategies for recombinant protein expression in Escherichia coli. J. Biotechnol. 115:113-128. 106 ı BioTechniques ı www.biotechniques.com
11. Berrow, N.S., K. Büssow, B. Coutard, J. Diprose, M. Ekberg, G.E. Folkers, N. Levy, V. Lieu, et al. 2006. Recombinant protein expression and solubility screening in Escherichia coli: a comparative study. Acta Crystallogr. D Biol. Crystallogr. 62:12181226. 12. Kurtzman, A.L., S. Govindarajan, K. Vahle, J.T. Jones, V. Heinrichs, and P.A. Patten. 2001. Advances in directed protein evolution by recursive genetic recombination: applications to therapeutic proteins. Curr. Opin. Biotechnol. 12:361-370. 13. Hart, D.J. and F. Tarendeau. 2005. Combinatorial library approaches for improving soluble protein expression in Escherichia coli. Acta Crystallogr. D Biol. Crystallogr. 62:19-26. 14. Hunt, I. 2005. From gene to protein: a review of new and enabling technologies for multiparallel protein expression. Protein Expr. Purif. 40:1-22. 15. J. Struct. Funct. Genomics, 2004–2005, vol. 5–6. 16. Acta Crystallogr. D, vol. 62, Part 10. 17. Studier, F.W., A.H. Rosenberg, J.J. Dunn, and J.W. Dubendorff. 1990. Use of T7 RNA polymerase to direct expression of cloned genes. Methods Enzymol. 185:60-89. 18. Studier, F.W. 2005. Protein production by auto-induction in high density shaking cultures. Protein Expr. Purif. 41:207-234. 19. Segelke, B.W., J. Schafer, M.A. Coleman, T.P. Lekin, D. Toppani, K.J. Skowronek, K.A. Kantardjieff, and B. Rupp. 2004. Laboratory scale structural genomics. J. Struct. Funct. Genomics 5:147-157. 20. Busso, D., B. Delagoutte-Busso, and D. Moras. 2005. Construction of a set gatewaybased destination vectors for high-throughput cloning and expression screening in Escherichia coli. Anal. Biochem. 343:313321. 21. Sreenath, H.K., C.A. Bingman, B.W. Buchan, K.D. Seder, B.T. Burns, H.V. Geetha, W.B. Jeon, F.C. Vojtik, et al. 2005. Protocols for production of selenomethionine-labeled proteins in 2-L polyethylene terephthalate bottles using auto-induction medium. Protein Expr. Purif. 40:256-267. 22. Tyler, R.C., H.K. Sreenath, S. Singh, D.J. Aceti, C.A. Bingman, J.M. Markley, and B.G. Fox. 2005. Auto-induction medium for the production of [U-15N]- and [U-13C, U15N]-labeled proteins for NMR screening and structure determination. Protein Expr. Purif. 40:268-278. 23. Cabrita, L.D., W. Dai, and S.P. Bottomley. 2006. A family of E. coli expression vectors for laboratory scale and high throughput soluble protein production. BMC Biotechnol. 6:12. 24. Baneyx, F. 1999. Recombinant protein expression in Escherichia coli. Curr. Opin. Biotechnol. 10:411-421. 25. Villaverde, A. and M.M. Carrio. 2003. Protein aggregation in recombinant bacteria: biological role of inclusion bodies. Biotechnol. Lett. 25:1385-1395. 26. Busso, D., M. Stierlé, J.C. Thierry, and D. Moras. 2008. Automated recombinant protein expression screening in Escherichia
coli, p. 173-184. In B. Kobe, M.Guss, and T. Huber, Methods in Molecular Biology, vol. 426: Structural Proteomics: High-throughput Methods. Humana Press, Totowa, NJ.
Received 26 July 2007; accepted 3 October 2007. Address correspondence to Didier Busso, Plate-forme de Biologie et de Génomique Structurales, IGBMC, CNRS/INSERM/ Université Louis Pasteur, Parc d’Innovation, 1 rue Laurent Fries, BP10142, 67404 Illkirch cedex, France. e-mail:
[email protected] To purchase reprints of this article, contact:
[email protected]
Vol. 44 ı No. 1 ı 2008