From Real to Virtual: A Comparison of Input Devices for Percussion Tasks Mike Collicutt
Carmine Casciato
Marcelo M. Wanderley
Input Devices and Music Interaction Laboratory (IDMIL) Centre for Interdisciplinary Research on Music Media and Technology (CIRMMT) McGill University Montreal, QC, Canada
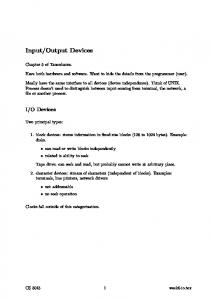
[email protected] [email protected] [email protected] In this paper, we decided to focus on percussion tasks: four instruments/devices were selected for a case study in evaluation and comparison: an acoustic tom drum, a Roland V-Drum electronic drum, the Miramax Radio Baton (RB) [7] [8] [9] and the Buchla Lightning II (LII) [9] [10] (see Figure 1). Due to both the LII’s and RB’s use of sticks and their ability to capture ballistic movements, these controllers may be and actually have been used as percussion instruments in various situations over the last two decades and are among a relatively small group of such devices which have stood the test of time and are still in production today1.
Abstract This paper presents an evaluation and comparison of four input devices for percussion tasks: a standard tom drum, Roland V-Drum, and two established examples of gestural controllers: the Buchla Lightning II, and the Radio Baton. The primary goal of this study was to determine how players’ actions changed when moving from an acoustic instrument like the tom drum, to a gestural controller like the Buchla Lightning, which bears little resemblance to an acoustic percussion instrument. Motion capture data was analyzed by comparing a subject’s hand height variability and timing accuracy across the four instruments as they performed simple musical tasks. Results suggest that certain gestures such as hand height amplitude can be adapted to these gestural controllers with little change and that in general subjects’ timing variability is significantly affected when playing on the Lightning and Radio Baton when compared to the more familiar tom drum and VDrum. Possible explanations and other observations are also presented.
Figure 1.The Radio Baton (left) and the Lightning II (right).
Keywords: Evaluation of Input Devices, Motion Capture, Buchla Lightning II, Radio Baton.
2. Motivation We present here an analysis of subjects performing simple musical tasks on these four instruments/controllers (herein referred to as ‘instruments’ for simplicity). These instruments provide a continuum from acoustic instrument (tom drum) to an instrument-like controller (V-Drum), to the RB and LII which can be considered borderline between instrument-inspired and alternate controllers [9] [11]. Each subject's timing accuracy and timing variability were evaluated when subjects performed a series of single strokes on these instruments. In addition, the amplitudes of the subjects' motions were compared across the four devices for the task. It was hypothesized that these
1. Introduction The development of new input devices for human movement tracking has paved the way for many new and novel gestural controllers for the production of music. While these devices continue to be created and refined, methods for formally evaluating and comparing different gestural controllers have only recently received significant attention [1] [2] [3] [4] [5]. But since the mapping of gestures to sound as well as the synthesis algorithms used with the controllers can be radically changed, the methods used to evaluate gestural controllers often depend on the context in which they are used; it is therefore interesting to have a specific musical context in mind [1].
1
Permission to make digital or hard copies of all or part of this work for personal or classroom use is granted without fee provided that copies are not made or distributed for profit or commercial advantage and that copies bear this notice and the full citation on the first page. To copy otherwise, to republish, to post on servers, or to redistribute to lists requires prior specific permission and/or a fee. NIME09, June 3-6, 2009, Pittsburgh, PA Copyright remains with the author(s).
1
Another recent device that has been increasingly used as a percussion controller is the Nintendo Wiimote. For example, [3] [4] performed an evaluation of the Wiimote along with the Roland Handsonic when performing percussive and other expressive musical tasks. We preferred not to include the Wiimote in this experiment since part of this work is to look on the long-term experience of expert performers with gestural controllers [6].
NIME 2009
measurements can provide insight into the following questions: • Which device performed the best in terms of timing accuracy, and were any differences in timing accuracies statistically significant? • How are subjects’ gestures modified when playing one device compared with another? • What are user opinions on the efficacy of the LII and RB as percussion instruments?
minima in the hand heights were assumed to correspond to strikes on the interface.
3. Experiment Three subjects from the classical percussion program in the Schulich School of Music, McGill University were selected for the experiment. Subjects were asked to perform two basic percussion tasks: single strokes (SSF), and double stroke rolls (DSR) in this order, both at forte volume and to a 120 bpm click track. Each subject performed between 16 and 32 strokes until they were satisfied with their performance. Subjects were given up to 10 minutes during setup of the different instruments to warm up and become familiar with them. This warm up time was considered sufficient to become familiar to the current instrument, while forgetting specific techniques used in any previous one. The exercises were completed on the tom drum, VDrum, RB, and LII (in this order) for all subjects. The three gestural controllers in this study were mapped to a single tom drum sample from the V-Drum sound engine. The strike velocity in the RB and LII were mapped to the volume of the sample. The volume of the tom drum and sound sample was subjectively adjusted by listening to the real-time sound during setup. A Polhemus Liberty 8 movement tracker was used to capture the subjects' actions during the tests. The sensors were placed on the back of each hand, on the forearms, biceps, back, and top of the head. Subjects were also recorded during the tests via a JVC GR-HD1 camera with a shutter speed of 1/1000 sec at 29.97 fps.
Figure 2. A screen-shot from the video recording of Subject 1 during one of the tests. From left to right are the Subject playing: the tom drum, V-Drum, RB, and LII.
In the majority of Subject 1's task performances however, it was clear that the minima of the hand heights did not actually correspond to a strike, but rather a strike occurred slightly before a minima at what looks like a slight 'glitch' in the hand height data. This is most likely a result of the stick rebounding off of the playing surface. In the case of the LII, this effect was also observed to exist, and was most likely from the subjects' sudden halting of their arm movements, resulting in a slight jitter. This effect is illustrated in Figure 3, however it was not observed in the other subjects (Figure 4): for Subjects 2 and 3, the minima do correspond to strikes.
4. Analysis
Figure 3. Polhemus hand height positions of Subject 1 during strikes on the LII (left) and tom drum (right). Here the strikes do not correspond to minima, but rather to the circled points.
Analysis of the subjects' performances was completed using the Polhemus data alongside the video recordings which were parsed, aligned side by side, and synchronized to allow for convenient comparison of techniques that subjects used (Figure 2). The Polhemus system tracks each sensor with 6 DoF (3 spatial, 3 rotational). Since the majority of subjects' motions were observed to be in the vertical direction of the forearms and hands for these exercises, only this data was used in the analysis of timing and amplitudes of gestures.
When searching for minima in data, it is clear that the actual minima might light somewhere between two data points, and so there is an inherent uncertainty in the location of each strike of ±16.5ms, as the sampling period for the Polhemus data is 33ms for all markers2. This uncertainty in time also transfers to an uncertainty in hand height, in particular, when picking out strikes and maxima of the data. An estimate for the uncertainty in hand height of 0.1cm has been assumed. This value is believed to still
4.1 Assumptions & Sources of Error Ideally, the Polhemus sensors would be attached directly to the striking element of the device. However, because they are wired, attaching them to the striking element would prove too intrusive to the subjects’ playing. Thus the
2
2
This relatively low sampling rate had to be used due to a limitation in the protocol used to send the Polhemus data through the network.
be conservative, but closer to the true uncertainty, which could not be determined without further tests.
position of a given strike, the maximum amplitude of the hand attained between this strike and the next, and the height of the next strike was devised and is given by:
Amp[n] = ( z max [n] − z min [n − 1]) + ( z max [n] − z min [n])
(1) Amp[n] = 2 z max [n] − z min [n − 1] − z min [n] Where zmax[n] is the peak hand height between two strikes for a given hand, and zmin[n-1]and zmin[n] are the hand heights at the location of the two strikes surrounding the maximum for a single hand. This gives a meaningful representation of the amplitude of the performers' gestures while still maintaining simplicity and ignoring fine-grain details dependent on the subjects' playing styles. Equation 1 only shows changes in the gestures of performers in a relative sense; it does not consider how the hand heights might change over time relative to some fixed marker like the ground. A qualitative analysis of how the absolute hand heights change is discussed in Section 5.2.
Figure 4. Polhemus hand height positions of Subject 3 during strikes on the LII (left) and tom drum (right). Subject 3 does not exhibit the ‘jitter’ like Subject 1.
It was also assumed that the first strike by a subject was timed perfectly to the click track. This was necessary because the click track was not synchronized with the Polhemus data or the video recordings, therefore creating an unknown constant offset in the timing data. This offset is presumed to be small, but variable between each exercise and each Subject.
5. Results Calculations of the mean timing accuracy of strokes and amplitude variation of gestures were completed for each of the subjects playing a SSF exercise on each of the four instruments. 5.1 Timing Accuracy of Strikes The accuracy of the strikes was first characterized in terms of the mean timing error relative to a 120 bpm click with a variability characterized by the standard deviation of these timing errors. Uncertainties in the means were substantially lower than the standard deviations, and so are not shown. Results are shown in Figure 5.
4.2 Data Analysis Motion capture data was obtained for the subjects performing the SSF and DSR musical tasks. Subjects' motions in this work were analyzed while performing the single strokes task only. A total of 16 consecutive strokes were analyzed for each subject on each of the instruments. 4.2.1 Timing Accuracy and Variability of Strokes The acquisition of minima from the hand height data was essentially done by a careful analysis of the hand height plots along with video recordings that made it fairly easy to pick out strike locations in the data by hand3. While this method does not account for the potential latency of each device, the latency is assumed to be constant for an instrument4. Since performers were given a substantial warm up period beforehand, it is assumed that the Subjects took the inherent latency into account when performing the tasks and attempted to match the instrument’s sound output to the click track. Thus the assumption on the first strike means that the following analysis is done relative to a click track that is simply offset from the one in the experiment by an amount equal to the device’s latency. Therefore as long as the latency is constant for each instrument, it is fully taken into account in the data.
Figure 5. Mean timing accuracy for each subject playing single forte strokes on each of the four instruments. Error bars are the standard deviations of timing errors. A negative timing error indicates an anticipation of the click track.
4.2.2 Amplitude Variability of Stroke Gestures The acquisition of data to determine the amplitude of gestures was done in the same way as for the acquisition of timing data. A simple formula relating the hand height
3 4
An analysis of the timing data was completed using oneway ANOVA [12]. Results showed that the differences in timing accuracy were very significant (p