ORGANIZA 10.1177/1094428104268027 Meade, Lautenschlager TIONAL RESEARCH / COMP ARISON METHODS OF IRT AND CFA
A Comparison of Item Response Theory and Confirmatory Factor Analytic Methodologies for Establishing Measurement Equivalence/Invariance ADAM W. MEADE
North Carolina State University
GARY J. LAUTENSCHLAGER University of Georgia
Recently, there has been increased interest in tests of measurement equivalence/ invariance (ME/I). This study uses simulated data with known properties to assess the appropriateness, similarities, and differences between confirmatory factor analysis and item response theory methods of assessing ME/I. Results indicate that although neither approach is without flaw, the item response theory–based approach seems to be better suited for some types of ME/I analyses. Keywords: measurement invariance; measurement equivalence; item response theory; confirmatory factor analysis; Monte Carlo
Measurement equivalence/invariance (ME/I; Vandenberg, 2002) can be thought of as operations yielding measures of the same attribute under different conditions (Horn & McArdle, 1992). These different conditions include stability of measurement over time (Golembiewski, Billingsley, & Yeager, 1976), across different populations (e.g., cultures—Riordan & Vandenberg, 1994; rater groups—Facteau & Craig, 2001), or over different mediums of measurement administration (e.g., Web-based survey administration versus paper-and-pencil measures; Taris, Bok, & Meijer, 1998). Under all three conditions, tests of ME/I are typically conducted via confirmatory factor analytic (CFA) methods. These methods have evolved substantially during the past 20 years and are widely used in a variety of situations (Vandenberg & Lance, 2000). HowAuthors’ Note: Special thanks to S. Bart Craig and three anonymous reviewers for comments on this article. Portions of this article were presented at the 18th annual conference of the Society of Industrial/ Organizational Psychology, Orlando, FL, April 2003. This article is based in part on a doctoral dissertation completed at the University of Georgia. Correspondence may be addressed to Adam W. Meade, North Carolina State University, Department of Psychology, Campus Box 7801, Raleigh, NC 27695-7801; e-mail:
[email protected]. Organizational Research Methods, Vol. 7 No. 4, October 2004 361-388 DOI: 10.1177/1094428104268027 © 2004 Sage Publications
361
362
ORGANIZATIONAL RESEARCH METHODS
ever, item response theory (IRT) methods have also been used for very similar purposes, and in some cases can provide different and potentially more useful information for the establishment of measurement invariance (Maurer, Raju, & Collins, 1998; McDonald, 1999; Raju, Laffitte, & Byrne, 2002). Recently, the topic of ME/I has enjoyed increased attention among researchers and practitioners (Vandenberg, 2002). One reason for this increased attention is a better understanding among the industrial/organizational psychological and organizational research communities of the importance of establishing ME/I, due in part to an increase in the number of articles and conference papers as well as an entire book (Schriesheim & Neider, 2001) committed to this subject. Along with an increase in the number of papers in print on the subject, a better understanding of the mechanics of the analyses required to establish ME/I has also led to an increase in general interest on the subject. As a result, recent organizational research studies have conducted ME/I analyses to establish ME/I for online versus paper-and-pencil inventories and tests (Donovan, Drasgow, & Probst, 2000; Meade, Lautenschlager, Michels, & Gentry, 2003), multisource feedback (Craig & Kaiser, 2003; Facteau & Craig, 2001; Maurer et al., 1998), comparisons of remote and on-site employee attitudes (Fromen & Raju, 2003), male and female employee responses (Collins, Raju, & Edwards, 2000), cross-race comparisons (Collins et al., 2000), cross-cultural comparisons (Ghorpade, Hattrup, & Lackritz, 1999; Riordan & Vandenberg, 1994; Ployhart, Wiechmann, Schmitt, Sacco, & Rogg, 2002; Steenkamp, & Baumgartner, 1998), and several longitudinal assessments (Riordan, Richardson, Schaffer, & Vandenberg, 2001; Taris et al., 1998). Vandenberg (2002) has made a call for increased research on ME/I analyses and the logic behind them, stating that “a negative aspect of this fervor, however, is characterized by unquestioning faith on the part of some that the technique is correct or valid under all circumstances” (p. 140). Similarly, Riordan et al. (2001) have called for an increase in Monte Carlo studies to determine the efficacy of the existing methodologies for investigating ME/I. In addition, although both Reise, Widaman, and Pugh (1993) and Raju et al. (2002) provide a thorough discussion of the similarities and differences in the CFA and IRT approaches to ME/I and illustrate these approaches using a data sample, they explicitly call for a study involving simulated data so that the two methodologies can be directly compared. The present study uses simulated data with a known lack of ME/I in an attempt to determine the conditions under which CFA and IRT methods result in different conclusions regarding the equivalence of measures. CFA Tests of ME/I
CFA analyses can be described mathematically by the formula xi = τi + λiξ + δi,
(1)
where xi is the observed response to item i, τi is the intercept for item i, λi is the factor loading for item i, ξ is the latent construct, and δi is the residual/error term for item i. Under this methodology, it is clear that the observed response is a linear combination of a latent variable, an item intercept, a factor loading, and some residual/error score for the item.
Meade, Lautenschlager / COMPARISON OF IRT AND CFA
363
Vandenberg and Lance (2000) conducted a thorough review of the ME/I literature and outlined a number of recommended nested model tests to detect a lack of ME/I. Researchers commonly first perform an omnibus test of covariance matrix equality (Vandenberg & Lance, 2000). If the omnibus test indicates that there are no differences in covariance matrices between the data sets, then the researcher may conclude that ME/I conditions hold for the data. However, some authors have questioned the usefulness of this particular test (Jöreskog, 1971; Muthén, as cited in Raju et al., 2002; Rock, Werts, & Flaugher, 1978) on the grounds that this test can indicate that ME/I is reasonably tenable when more specific tests of ME/I find otherwise. Regardless of whether the omnibus test of covariance matrix equality indicates a lack of ME/I, a series of nested model chi-square difference tests can be performed to determine possible sources of differences. To perform these nested model tests, both data sets (representing groups, time periods, etc.) are examined simultaneously, holding only the pattern of factor loadings invariant. In other words, the same items are forced to load onto the same factors, but parameter estimates themselves are allowed to vary between groups. This baseline model of equal factor patterns provides a chi-square value that reflects model fit for item parameters estimated separately for each situation and represents a test of configural invariance (Horn & McArdle, 1992). Next, a test of factor loading invariance across situations is conducted by examining a model identical to the baseline model except that factor loadings (i.e., the Λx matrix) are constrained to be equal across situations. The difference in the baseline and the more restricted model is expressed as a chi-square statistic with degrees of freedom equal to the number of freed parameters. Although subsequent tests of individual item factor loadings can also be conducted, this is seldom done in practice and is almost never done unless the overall test of differing Λx matrices is significant (Vandenberg & Lance, 2000). Subsequent to tests of factor loadings, Vandenberg and Lance (2000) recommend tests of item intercepts, which are constrained in addition to the factor loadings constrained in the prior step. Next, the researcher is left to choose additional tests to best suit his or her needs. Possible tests could include tests of latent means, tests of equal item uniqueness terms, and tests of factor variances and covariances, each of which are constrained in addition to those parameters constrained in previous models as meets the researcher’s needs.1 IRT Framework
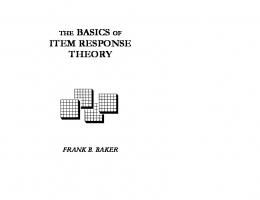
The IRT framework posits a log-linear, rather than a linear, model to describe the relationship between observed item responses and the level of the underlying latent trait, θ. The exact nature of this model is determined by a set of item parameters that are potentially unique for each item. The estimate of θ for a given person is based on observed item responses given the item parameters. Two types of item parameters are frequently estimated for each item. The discrimination or a parameter represents the slope of the item trace line (called an item characteristic curve [ICC] or item response function) that determines the relationship between the latent trait and an observed score (see Figure 1). The second type of item parameter is the item location or b parameter that determines the horizontal positioning of an ICC based on the inflexion point of a given ICC. For dichotomous IRT models, the b parameter is typically referred to as
364
ORGANIZATIONAL RESEARCH METHODS
1.0
P(theta)
0.8 0.6 0.4 0.2 0 -4.0
-3.0
-2.0
-1.0
0.0
1.0
2.0
3.0
4.0
Theta Figure 1: Item Characteristic Curve for Dichotomous Item
the item difficulty parameter (see Lord, 1980, or Embretson & Reise, 2000, for general introductions to IRT methods). In many cases, researchers will use multipoint response scales for items rather than simple dichotomous scoring. Although there are several IRT models for such polytomous items, one of the most commonly used models is the graded response model (GRM; Samejima, 1969). With the GRM, the relationship between the probability of a person with a latent trait, θ, endorsing any particular item response option can be depicted graphically via the item’s category response function (CRF). The formula for such a graph can be generally given by the equation Pik (θ s ) =
e a i (θ s − b ik + 1 )− e a i (θ s − b ik ) , (1 + e a i (θ s − b ik ) )(1 + e a i (θ s − b ik −1 ) )
(2)
where Pik(θs) represents the probability that an examinee (s) with a given level of a latent trait (θ) will respond to item i with category k. The exponential terms re replaced with 1 and 0 for the lowest and highest response options, respectively. The GRM can be considered a more general case of the models for dichotomous items mentioned above. An example of a graph of an item’s CRF can be seen in Figure 2, in which each line corresponds to the probability of response for each of the five category response options for the item. In the graph, the line to the far left corresponds to the probability
Meade, Lautenschlager / COMPARISON OF IRT AND CFA
365
1 0.9 0.8 0.7
P(theta)
0.6 0.5 0.4 0.3 0.2 0.1 0
-4.0 -3.0 -2.0 -1.0
0.0
1.0
2.0
3.0
4.0
Theta Figure 2: Category Response Functions for Likert-Type Item With Five Response Options
of responding to the lowest response option (i.e., Option 1). As the level of the latent trait approaches negative infinity, the probability of responding with the lowest response option approaches 1. Correspondingly, the opposite is true for the highest response option. Options 2 through 4 fall somewhere in the middle, with probability values first rising then falling with increasing levels of the underlying latent trait. In the GRM, the relationship between a participant’s level of a latent trait (θ) and a participant’s likelihood of choosing a progressively increasing observed response category is typically depicted by a series of boundary response functions (BRFs). An example of BRFs for an item with five response categories is given in Figure 3. The BRFs for each item are calculated using the function Pik* (θ s ) =
e a i (θ s − b ik ) 1+ e
a i ( θs − b ik )
,
(3)
where Pik*(θs) represents the probability that an examinee (s) with an ability level θ will respond to item i at or above category k. There are one fewer b parameters (one for each BRF) than there are item response categories, and as before, the a parameters represent item discrimination parameters. The BRFs are similar to the ICC shown in Figure 1, except that mi – 1 BRFs are needed for each given item. Only one a parameter is needed for each item because this parameter is constrained to be equal across BRFs within a
366
ORGANIZATIONAL RESEARCH METHODS
1 0.8
P(theta)
0.6 0.4 0.2 0 -4.0 -3.0 -2.0 -1.0
0.0
1.0
2.0
3.0
4.0
Theta Figure 3: Boundary Response Functions for Polytomous (Likert-Type) Item
given item, although ai parameters may vary across items under the GRM. Item a parameters are conceptually analogous, and mathematically related, to factor loadings in the CFA methodology (McDonald, 1999). Item b parameters have no clear equivalent in CFA, although CFA item intercepts that define observed value of the item when the latent construct equals zero are most conceptually similar to IRT b parameters. However, whereas only one item intercept can be estimated for each item in CFA, the IRTbased GRM estimates several b parameters per item. IRT tests of ME/I vary depending on the specific type of methodology used. In this study, we consider the likelihood ratio (LR) test. LR tests occur at the item level, and like CFA methods, maximum likelihood estimation is used to estimate item parameters that result in a value of model fit known as the fit function. In IRT, this fit function value is an index of how well the given model (in this case, a logistic model) fits the data as a result of the maximum likelihood estimation procedure used to estimate item parameters (Camilli & Shepard, 1994). The LR test involves comparing the fit of two models: a baseline (compact) model and a comparison (augmented) model. First, the baseline model is assessed in which all item parameters for all test items are estimated with the constraint that the item parameters for like items (e.g., Group 1–Item 1 and Group 2–Item 1) are equal across situations (Thissen, Steinberg, & Wainer, 1988, 1993). This compact model provides a baseline likelihood value for item parameter fit for the model. Next, each item is tested, one at a time, for differential item functioning (DIF). To test each item for DIF, sepa-
Meade, Lautenschlager / COMPARISON OF IRT AND CFA
367
rate data runs are performed for each item in which all like items’ parameter estimates are constrained to be equal across situations (e.g., time periods, groups of persons), with the exception of the parameters of the item being tested for DIF. This augmented model provides a likelihood value associated with estimating the item parameters for item i separately for each group. This likelihood value can then be compared to the likelihood value of the compact model in which parameters for all like items were constrained to be equal across groups. The LR test formula is given as follows: LRi =
LC , LAi
(4)
where LC is the likelihood function of the compact model (which contains fewer parameters) and LAi is the augmented model likelihood function in which item parameters of item i are allowed to vary across situations. The natural log transformation of this function can be taken and results in a test statistic distributed as χ2 under the null hypothesis χ2(M) = –2ln(LR) = –2lnLC + 2lnLA,
(5)
with M equal to the difference in the number of item parameters estimated in the compact model versus the augmented model (i.e., the degrees of freedom between models). This is a badness-of-fit index in which a significant result suggests the compact model fits significantly more poorly than the augmented model. To use the LR test, a χ2 value is calculated for each item in the test. Those items with significant χ2 values are said to exhibit DIF (i.e., using different item parameter estimates improves overall model fit). Although the LR approach is traditionally conducted by laborious multiple runs of the program MULTILOG (Thissen, 1991), we note that Thissen (2001) has made implementation of the LR approach much less taxing through his recent IRTLRDIF program. Thus, implementation of the approach presented here should be much more accessible to organizational researchers than has traditionally been the case. In addition, Cohen, Kim, and Wollack (1996) examined the ability of the LR test to detect DIF under a variety of situations using simulated data. Although the data simulated were dichotomous rather than polytomous in nature, they found that the Type I error rates of most models investigated fell within expected levels. In general, they concluded that the index behaved reasonably well. Study Overview
As stated previously, CFA and IRT methods of testing for ME/I are conceptually similar but distinct in practice (Raju et al., 2002; Reise et al., 1993). Each provides somewhat unique information regarding the equivalence of two samples (see Zickar & Robie, 1999, for an example). One of the primary differences between these methods is that the GRM in IRT makes use of a number of item b parameters to establish invariance between measures. Although CFA item intercepts are ostensibly most similar to these GRM b parameters, they are still considerably different in function as only
368
ORGANIZATIONAL RESEARCH METHODS
1
P(theta)
0.8 0.6 0.4 0.2 0 -4.0 -3.0 -2.0 -1.0 0.0
1.0
2.0
3.0
4.0
Theta Figure 4: Boundary Response Functions of Item Exhibiting b Parameter Differential Item Functioning Note. Group 2 boundary response functions in dashed line.
one intercept is estimated per item. Importantly, this difference in an item’s b parameters between groups theoretically should not be directly detected via commonly used CFA methods. Only through IRT should differences in only b parameters (see Figure 4) be directly identified, whereas differences in a parameters (see Figure 5) can theoretically be distinguished via either IRT or CFA methodology because a parameter differences should be detected by CFA tests of factor loadings. Data were simulated in this study in an attempt to determine if the additional information from b parameters available only via IRT-based assessments of ME/I allow more precise detection of ME/I differences than with CFA methods. As such, two hypotheses are stated below: Hypothesis 1: Data simulated to have differences in only b parameters will be properly detected as lacking ME/I by IRT methods but will exhibit ME/I with CFA-based tests. Hypothesis 2: Data with differing a parameters will be properly detected as lacking ME/I by both IRT and CFA tests.
Method Data Properties
A short survey consisting of six items was simulated to represent a single scale measuring a single construct. Although only one factor was simulated in this study to
Meade, Lautenschlager / COMPARISON OF IRT AND CFA
369
1
P(theta)
0.8 0.6 0.4 0.2 0 -4.0 -3.0 -2.0 -1.0 0.0
1.0
2.0
3.0
4.0
Theta Figure 5: Boundary Response Functions of Item Exhibiting a Parameter Differential Item Functioning Note. Group 2 boundary response functions in dashed line.
determine the efficacy of the IRT and CFA tests of ME/I under the simplest conditions, these results should generalize to unidimensional analyses of individual scales on multidimensional surveys. There were three conditions of the number of simulated respondents in this study: 150, 500, and 1,000. In addition, data were simulated to reflect responses of Likert-type items with five response options. Although samples of 150 are about half of the typically recommended sample size for LR analyses (Kim & Cohen, 1997) and somewhat lower than recommended for CFA ME/I analyses (Meade & Lautenschlager, 2004), there are several ME/I studies that have used similar sample sizes when conducting CFA ME/I analyses (e.g., Boles, Dean, Ricks, Short, & Wang, 2000; Luczak, Raine, & Venables, 2001; Martin & Friedman, 2000; Schaubroeck & Green, 1989; Schmitt, 1982; Vandenberg & Self, 1993; Yoo, 2002). Moreover, sample sizes of this magnitude are not uncommon in organizational research (e.g. Vandenberg & Self, 1993). To control for sampling error, 100 samples were simulated for each condition in the study. In a given scale, it is possible that any number of individual items may show a lack of ME/I. In this study, either two or four items were simulated to exhibit a lack of ME/I across situations (referred to as DIF items). Item a parameters and the four item b parameters were manipulated to simulate DIF. To manipulate the amount of DIF present, Group 1 item parameters were simulated then changed in various ways to simulate DIF in the Group 2 data. A random normal distribution, N[µ = –1.7, σ = 0.45], was sampled to generate the b parameter values for the lowest BRF for the Group 1 data.
370
ORGANIZATIONAL RESEARCH METHODS
Constants of 1.2, 2.4, and 3.6 were then added to the lowest threshold to generate the threshold parameters of the other three BRFs necessary to generate Likert-type data with five category response options. These constants were chosen to provide adequate separation between BRF threshold values and to result in a probable range from approximately –2.0 to +3.3 for each of the thresholds for a given item. The a parameter for each Group 1 item was also sampled from a random normal distribution, N[µ = 1.25, σ = 0.07]. This distribution was chosen to create item discrimination parameters that have a probable range of 1.0 to 1.5. All data were generated using the GENIRV item response generator (Baker, 1994). Simulating Differences in the Data
DIF was simulated by subtracting 0.25 from the Group 1 items’ a parameter for each DIF item to create the Group 2 DIF items’ a parameters. Although DIF items’ b parameters varied in several ways (to be discussed below), the overall magnitude of the variation was the same for each condition. Specifically, for each DIF item in which b parameters were varied, a value of 0.40 was either added to or subtracted from the Group 1b parameters to create the Group 2 b parameters. This value is large enough to cause a noticeable change in the sample θ estimates derived from the item parameters yet not so large as to potentially cause overlap with other item parameters (which are 1.2 units apart). Items 3 and 4 were DIF items for conditions in which only two DIF items were simulated, whereas Items 3, 4, 5, and 6 were DIF items for conditions of four DIF items. There were three conditions simulated in which items’ b parameters varied. In the first condition, only one b parameter differed for each DIF item. In general, this was accomplished by adding 0.40 to the items’ largest b value. This condition represents a case in which the most extreme option (e.g., a Likert-type rating of 5) is less likely to be used by Group 2 than Group 1. This type of difference may be seen, for example, in performance ratings if the culture of one department within an organization (Group 2) was to rarely assign the highest possible performance rating whereas another department (Group 1) is more likely to use this highest rating. Note that although such a change on a single b parameter will change the probability of response for an item response option at some areas of θ, this condition was intended to simulate relatively small differences in the data. In a second condition, each DIF item’s largest two b parameters were set to differ between groups. Again, this was accomplished by adding 0.40 to the largest two b parameters for the Group 2 DIF items. This simulated difference again could reflect generally more lenient performance ratings for one group (Group 1) than another (Group 2). In a third condition, each DIF item’s two most extreme b parameters were simulated to differ between groups. This was accomplished by adding 0.40 to the item’s largest b parameter while simultaneously subtracting the same value from the item’s lowest b parameter. This situation represents the case in which persons in Group 2 are less likely to use the more extreme response options (1 and 5) than are persons in Group 1. Such response patterns may be seen when comparing the results of an organizational survey for a multinational organization across cultures as there is some evidence that there are differences in extreme response tendencies by culture (Clarke, 2000; Hui & Triandis, 1989; Watkins & Cheung, 1995).
Meade, Lautenschlager / COMPARISON OF IRT AND CFA
371
Data Analysis
Data were analyzed by both CFA and IRT methods. The multigroup feature of LISREL 8.51 (Jöreskog & Sörbom, 1996), in which Group 1 and Group 2 raw data are input into LISREL separately, was used for all CFA analyses. As outlined in Vandenberg and Lance (2000) and summarized earlier, five models were examined to detect a lack of ME/I. In the first model (Model 1), omnibus tests of covariance matrix equality were conducted. Second, simulated Group 1 and Group 2 data sets were analyzed simultaneously, yet item parameters (factor loadings and intercepts), the factor’s variance, and latent means were allowed to vary across situations (Model 2). Model 2 served as a baseline model with which nested model chisquare difference tests were then conducted to evaluate the significance of the decrement in fit for each of the more constrained models described below. A test of differences in factor loadings between groups was conducted by examining a model identical to the baseline model except that factor loadings for like items were constrained to be equal across situations (e.g., Group 1–Item 1 = Group 2–Item 1, etc.; Model 3). Next, equality of item intercepts was tested across situations by placing similar constraints across like items (Model 4). Last, a model was examined in which factor variances were constrained across Group 1 and Group 2 samples (Model 5) as typical in ME/I tests of longitudinal data (Vandenberg & Lance, 2000). An alpha level of .05 was used for all analyses. As is customary in CFA studies of ME/I, if the CFA omnibus test of ME/I indicated that the data were not equivalent between groups, nested model analyses continued only until an analysis identified the source of the lack of ME/I. Thus, no further scale-level analyses were conducted after one specific test of ME/I was significant. Data were also analyzed using IRT-based LR tests (Thissen et al., 1988, 1993). These analyses were performed using the multigroup function in MULTILOG (Thissen, 1991). Unidimensional IRT analyses require a test of dimensionality before analyses can proceed. However, as the data simulated in this study were known to be unidimensional, we forwent these tests. Also note that because item parameters for the two groups are estimated simultaneously by MULTILOG for LR analyses, there is no need for an external linking program. A p value of .05 was used for all analyses. One issue in comparing CFA tests and IRT tests is that CFA tests typically occur at the scale level, whereas IRT tests occur at the item level. As such, an index called AnyDIF was computed such that if any of the six scale items was found to exhibit DIF with the LR index, the AnyDIF index returned a positive value (+1.0). If none of the items were shown to exhibit DIF, the AnyDIF index was set to zero. The sum of this index across the 100 samples represents the percentage of samples detected as lacking ME/I. This index provides a scale-level IRT index suitable for comparisons to the CFA ME/I results. Another way in which CFA and IRT analyses can be directly compared is by conducting item-level tests for CFA analyses (Flowers, Raju, & Oshima, 2002). As such, we tested the invariance of each item individually by estimating one model per item in which the factor loading for that item was constrained to be invariant across samples while the factor loadings for all other items were allowed to vary across samples. These models were each compared to the baseline model in which all factor loadings were free to vary between samples. Thus, the test for each item comprised a nested model test with one degree of freedom. One issue involved with these tests was the
372
ORGANIZATIONAL RESEARCH METHODS
choice of referent item. As in all other CFA models, the first item, known to be invariant, was chosen as the referent item for all tests except when the first item itself was tested. For tests of Item 1, the second item (also known to be invariant) was chosen as the referent indicator. Another issue in conducting item-level CFA tests is whether the tests should be nested. On one hand, it is unlikely that organizational researchers would conduct itemlevel tests of factor loadings unless there was evidence that there were some differences in factor loadings for the scale as a whole. Thus, to determine how likely researchers would be in accurately assessing partial metric invariance, it would seem that these tests should be conducted only if both the test of equality of covariance matrices and factor loadings identified some source of difference in the data sets. However, such an approach would make direct comparisons to IRT tests problematic as IRT tests are conducted for every item with no prior tests necessary. Conversely, not nesting these tests would misrepresent the efficacy of CFA item-level tests as they are likely to be used in practice. As direct CFA and IRT comparisons were our primary interests, we chose to conduct item-level CFA tests for every item in the data set. However, we have also attempted to report results that would be obtained if a nested approach were used. Last, for item-level IRT and CFA tests, true positive (TP) rates were computed for each of the 100 samples in each condition by calculating the number of the items simulated to have DIF that were successfully detected as DIF items divided by the total number of DIF items generated. False positive (FP) rates were calculated by taking the number of items flagged as DIF items divided by the total number of items simulated to not contain DIF. These TP and FP rates were then averaged for all 100 samples in each condition. True and false negative (TN and FN) rates can be computed from TP and FP rates (i.e., TN = 1.0 – FP, and FN = 1.0 – TP).
Results Hypothesis 1
Hypothesis 1 for this study was that data simulated to have differences in only b parameters would be accurately detected as lacking ME/I by IRT methods but would exhibit ME/I with CFA-based tests. Six conditions in which only b parameters differed between data sets provided the central test of this hypothesis. Table 1 presents the number of samples in which a lack of ME/I was detected for the analyses. For these conditions, the CFA omnibus test of ME/I was largely inadequate at detecting a lack of ME/I. This was particularly true for sample sizes of 150 in which no more than 3 samples per condition were identified as exhibiting a lack of ME/I as indexed by the omnibus test of covariance matrices. For Conditions 6 (highest two b parameters) and 7 (extreme b parameters) with sample sizes of 500 and 1,000, the CFA scale-level tests were better able to detect some differences between the data sets; however, the source of these differences that was identified by specific tests of ME/I seemed to vary in unpredictable ways with item intercepts being detected as different somewhat frequently in Condition 6 and rarely in Condition 7 (see Table 1). Note that the results in the table indicate the number of samples in which specific tests of ME/I were significant. However, because of the nested nature of the analyses, these numbers do not
373
0 DIF items No A DIF No B DIF 2 DIF items No A DIF Highest B DIF 2 DIF items No A DIF Highest 2 B DIF 2 DIF items No A DIF Extremes B DIF 4 DIF items No A DIF Highest B DIF 4 DIF items No A DIF Highest 2 B DIF 4 DIF items No A DIF Extremes B DIF
Description Σ
150 1 500 2 1,000 0 150 2 500 4 1,000 1 150 0 500 21 1,000 9 150 3 500 33 1,000 20 150 1 500 7 1,000 9 150 1 500 61 1,000 90 150 2 500 80 1,000 100
N 1 0 0 2 0 0 0 2 0 3 3 1 0 1 2 0 2 7 0 3 3
Λx 0 0 0 0 0 0 0 17 3 0 3 0 0 2 0 0 35 10 0 6 0
Tx 0 1 0 0 1 0 0 1 0 0 15 4 0 3 0 0 16 32 0 43 49
Φ
CFA Scale-Level Analyses
13 4 1 11 9 4 7 6 4 13 6 5 4 4 0 6 5 1 12 4 2
CFA 0 1 1 2 0 0 3 1 0 5 0 1 1 1 1 4 1 6 2 0 2
IRT
Item 1
12 5 1 8 9 3 5 6 4 12 8 5 3 4 0 5 4 1 10 4 1
CFA 4 6 5 4 5 7 2 20 7 6 7 12 0 17 14 0 52 22 1 11 18
IRT
Item 2
2 6 1 5 3 2 5 2 3 12 1 6 2 3 0 6 3 2 11 2 2
CFA 19 0 1 21 13 52 0 83 82 56 67 100 22 8 56 1 68 73 44 60 100
IRT
Item 3
9 9 7 15 3 1 21 1 2 23 0 3 17 2 1 9 1 0 21 1 1
3 0 1 15 76 67 65 98 100 33 89 99 14 66 67 46 89 99 29 86 99
CFA IRT
Item 4
1 2 2 0 4 5 0 4 1 1 2 5 0 5 3 0 2 10 0 8 8
3 7 7 4 16 2 3 33 2 3 7 4 8 80 79 12 74 96 53 93 100
CFA IRT
Item 5
2 6 1 0 6 3 1 6 1 3 5 3 1 4 1 0 0 3 0 1 0
CFA
4 13 16 2 7 27 6 2 41 7 11 13 21 82 63 0 95 100 23 98 100
IRT
Item 6
23 16 8 27 11 10 29 18 7 35 13 8 22 10 4 19 10 13 30 11 11
CFA
31 23 25 41 83 96 71 100 100 78 97 100 51 100 100 52 100 100 89 100 100
IRT
Any DIF
Note. CFA = confirmatory factor analytic; Σ = null test of equal covariance matrices; Λx = test of equal factor loadings; Tx = test of equal item intercepts; Φ = test of equal factor variances; IRT = item response theory; DIF = differential item functioning. Items simulated to be DIF items are in bold. CFA scale-level analyses are fully nested (e.g., no Tx test if test of Λx is significant). CFA item-level tests are not nested and were conducted for all samples.
7
6
5
4
3
2
1
Condition Number
Item-Level Analyses
Table 1 Number of Samples (of 100) in Each Condition in Which There Was a Significant Lack of Measurement Equivalence/Invariance for Data With Only Differing b Parameters
374
ORGANIZATIONAL RESEARCH METHODS
reflect the percentage of analyses that were significant, as analyses were not conducted if an earlier specific test of ME/I indicated that the data lacked ME/I. The LR tests reveal an entirely different scenario. LR tests were largely effective at detecting not only some lack of ME/I for these conditions, but in general, the specific items with simulated DIF (three and four or three to six, depending on whether two or four items were simulated to exhibit DIF) were identified with a greater degree of success and were certainly identified as DIF items more often than were non-DIF items. However, the accuracy of detection of these items varied considerably depending on the conditions simulated. For instance, detection was typically more successful when two item parameters differed than when only one differed. Not unexpectedly, detection was substandard for sample sizes of 150 but tended to improve considerably for larger sample sizes in most cases. Like their scale-level counterparts, nonnested CFA item-level analyses were also lacking in their ability to detect a lack of ME/I when it was known to exist. In general, Item 4 (a DIF item) was slightly more likely to be detected as a DIF item than the other items, although there were little differences in detection rates for other DIF and nonDIF items. The number of DIF items simulated seemed to matter little for these analyses, though surprisingly, more samples were detected as lacking ME/I when sample sizes were 150 as compared to 500 or 1,000. Also, the detection rates for the nonnested CFA item-level tests were much lower than their LR test counterparts when only b parameters were simulated to differ (see Table 1). Hypothesis 2
Two conditions (Conditions 8 and 9) provided a test of Hypothesis 2, that is, data with differing a parameters will be detected as lacking ME/I by both IRT and CFA tests. For these conditions, the CFA scale-level analyses performed somewhat better though not as well as hypothesized (see Table 2). When there were only two DIF items (Condition 8), only 25 and 26 samples (out of 100) were detected as having some difference by the CFA omnibus test of equality of covariance matrices for sample sizes of 150 and 500, respectively, although this number was far greater for sample sizes of 1,000. For those samples with differences detected by the CFA omnibus test, factor loadings were identified as the source of the simulated difference in 10 samples or fewer for each of the conditions. These results were unexpected given the direct analogy and mathematical link between IRT a parameters and factor loadings in the CFA paradigm (McDonald, 1999). The LR tests of DIF performed better for these same conditions. In general, the LR test was very effective at detecting at least one item as a DIF item in these conditions. However, the accuracy of detecting the specific items that were DIF items was somewhat dependent on sample size. For example, for sample sizes of 1,000, all DIF items were detected as having differences almost all of the time. However, for sample sizes of 150, detection of DIF items was as low as 3% for Condition 9 (four DIF items), although other DIF items in that same condition were typically detected at a much higher rate (thus a higher AnyDIF index). Oddly enough, for Items 3 and 4 (DIF items), detection did not appear to be better for samples of 500 than for samples of 150, although detection was much better for the largest sample size for Items 5 and 6 (Condition 9).
375
0 DIF items No A DIF No B DIF 2 DIF items A DIF No B DIF 4 DIF items A DIF No B DIF
Description Σ
150 1 500 2 1,000 0 150 25 500 26 1,000 94 150 29 500 91 1,000 100
N 1 0 0 10 1 3 6 6 5
Λx 0 0 0 0 6 0 1 8 2
Tx 0 1 0 0 13 11 7 48 39
Φ 13 4 1 9 1 4 12 3 5
CFA 0 1 1 4 3 2 2 5 5
IRT
Item 1
12 5 1 6 2 4 12 3 4
CFA 4 6 5 4 2 9 5 4 12
IRT
Item 2
2 6 1 11 2 5 10 1 0
CFA 19 0 1 78 64 100 80 65 99
IRT
Item 3
9 9 7 12 2 2 24 2 1
3 0 1 30 36 100 44 43 99
CFA IRT
Item 4
1 2 2 1 1 4 1 9 12
3 7 7 3 14 9 3 98 100
CFA IRT
Item 5
2 6 1 0 4 2 2 2 8
CFA
4 13 16 1 11 17 14 56 97
IRT
Item 6
23 16 8 28 10 11 37 16 24
CFA
31 23 25 89 85 100 89 100 100
IRT
Any DIF
Note. CFA = confirmatory factor analytic; Σ = null test of equal covariance matrices; Λx = test of equal factor loadings; Tx = test of equal item intercepts; Φ = test of equal factor variances; IRT = item response theory; DIF = differential item functioning. Items simulated to be DIF items are in bold. CFA scale-level analyses are fully nested (e.g., no Tx test if test of Λx is significant). CFA item-level tests are not nested and were conducted for all samples.
9
8
1
Condition Number
CFA Scale-Level Analyses
Item-Level Analyses
Table 2 Number of Samples (of 100) in Each Condition in Which There Was a Significant Lack of Measurement Equivalence/Invariance for Data With Only Differing a Parameters
376
ORGANIZATIONAL RESEARCH METHODS
Item-level CFA tests again were insensitive to this type of DIF, even though we hypothesized that these data would be much more readily detected as lacking ME/I than data in which only b parameters differed. Again, paradoxically, smaller samples were associated with more items being detected as DIF items, although manipulations to the properties of specific items seemed to have little bearing on which item was detected as lacking ME/I. One interesting finding was that for some samples in which both the CFA scale-level omnibus test indicated a lack of ME/I and item-level tests of factor loadings also indicated differences between samples, the scale-level test of factor loadings was not significant. Other Analyses
When both a and b parameters were simulated to differ, the LR test appeared to detect roughly the same number of samples with DIF as for conditions in which only b parameters differed (see Table 3). The exception to this rule can be seen in comparing Conditions 4 and 12 and also Conditions 7 and 15. For these conditions (two extreme b parameters different), detection rates are quite poor for samples of 500 when the a parameters also differ (Conditions 12 and 15) as compared to Conditions 4 and 7 where they are not different. The CFA omnibus test, on the other hand, appeared to perform better as more differences were simulated between data sets (see Table 3). However, for all results, when the CFA omnibus test was significant, very often no specific test of the source of the difference supported a lack of ME/I. Furthermore, when a specific difference was detected, it was typically a difference in factor variances. Vandenberg and Lance (2000) noted that use of the omnibus test of covariance matrices is largely at the researcher’s discretion. CFA item-level tests again were ineffective at detecting a lack of ME/I despite a manipulation of both a and b parameters for these data (see Table 3). As before, smaller samples tended to be associated with more items being identified as DIF items. It is important to note that when there were no differences simulated between the Group 1 and Group 2 data sets (Condition 1), the LR AnyDIF index detected some lack of ME/I in many of the conditions (see Table 1, Condition 1). On the other hand, detection rates in the null condition were very low for the CFA omnibus test (as would be expected for samples with no differences simulated). For the LR AnyDIF index, the probability of any item being detected as a DIF item was higher than desired when no DIF was present. This result for the LR test is similar to the inflated FP rate reported by McLaughlin and Drasgow (1987) for Lord’s (1980) chi-square index of DIF (of which the LR test is a generalization). The inflated Type I error rate indicates a need to choose an appropriately adjusted alpha level for LR tests in practice. In this study, an alpha level of .05 was used to test each item in the scale with the LR test. As a result, the condition-wise error rate for the LR AnyDIF index was .30, which clearly lead to an inflated LR AnyDIF index Type I error rate. It is interesting to note the LR AnyDIF detection rates varied by item number and sample size, with Item 1 rarely being detected as a DIF item in any condition and false positives more likely for larger sample sizes (see Table 1, Condition 1). A more accurate indication of the efficacy of both the LR index and the item-level CFA analyses can be found by looking at the item-level TP and FP rates found in Table 4. Across all conditions, the LR TP rates were considerably higher for the larger sam-
377
0 DIF items No A DIF No B DIF 2 DIF items A DIF Highest B DIF 2 DIF items A DIF Highest 2 B DIF 2 DIF items A DIF Extremes B DIF 4 DIF items A DIF Highest B DIF 4 DIF items A DIF Highest 2 B DIF 4 DIF items A DIF Extremes B DIF
Description 150 500 1,000 150 500 1,000 150 500 1,000 150 500 1,000 150 500 1,000 150 500 1,000 150 500 1,000
N 1 2 0 9 10 29 11 5 7 7 2 2 14 48 98 4 34 76 7 26 59
Σ 1 0 0 5 1 0 9 1 1 5 1 1 3 2 5 3 9 16 7 10 17
Λx 0 0 0 0 3 1 0 2 4 0 0 0 0 6 0 0 12 6 0 1 1
Tx 0 1 0 1 6 9 1 2 2 0 1 0 4 34 62 0 13 49 0 14 40
Φ 13 4 1 12 7 4 4 4 1 9 3 6 5 6 2 6 4 6 7 3 2
CFA 0 1 1 5 1 1 2 2 1 2 1 1 4 5 1 4 3 4 7 1 1
IRT
Item 1
12 5 1 10 6 3 4 5 1 9 3 6 5 7 2 6 4 6 7 3 2
CFA 4 6 5 6 9 8 3 11 7 1 5 10 6 17 8 4 42 17 2 3 14
IRT
Item 2
2 6 1 13 1 4 13 5 14 12 3 9 11 2 5 12 5 17 13 5 14
CFA 19 0 1 79 27 99 33 68 89 74 14 90 87 35 99 33 59 88 76 12 91
IRT
Item 3
9 9 7 19 3 2 24 2 1 28 0 4 19 1 1 21 2 1 29 2 4
3 0 1 15 48 62 63 78 98 24 15 30 23 43 74 60 70 93 21 14 30
CFA IRT
Item 4
1 2 2 0 1 2 0 4 2 2 1 2 1 13 14 2 12 25 2 14 29
3 7 7 1 22 3 1 30 7 3 12 6 1 95 98 1 69 95 11 79 97
CFA IRT
Item 5
2 6 1 2 2 3 2 4 3 2 6 2 2 1 10 2 1 9 3 2 13
CFA
4 13 16 3 5 30 2 4 26 3 15 12 30 61 64 3 51 90 10 39 93
IRT
Item 6
23 16 8 33 12 7 29 12 19 38 11 15 30 18 23 32 19 42 41 19 41
CFA
31 23 25 84 76 100 76 95 100 85 48 95 96 100 100 76 99 100 86 86 100
IRT
Any DIF
Note. CFA = confirmatory factor analytic; Σ = null test of equal covariance matrices; Λx = test of equal factor loadings; Tx = test of equal item intercepts; Φ = test of equal factor variances; IRT = item response theory; DIF = differential item functioning. Items simulated to be DIF items are in bold. CFA scale-level analyses are fully nested (e.g., no Tx test if test of Λx is significant). CFA item-level tests are not nested and were conducted for all samples.
15
14
13
12
11
10
1
Condition Number
CFA Scale-Level Analyses
Item-Level Analyses
Table 3 Number of Samples (of 100) in Each Condition in Which There Was a Significant Lack of Measurement Equivalence/Invariance for Data With Differing a and b Parameters
378
ORGANIZATIONAL RESEARCH METHODS
ple sizes than the N = 150 sample size for almost all conditions. FP rates were slightly higher for sample sizes of 500 and 1,000 than for 150. However, the FP rate was typically below the 0.15 range even for the 1,000 case sample sizes. In sum, it appears that the LR index was very good at detecting some form of DIF between groups. However, correct identification of the source of DIF was more problematic for this index, particularly for sample sizes of 150. Interestingly, CFA TP rates were higher for sample sizes of 150 than 500 or 1,000, although in general, TP rates were very low for CFA item-level analyses. When CFA item-level analyses were nested (i.e., conducted only after significant results from the omnibus test of covariance matrices and scale-level factor loadings), TP rates were very poor indeed. As these nested model item-level comparisons reflect the scenario under which these analyses would be most likely conducted, it appears highly unlikely that differences in items would be correctly identified to establish partial invariance. Tables 5 through 8 summarize the impact of different simulation conditions collapsing across other conditions in the study. For instance, Table 5 shows the results of different simulations of b parameter differences, collapsing across conditions in which there both was and was not a parameter differences, both two and four DIF items, and all sample sizes. Although statistical interpretation of these tables is akin to interpreting a main effect in the presence of an interaction, a more clinical interpretation seems feasible. These tables seem to indicate that simulated differences are more readily detected when a parameters are present than not present (Table 6), more DIF items are more readily detected than fewer DIF items (Table 7), and sample size has a clear effect on detection rates (Table 8).
Discussion In this study, it was shown that, as expected, CFA methods of establishing ME/I were inadequate at detecting items with differences in only b parameters. However, contrary to expectations, the CFA methods were also largely inadequate at detecting differences in item a parameters. These latter results question the seemingly clear analogy between IRT a parameters and factor loadings in a CFA framework. In this study, the IRT-based LR tests were somewhat better suited for detecting differences when they were known to exist. However, the LR tests also had a somewhat low TP rate for sample sizes of 150. This is somewhat to be expected, as a sample size of 150 (per group) is extremely small by IRT standards. Examination of the multilog output revealed that the standard errors associated with parameter estimates with this sample size are somewhat larger than would be desired. However, we felt that it was important to include this sample size as it is commonly found in ME/I studies and in organizational research in general. Although the focus of this article was on comparing the LR test and the CFA scalelevel tests as they are typically conducted, one extremely interesting finding is that the item-level CFA tests often were significant, indicating a lack of metric invariance when omnibus tests of measurement invariance indicated that there were no differences between the groups. However, unlike CFA scale-level analyses, items were significant more often with small sample sizes than large sample sizes. These results may seem somewhat paradoxical given the increased power associated with larger sample (text continues on p. 382)
379
0 DIF items, no A DIF, no B DIF
2 DIF items, no A DIF, highest B DIF
2 DIF items, no A DIF, highest 2 B DIF
2 DIF items, no A DIF, extremes B DIF
2 DIF items, A DIF, no B DIF
2 DIF items, A DIF, highest B DIF
2 DIF items, A DIF, highest 2 B DIF
2 DIF items, A DIF, extremes B DIF
2
3
4
5
6
7
8
Description
1
Condition Number 150 500 1,000 150 500 1,000 150 500 1,000 150 500 1,000 150 500 1,000 150 500 1,000 150 500 1,000 150 500 1,000
N
0.01 0.00 0.00 0.00 0.00 0.00 0.02 0.00 0.01 0.03 0.00 0.01 0.03 0.00 0.00 0.04 0.01 0.00 0.04 0.00 0.00
TP 0.00 0.00 0.00 0.00 0.00 0.00 0.00 0.01 0.00 0.01 0.01 0.01 0.01 0.00 0.02 0.01 0.01 0.00 0.02 0.01 0.00 0.00 0.00 0.01
FP
CFA Nested
0.10 0.03 0.02 0.13 0.02 0.03 0.18 0.01 0.05 0.12 0.02 0.04 0.16 0.02 0.03 0.19 0.04 0.08 0.20 0.02 0.07
TP 0.06 0.05 0.02 0.05 0.07 0.04 0.03 0.06 0.03 0.07 0.05 0.05 0.04 0.02 0.04 0.06 0.04 0.03 0.03 0.04 0.02 0.06 0.03 0.04
FP
CFA Nonnested
Table 4 True Positive and True Negative Rates for Item Response Theory Likelihood Ratio (LR) Test
0.18 0.45 0.60 0.33 0.91 0.91 0.45 0.78 1.00 0.54 0.50 1.00 0.47 0.38 0.81 0.48 0.73 0.94 0.49 0.15 0.60
TP
LR
(continued)
0.06 0.05 0.05 0.03 0.07 0.09 0.04 0.14 0.13 0.05 0.06 0.08 0.03 0.08 0.09 0.04 0.09 0.11 0.02 0.12 0.10 0.02 0.08 0.07
FP
380
4 DIF items, no A DIF, highest 2 B DIF
4 DIF items, no A DIF, extremes B DIF
4 DIF items, A DIF, no B DIF
4 DIF items, A DIF, highest B DIF
4 DIF items, A DIF, highest 2 B DIF
4 DIF items, A DIF, extremes B DIF
10
11
12
13
14
15
150 500 1,000 150 500 1,000 150 500 1,000 150 500 1,000 150 500 1,000 150 500 1,000 150 500 1,000
N 0.00 0.00 0.00 0.00 0.01 0.01 0.00 0.02 0.01 0.02 0.01 0.02 0.01 0.01 0.02 0.01 0.02 0.05 0.02 0.03 0.07
TP 0.00 0.00 0.00 0.00 0.00 0.01 0.00 0.01 0.00 0.02 0.00 0.01 0.00 0.00 0.01 0.00 0.01 0.02 0.02 0.03 0.02
FP 0.05 0.04 0.01 0.04 0.02 0.04 0.08 0.03 0.03 0.09 0.04 0.05 0.08 0.04 0.08 0.09 0.05 0.13 0.12 0.06 0.15
TP 0.04 0.04 0.00 0.06 0.05 0.01 0.11 0.04 0.02 0.12 0.03 0.05 0.05 0.06 0.02 0.06 0.04 0.06 0.07 0.03 0.02
FP
CFA Nonnested
Note. CFA = confirmatory factor analytic; TP = true positive; FP = false positive; DIF = differential item functioning.
4 DIF items, no A DIF, highest B DIF
Description
9
Condition Number
CFA Nested
Table 4 (continued)
0.16 0.59 0.66 0.15 0.82 0.92 0.37 0.84 1.00 0.35 0.66 0.99 0.35 0.59 0.84 0.24 0.62 0.92 0.30 0.36 0.78
TP
LR
0.01 0.09 0.08 0.02 0.27 0.14 0.02 0.06 0.10 0.04 0.05 0.09 0.05 0.11 0.05 0.04 0.23 0.11 0.05 0.02 0.08
FP
Meade, Lautenschlager / COMPARISON OF IRT AND CFA
381
Table 5 Mean and Standard Deviation of the Number of Samples Detected for Conditions of Simulated Differences in b Parameters (of 100 Samples/Condition) Type of B DIF
Analysis
None
CFA omnibus test CFA AnyDIF LR AnyDIF
Highest b
Samples
M
SD
600 600 600
60.83 21.00 93.83
37.56 10.58 6.91
CFA omnibus test CFA AnyDIF LR AnyDIF
1,200 1,200 1,200
19.33 17.25 85.58
28.27 9.60 20.32
Highest 2 bs
CFA omnibus test CFA AnyDIF LR AnyDIF
1,200 1,200 1,200
26.58 20.75 89.08
31.63 10.32 16.22
Extreme bs
CFA omnibus test CFA AnyDIF LR AnyDIF
1,200 1,200 1,200
28.42 22.75 88.67
33.68 13.15 14.83
Note. DIF = differential item functioning; CFA = confirmatory factor analytic; LR = likelihood ratio. Summary statistics for the “none” conditions above include conditions for which a parameters were simulated to differ but not the null condition (Condition 1).
Table 6 Mean and Standard Deviation of the Number of Samples Detected for Conditions of Simulated Differences in a Parameters A DIF?
Analysis
Samples
M
SD
No
CFA omnibus test CFA AnyDIF LR AnyDIF
1,800 1,800 1,800
24.67 16.00 86.56
33.82 9.03 19.84
Yes
CFA omnibus test CFA AnyDIF LR AnyDIF
2,400 2,400 2,400
33.88 23.63 90.21
33.78 11.14 12.40
Note. DIF = differential item functioning; CFA = confirmatory factor analytic; LR = likelihood ratio. Summary statistics for the “none” conditions above include conditions for which b parameters were simulated to differ but not the null condition (Condition 1).
Table 7 Mean and Standard Deviation of the Number of Samples Detected for Conditions of Number of Items With Simulated Differences Number of Different Items
Analysis
Samples
M
SD
0
CFA omnibus test CFA AnyDIF LR AnyDIF
300 300 300
1.00 15.67 26.33
1.00 7.51 4.16
2
CFA omnibus test CFA AnyDIF LR AnyDIF
2,100 2,100 2,100
15.24 18.24 85.67
20.71 10.15 16.64
4
CFA omnibus test CFA AnyDIF LR AnyDIF
2,100 2,100 2,100
44.62 22.48 91.62
38.03 11.38 14.93
Note. CFA = confirmatory factor analytic; DIF = differential item functioning; LR = likelihood ratio.
382
ORGANIZATIONAL RESEARCH METHODS
Table 8 Mean and Standard Deviation of the Percentage of Samples Detected for Conditions of Sample Size Sample Size
Analysis
Samples
M
SD
150
CFA omnibus test CFA AnyDIF LR AnyDIF
1,400 1,400 1,400
8.21 30.71 75.93
9.00 5.98 16.66
500
CFA omnibus test CFA AnyDIF LR AnyDIF
1,400 1,400 1,400
32.00 13.57 90.64
28.56 3.59 14.67
1,000
CFA omnibus test CFA AnyDIF LR AnyDIF
1,400 1,400 1,400
49.57 16.79 99.36
41.93 12.03 1.65
Note. CFA = confirmatory factor analytic; DIF = differential item functioning; LR = likelihood ratio. Does not include samples with no DIF.
sizes. However, it is well known that maximum likelihood estimation, as used in LISREL, is prone to a positive rejection bias for small samples particularly when multivariate normality is absent (Bentler & Yaun, 1999). Note that ME/I tests such as these can also be used to test for differences between data sets collected longitudinally. Traditionally, longitudinal ME/I tests focus on three types of change: alpha change, which is defined as a true score change in the latent level of a construct; gamma change, which is a reconceptualization of the construct being measured over time; and beta change, which can be defined as a change in the metric of the measure used to assess change over time (Golembiewski et al., 1976). Beta change can be thought of as a change in the latent intervals between category responses on a Likert-type scale. In other words, beta change can be defined as the lengthening or shortening of intervals between item response options over time. The usefulness of the b parameters in the IRT paradigm is easily seen when discussing ME/I tests of longitudinal data. As seen in Figure 4, differences in items’b parameters over time seem to graphically represent the very definition of beta change. This stands in contrast to differences in items’ a parameters over time (as in Figure 5), which do not conceptually fit the definition of beta change. The data simulated in this study were not simulated to have dependencies between the two groups, and the CFA analyses conducted did not use the preferred stacked data matrix that allows estimation of covariances across time. As such, the results are not readily generalizable to those of all longitudinal studies. However, we feel that it is important to illustrate the substantial role that IRT analyses, via estimation of b parameters, could play in longitudinal ME/I tests and encourage researchers that are particularly interested in beta change to consider the use of the GRM available in IRT. Implications
Although several authors have compared and contrasted IRT and CFA ME/I approaches, it is important to emphasize that (a) the two methods have different assumptions (e.g., linearity/nonlinearity), (b) the two methods provide different ME/I information, and (c) neither method is without flaw. As such, researchers and practi-
Meade, Lautenschlager / COMPARISON OF IRT AND CFA
383
tioners may receive an incomplete ME/I picture of the psychometric properties of a measure by using only one methodology. Moreover, in some situations, it is possible that ME/I tests could be misleading such as with CFA tests in which sample sizes are small, factor communalities are low (Meade & Lautenschlager, 2004), or differences that parallel those of b parameters are present. IRT analyses were also sometimes misleading with small sample sizes (typical of much of organizational research) and provide no information about the relationship between factors, which could be important in some situations. Thus, we suggest that researchers conduct ME/I tests using both methods whenever feasible. Examples of the use of both methodologies are available in existing literature (cf. Schmit, Kihm, & Robie, 2000; e.g., Facteau & Craig, 2001; Maurer et al., 1998; Zickar & Robie, 1999), and each can provide unique information that could be useful in both research and organizational decision making. However, we recognize that performing both types of analyses may not be possible in all situations due to time and resource constraints. In such cases, it is important that researchers and practitioners fully understand the advantages and disadvantages of the two methods. As only the CFA analyses provide information regarding the relationship between latent factors, its use would be preferable when the research goal is to examine questions of the equivalence of a multifactorial framework (e.g., the five-factor model of personality, organizational culture perceptions, etc.). In addition, because fewer parameters are estimated, CFA ME/I analyses may be theoretically preferable when sample sizes are low (e.g., 150 or less) or the number of items is small. However, we advise caution in these instances as the CFA tests performed poorly even with sample sizes as large as 500 under some conditions in this study. Last, when there are many groups to be compared (e.g., several organizational departments), CFA tests of all groups simultaneously are generally easier than their IRT counterparts with which most methods require pairwise comparisons. When the equivalence of a single scale or specific scale items is of interest, then IRT analyses are more desirable. With the additional parameters estimated via IRT methods, more information is present on which ME/I tests can be conducted. These additional parameters (b parameters in the GRM) provide considerably more psychometric information at the item response level than do their CFA counterparts (item intercepts). However, IRT analyses generally require larger sample sizes to adequately estimate these additional parameters and require at least a moderate amount of scale items to adequately estimate both latent trait scores and item parameters (Embretson & Reise, 2000). In addition, the pairwise nature of most IRT ME/I tests would make them particularly cumbersome when ME/I needs to be established across several groups. Under ideal conditions, it would be desirable to consider both approaches when examining ME/I. First, measurement equivalence could be examined using IRT methods at the item level within each scale or subscale desired. Items that satisfy these conditions could then be used in CFA tests for individual scales and in more complex measurement models involving several scales simultaneously. When item parceling is necessary, using IRT results to form item parcels based on the psychometric properties of the items (i.e., item a and b parameters) and to ensure item-level ME/I before conducting CFA analyses would be optimal.
384
ORGANIZATIONAL RESEARCH METHODS
Limitations
As with most simulation studies, this study is limited in scope. There are many different possible properties of data used by researchers and practitioners when conducting tests of ME/I. This study simulated only a small number of these data properties as an exploratory study into the efficacy of CFA and IRT tests of ME/I. Thus, although this study does explicate some areas of concern regarding ME/I tests, they by no means represent every situation encountered by researchers conducting these tests. In practice, organizational researchers often encounter data that are not normally distributed. As such, IRT analyses of such data often involve combining data for response options that few people have chosen (e.g., collapsing Response Options 1 and 2 to create a 4point Likert-type scale). Such category collapsing is not necessary in CFA as item covariances are analyzed rather than raw score responses themselves. Further research should include simulations in which data are not normally distributed to investigate the impact of scale collapsing on the efficacy of IRT tests of ME/I. A second limitation could be that IRT-based software (GENIRV) was used to create the data for which CFA and IRT analyses were conducted. It may seem that if data were created using an IRT framework, IRT analyses might have some advantages in data analysis. We acknowledge that the IRT software creates item to latent trait relationships that are not linear. However, only through IRT models could we simulate an optimal operationalization of a subtle lack of ME/I via differences in b parameters. Furthermore, the CFA analyses in this study encountered very few problems with estimation of the models, and in general, model fit was typical of that encountered in many ME/I studies involving actual data. Also, as Raju et al. (2002) stated, the item to trait relationship modeled (and created) in IRT is at least as likely, if not more likely, to hold true for nonsimulated data as is the linear relationship modeled by CFA analyses. Future Research
Although this study provides some light on the nature of the differences between IRT and CFA ME/I methods, there are areas of future research that are strongly needed. As one reviewer noted, many researchers using CFA methods create item bundles or parcels to reduce the number of parameters estimated during analysis. This practice may have large implications for the detection of ME/I in the CFA approach. Specifically, we believe that our results indicate that parceling items may further cloud the outcome of CFA ME/I results. Obviously, as fewer item parameters are estimated, less information is available that can be tested for ME/I. Moreover, we contend that individual item responses lead to a lack of ME/I, so investigations of ME/I should be focused at the individual item level when possible. However, it may be useful for future simulation work to extend the present research in this direction. Vandenberg (2002) and Riordan et al. (2001) have called for Monte Carlo studies into the properties of CFA tests of ME/I. In addition, Raju et al. (2002) recently called for exactly this type of study to further our understanding of tests of ME/I (and DIF) and the relationship between the CFA and IRT methods. Although the findings of this study and the conceptual arguments for why IRT analyses might be expected to outperform CFA analyses in some situations begin to highlight real differences between the methodologies, much further work is needed. We reiterate Raju et al.’s (2002) call
Meade, Lautenschlager / COMPARISON OF IRT AND CFA
385
for large simulation studies investigating the situations in which CFA and IRT might be preferable. Possible conditions to examine include different assumptions concerning the data such as the degree of robustness to violations of normality, different sample sizes typically encountered in organizational research, different numbers of scale items, and different amounts of dimensionality present in the data. We hope that this study provides the first of many steps toward establishing the conditions under which IRT versus CFA analyses are more suitable for establishing ME/I. Note 1. Recently, some authors have used the terminology of mean and covariance structure analysis to refer to confirmatory factor analytic (CFA) models in which latent means and item intercepts are estimated (e.g., Chan, 2000; Ployhart & Oswald, 2004). Our references to CFA models throughout the article are intended to include such models.
References Baker, F. (1994). GENIRV: Computer program for generating item response theory data. Madison: University of Wisconsin, Laboratory of Experimental Design. Bentler, P. M., & Yaun, K.-H. (1999). Structural equation models with small samples: Test statistics. Multivariate Behavioral Research, 34, 181-197. Boles, J. S., Dean, D. H., Ricks, J. M., Short, J. C., & Wang, G. (2000). The dimensionality of the Maslach Burnout Inventory across small business owners and educators. Journal of Vocational Behavior, 56, 12-34. Camilli, G., & Shepard, L. A. (1994). Methods for identifying biased test items. Thousand Oaks, CA: Sage. Chan, D. (2000). Detection of differential item functioning on the Kirton Adaption-Innovation Inventory using multiple-group mean and covariance structure analyses. Multivariate Behavioral Research, 35, 169-199. Clarke, I., III. (2000). Extreme response style in cross-cultural research: An empirical investigation. Journal of Social Behavior and Personality, 15, 137-152. Cohen, A. S., Kim, S. H., & Wollack, J. A. (1996). An investigation of the likelihood ratio test for detection of differential item functioning. Applied Psychological Measurement, 20, 15-26. Collins, W. C., Raju, N. S., & Edwards, J. E. (2000). Assessing differential functioning in a satisfaction scale. Journal of Applied Psychology, 85, 451-461. Craig, S. B., & Kaiser, R. B. (2003, April). Using item response theory to assess measurement equivalence of 360 performance ratings across organizational levels. Paper presented at the 18th Annual Meeting of the Society for Industrial/Organizational Psychology, Orlando, FL. Donovan, M. A., Drasgow, F., & Probst, T. M. (2000). Does computerizing paper-and-pencil job attitude scales make a difference? New IRT analyses offer insight. Journal of Applied Psychology, 85, 305-313. Embretson, S. E., & Reise, S. P. (2000). Item response theory for psychologists. Mahwah, NJ: Lawrence Erlbaum. Facteau, J. D., & Craig, S. B. (2001). Are performance appraisal ratings from different rating sources comparable? Journal of Applied Psychology, 86, 215-227. Flowers, C. P., Raju, N. S., & Oshima, T. C. (2002, April). A comparison of measurement equivalence methods based on confirmatory factor analysis and item response theory. Paper presented at the annual meeting of the National Council on Measurement in Education, New Orleans, LA.
386
ORGANIZATIONAL RESEARCH METHODS
Fromen, A., & Raju, N. (2003, April). Telecommuters and non- telecommuters: Assessing measurement equivalence on an employee survey. Paper presented at the 18th Annual Meeting of the Society for Industrial/Organizational Psychology, Orlando, FL. Ghorpade, J., Hattrup, K., & Lackritz, J. R. (1999). The use of personality measures in crosscultural research: A test of three personality scales across two countries. Journal of Applied Psychology, 84, 670-679. Golembiewski, R. T., Billingsley, K., & Yeager, S. (1976). Measuring change and persistence in human affairs: Types of change generated by OD designs. Journal of Applied Behavioral Science, 12, 133-157. Horn, J. L., & McArdle, J. J. (1992). A practical and theoretical guide to measurement invariance in aging research. Experimental Aging Research, 18, 117-144. Hui, C. H., & Triandis, H. C. (1989). Effects of culture and response format on extreme response style. Journal of Cross-Cultural Psychology, 20, 296-309. Jöreskog, K. G. (1971). Simultaneous factor analysis in several populations. Psychometrika, 36, 409-426. Jöreskog, K., & Sörbom, D. (1996). LISREL 8: Users reference guide. Chicago: Scientific Software International. Kim, S., & Cohen, A. S. (1997, March). An investigation of the likelihood ratio test for detection of differential item functioning under the graded response model. Paper presented at the annual meeting of the American Educational Research Association, Chicago. Lord, F. M. (1980). Applications of item response theory to practical testing problems. Hillsdale, NJ: Lawrence Erlbaum. Luczak, S. E., Raine, A., & Venables, P. H. (2001). Invariance in the MAST across religious groups. Journal of Studies on Alcohol, 62, 834-837. Martin, L. R., & Friedman, H. S. (2000). Comparing personality scales across time: An illustrative study of validity and consistency in life-span archival data. Journal of Personality, 68, 85-110. Maurer, T. J., Raju, N. S., & Collins, W. C. (1998). Peer and subordinate performance appraisal measurement equivalence. Journal of Applied Psychology, 83, 693-702. McDonald, R. P. (1999). Test theory: A unified treatment. Mahwah, NJ: Lawrence Erlbaum. McLaughlin, M. E., & Drasgow, F. (1987). Lord’s chi-square test of item bias with estimated and known person parameters. Applied Psychological Measurement, 21, 161-173. Meade, A. W., & Lautenschlager, G. J. (2004). A Monte-Carlo study of confirmatory factor analytic tests of measurement equivalence/invariance. Structural Equation Modeling, 11, 60-72. Meade, A. W., Lautenschlager, G. J., Michels, L. C., & Gentry, W. (2003, April). The equivalence of online and paper and pencil assessments. Paper presented at the 18th Annual Conference of the Society for Industrial and Organizational Psychology, Orlando, FL. Ployhart, R. E., & Oswald, F. L. (2004). Applications of mean and covariance structure analysis: Integrating correlational and experimental approaches. Organizational Research Methods, 7, 27-65. Ployhart, R. E., Wiechmann, D., Schmitt, N., Sacco, J. M., & Rogg, K. (2002). The crosscultural equivalence of job performance ratings. Human Performance, 16, 49-79. Raju, N. S., Laffitte, L. J., & Byrne, B. M. (2002). Measurement equivalence: A comparison of methods based on confirmatory factor analysis and item response theory. Journal of Applied Psychology, 87, 517-529. Reise, S. P., Widaman, K. F., & Pugh, R. H. (1993). Confirmatory factor analysis and item response theory: Two approaches for exploring measurement invariance. Psychological Bulletin, 114, 552-566. Riordan, C. M., Richardson, H. A., Schaffer, B. S., & Vandenberg, R. J. (2001). Alpha, beta, and gamma change: A review of past research with recommendations for new directions. In
Meade, Lautenschlager / COMPARISON OF IRT AND CFA
387
C. A. Schriesheim & L. L. Neider (Eds.), Equivalence of measurement. Greenwich, CT: Information Age Publishing. Riordan, C. M., & Vandenberg, R. J. (1994). A central question in cross-cultural research: Do employees of different cultures interpret work-related measures in an equivalent manner? Journal of Management, 20, 643-671. Rock, D. A., Werts, C. E., & Flaugher, R. L. (1978). The use of analysis of covariance structures for comparing the psychometric properties of multiple variables across populations. Multivariate Behavioral Research, 13, 403-418. Samejima, F. (1969). Estimation of latent ability using a response pattern of graded scores. Psychometrika Monograph Supplement, 34, 100-114. Schaubroeck, J., & Green, S. G. (1989). Confirmatory factor analytic procedures for assessing change during organizational entry. Journal of Applied Psychology, 74, 892-900. Schmit, M. J., Kihm, J. A., & Robie, C. (2000). Development of a global measure of personality. Personnel Psychology, 53(1), 153-193. Schmitt, N. (1982). The use of analysis of covariance structures to assess beta and gamma change. Multivariate Behavioral Research, 17, 343-358. Schriesheim, C. A., & Neider, L. L. (Eds.). (2001). Equivalence of measurement. Greenwich, CT: Information Age Publishing. Steenkamp, J. B. E. M., & Baumgartner, H. (1998). Assessing measurement invariance in crossnational consumer research. Journal of Consumer Research, 25, 78-90. Taris, T. W., Bok, I. A., & Meijer, Z. Y. (1998). Assessing stability and change of psychometric properties of multi-item concepts across different situations: A general approach. Journal of Psychology, 132, 301-316. Thissen, D. (1991). MULTILOG users guide: Multiple categorical item analysis and test scoring using item response theory [Computer software]. Chicago: Scientific Software International. Thissen, D. (2001). IRTLRDIF v.2.02b: Software for the computation of the statistics involved in item response theory likelihood-ratio test for differential item functioning [Computer software]. Chapel Hill, NC: LL Thurstone Psychometric Laboratory. Thissen, D., Steinberg, L., & Wainer, H. (1988). Use of item response theory in the study of group differences in trace lines. In H. Wainer & H. I. Braun (Eds.), Test validity (pp. 147169). Hillsdale, NJ: Lawrence Erlbaum. Thissen, D., Steinberg, L., & Wainer, H. (1993). Detection of differential item functioning using the parameters of item response models. In P. W. Holland & H. Wainer (Eds.), Differential item functioning (pp. 67-113). Hillsdale, NJ: Lawrence Erlbaum. Vandenberg, R. J. (2002). Toward a further understanding of and improvement in measurement invariance methods and procedures. Organizational Research Methods, 5, 139-158. Vandenberg, R. J., & Lance, C. E. (2000). A review and synthesis of the measurement invariance literature: Suggestions, practices, and recommendations for organizational research. Organizational Research Methods, 3, 4-69. Vandenberg, R. J., & Self, R. M. (1993). Assessing newcomer’s changing commitments to the organization during the first 6 months of work. Journal of Applied Psychology, 78, 557-568. Watkins, D., & Cheung, S. (1995). Culture, gender, and response bias: An analysis of responses to the Self-Description Questionnaire. Journal of Cross-Cultural Psychology, 26, 490-504. Yoo, B. (2002). Cross-group comparisons: A cautionary note. Psychology and Marketing, 19, 357-368. Zickar, M. J., & Robie, C. (1999). Modeling faking good on personality items: An item-level analysis. Journal of Applied Psychology, 84, 551-563. Adam W. Meade received his Ph.D. in applied psychology from the University of Georgia. He currently is an assistant professor of psychology at North Carolina State University. His research interests are measure-
388
ORGANIZATIONAL RESEARCH METHODS
ment equivalence/invariance, applications of item response theory, and the role of the Internet in employee recruitment and selection. Gary J. Lautenschlager is a professor of psychology at the University of Georgia. His research focuses on modern measurement theories, research methods, and multivariate statistics and their application in organizational and psychological research. He currently serves on the editorial board of the Journal of Organizational Behavior.


![[PDF] Download Item Response Theory - Google Sites](https://m.moam.info/img/260x300/pdf-download-item-response-theory-google-sites_6478ad92097c474c228d661c.jpg)


