speak Spanish as their primary language at home (U.S.. Census ... TEJASVolume XXXI 2008 Texas Journal of Audiology and Speech-Language Pathology. 65 ..... Journal of the American Academy of Audiology, ... Brooks Air Force Base. U. S. ...
CLINICAL FORUM
A Comparison of Pyschometric Performance on Four Modified Spanish Word Recognition Tests LISA FLORES Texas Tech University Health Sciences Center KATSURA AOYAMA Texas Tech University Health Sciences Center Abstract: This study compared four clinically available Spanish word recognition materials. Listeners’ performances were measured at six presentation levels for a single list of four tests on two groups of normalhearing Spanish-speaking listeners in West Texas. Results indicated that performances on the Auditec of St. Louis, Boston College, Berruecos and Rodriguez, and Comm Tech word lists were similar. Psychometric functions obtained on Spanish-speaking listeners were compared to data from normalhearing monolingual English-speaking listeners on a single list of CID W-22 monosyllabic words. The performances on the Auditec of St. Louis and Boston College lists closely approximated those on the CID W-22 list, suggesting that these materials are appropriate for estimating the word recognition abilities of Spanish-speaking listeners.
The Spanish-speaking population in the United States (U.S.) is increasing at a substantial rate. The U.S. Census Bureau (1990, 2000a) reported about a 37% increase in the Hispanic population between 1990 and 2000, while the rest of the population increased by 11.6%. By 2011, the Hispanic population will likely increase to 26.8% (U.S. Census Bureau, 2000b). Audiologists throughout the U.S. will be providing clinical services to a greater number of Spanish-speaking clients through the next decade because nearly 80% of Hispanic population age 5 years and older speak Spanish as their primary language at home (U.S. Census Bureau, 2000c), assuming a normal distribution of hearing problems within the Hispanic population. Part of a standard audiological battery includes the assessment of a client’s word recognition performance to assess his/her auditory communication ability. In 64
English, monosyllabic words are the standard material (e.g., CID Auditory Test W-22 word lists; CID W-22, Hirsh et al., 1952). Determining the appropriate Spanish word recognition materials can be problematic for some audiologists. This problem stems, in part, from the fact that both monosyllabic and bisyllabic words were used to create test materials. Monosyllabic words in Spanish are rare (McCullough & Wilson, 2001), but they have been used in the development of Spanish word lists principled on the criteria established for English word lists (e.g., Ferrer, 1960). Because of the limited number of monosyllabic words available in Spanish compared to English, many materials were developed using bisyllabic words. In Spanish, the stress pattern for these words occurs most often on the penultimate syllable (Harris, 1995). That is, Spanish bisyllabic words typically consist of a stressed syllable followed by an unstressed syllable (e.g., casa ‘house’). According to Pickett (1999), the stressed syllable provides listeners with perceptual auditory cues because of its increased pitch and amplitude and longer duration over the unstressed syllable. Spanish bisyllabic materials, such as the Auditec of St. Louis’ recording of Spanish bisyllables, the Berruecos and Rodriguez (1967) word lists, and the Boston College Auditory Test (Zubick et al., 1983), employ an auditoryonly, open-response format. Open-response format materials are also available in an auditory-visual mode for children (Comstock & Martin, 1984; McCullough, Wilson, Birck & Anderson, 1994), for adults (McCullough et al., 1994; McCullough & Wilson, 2001), and for nonverbal adults (Wilson & Antablin, 1980). Much of the recent research on Spanish word recognition materials has focused on a select set of stimuli, namely the Auditec of St. Louis word list (McCullough & Wilson, 2001; Weisleder & Hodgson, 1989) and the Spanish Picture-Identification Task (McCullough et al, 1994; McCullough & Wilson, 2001). Normative data obtained on these materials were found to be appropriate for estimating the word recognition abilities of Spanish-speaking adult listeners (McCullough & Wilson, 2001; Weisleder & Hodgson, 1989). In addition, the types of bilingualism and clients’ proficiency in Spanish and English would likely affect their performance on word recognition tests. A review of studies on bilingualism and speech audiometry conducted by von Hapsburg and Peña (2002) indicated that factors such as monolingual or bilingual status, language history (e.g., age of second language L2 learning), and bilingual language use all impact auditory speech perception performance. This study investigated whether there are differences among four Spanish word recognition tests. Our primary aim was to evaluate the psychometric function of four TEJAS Volume XXXI 2008 Texas Journal of Audiology and Speech-Language Pathology
clinically available Spanish word recognition materials and to compare the data with an English word recognition test. The secondary aim was to investigate whether there were differences between Spanish speakers who learned English later as an L2 and those who were balanced English-Spanish bilingual individuals.
Method Participants Two groups of Spanish-speaking listeners and one group of English-speaking listeners participated. The first group consisted of 10 normal-hearing adults who spoke Spanish as their first language and English as their secondary language (Group L2). They preferred Spanish to English both at home and outside the home, and immigrated to the U.S. fewer than 10 years ago. The second group consisted of 10 normal-hearing adults who were balanced SpanishEnglish bilingual listeners (Group BB). They were born and raised in the U.S., and spoke primarily Spanish at home and English outside the home. A third group consisted of 10 normal-hearing monolingual English speakers. All participants were recruited from Texas Tech University, Texas Tech University Health Sciences Center, and the Lubbock area. The individuals in Group L2 were five males and five females from 22 to 47 years of age (mean = 30.7 years, SD = 8.2 years). The countries of origin and the number of listeners per country for this group were Mexico (n = 5), Venezuela (n = 4) and Columbia (n = 1). Individuals in Group BB were four males and six females from 26 to 45 years of age (mean = 36.6 years, SD = 5.5 years). All participants in Group BB were Mexican descendents. Monolingual English speakers were one male and nine females from 21 to 33 years of age (mean = 25.1 years, SD = 2.6 years). None of the participants had prior experience with the materials and stimuli used in this study. The audiological criteria for inclusion in the study were: (a) normal-hearing sensitivity < 15 dB HL bilaterally for the audiometric octave frequencies between 250 - 8000 Hz, measured in 5-dB steps, (b) no significant (> 10 dB) air-bone gap at any two consecutive frequencies in either ear, (c) normal (Type A) tympanograms bilaterally, and (d) passing a distortion-product otoacoustic emissions (DPOAEs) screening at the frequencies of 2000, 3000, and 4000 Hz in both ears.
Materials The materials consisted of a single list (list A or 1) from four readily available Spanish word recognition tests and one English word recognition test. These materials were TEJAS Volume XXXI 2008 Texas Journal of Audiology and Speech-Language Pathology
obtained previously for clinical use through distributors and from textbooks and the literature. Fifty words were adopted from list A of the Auditec of St. Louis’ recording of Spanish words. The origin of this list is not known (W. Carver, personal communication, 2004), but it was created using bisyllabic words. Weisleder and Hodgson (1989) found that the psychometric slope of this word list was comparable to those for CID W-22 (Hirsh et al., 1952) and NU-6 (Tillman & Carhart, 1966) monosyllabic-word lists used to test English-speaking clients. A single 50-item word list was made from Lists 1 and 2 of the Berruecos and Rodriguez (1967) word recognition test as adopted from Berger (1977). To reduce variability within the binomial distribution (Thornton & Raffin, 1978), Lists 1 and 2 were combined after a pilot study revealed no significant differences in psychometric function between the two lists. Originally, these words were derived from a sample of 500,000 words most common in daily papers, books, teaching, and recordings of spontaneous conversation in Mexico City at that time. This sample was used to create four lists of 25 phonetically balanced trochaic words. The third list was taken from list 1 (50 words) of the Boston College Auditory Test (Zubick et al., 1983). According to the authors, the words are characterized by seven factors: (a) most frequent stress pattern in Spanish, (b) word familiarity, (c) phonetic dissimilarity (i.e., no similar or rhyming words), (d) equal average difficulty, (e) equal range of difficulty, (f) list composition, and (g) homogeneity of audibility (equal power across words). The final list of 50 Spanish words was adopted from list 1 of the Comm Tech test found in Table 4.23 of Roeser (1996, p. 196). The words in each list are monosyllabic. We were unable to locate additional characteristics related to its development and validity. To our knowledge, normative data are not available for any of these word lists. The 50 monosyllabic words from list 1A of the CID W-22 (Hirsh et al., 1952) were used with English-speaking listeners. All stimuli were preceded by the carrier phrase, “Say the word…” and were spoken by the same male speaker.
Stimuli To control for speaker and recording differences among the word lists, a male speaker of Mexican Spanish recorded each Spanish list in a sound-treated room with clear voice and good speech articulation. Words were spoken into a microphone having an omnidirectional polar pattern
65
(Audio Technica, Model 4050), delivered to a pre-amp (Mackie, Model 1604), and recorded onto a compact disc (Philips, Model CDR880) at a sampling rate of 48,000 Hz and 16-bit resolution. During the recording process, the same carrier phrase preceded each word “Diga usted . . . ” (“You say…”). Each list was transferred to the hard disk drive of a personal computer and re-sampled at a rate of 11,025 Hz and 16-bit resolution. Each word within a given list was also ramped on and off with a rise-fall time of 0.02 second and stored for playback. Digital levels were adjusted so that all words had equal overall rms power. This adjustment ensured that performance was not affected by differences in overall loudness of the recorded stimuli during playback. To reduce potential practice effects, 16 randomized versions were prepared for three of the Spanish word lists (Auditec of St. Louis, Boston College Auditory Test, Comm Tech) and the English CID W-22 word list. Because lists 1 and 2 of the Berruecos and Rodriguez (1967) word recognition test were pooled together to create a single 50-item word list, we randomized words within each respective 25-item list before combining them. In eight of the randomized versions, the words of list 1 were ordered first, followed by the words in list 2. For the remaining eight randomized versions of the Berruecos and Rodriguez (1967) word recognition test, the words from list 2 were ordered first, followed by the words from list 1. There was a 4-second pause between each word. Each list was preceded by the same digital 1,000 Hz calibration tone, which was also ramped on and off with a rise-fall time of 0.02 second and adjusted to match the previously described overall rms power of each word.
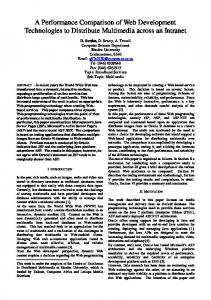
Results Comparisons of Four Spanish Word Recognition Tests A percent correct score was derived presentation level by multiplying the repeated correctly (max = 50 words) shows the psychometric functions for each of the test materials.
for each list and number of words by two. Figure 1 a single list from
Data were analyzed using a three-way repeated-measures analysis of variance (ANOVA; 4 tests x 6 presentation levels x 2 Spanish-speaking groups). This analysis yielded a statistically significant main effect for test (F(3, 16) = 146.71, p < .001) and presentation level (F(5, 14) = 960.49, p < .001). There was also a significant two-way interaction effect between test and presentation level (F(15, 4) = 32.94, p < .01). For the variable of test, pairwise comparisons revealed significant differences (p < .001) between the Auditec of St. Louis list and Berruecos and Rodriguez list, the Auditec of St. Louis list and Comm Tech list, the Boston College list and the Berruecos and Rodriguez list, and the Boston College list and Comm Tech list. These results suggest that percent correct scores were similar between the Auditec of St. Louis and Boston College lists,
Figure 1 Psychometric functions for the single list from each Spanish word recognition test and the CID W-22 test. Error bars indicate Bonferroni-corrected 95-percent confidence intervals.
Procedures Each participant was tested in two separate 90-minute sessions, ranging from 2 to 4 weeks apart. Each participant was seated in a sound-treated room with an insert earphone (ER-3A) placed in the preferred ear. Each participant’s task was to repeat the word he/she heard. Written instructions adopted from Weisleder and Hodgson (1989) were provided to participants in their preferred language. Stimuli were presented from a personal computer, using custom-written software. The stimuli were then low-pass filtered at 5,000 Hz, amplified using a clinical audiometer (GSI-16), and presented at the levels of 20, 24, 28, 32, 36, and 40 dB SPL. The order of lists and presentation levels were counterbalanced across participants. Spanish-speaking participants were tested by a third-year English-Spanish bilingual Doctor of Audiology student. English-speaking participants were tested by a monolingual English-speaking second-year Doctor of Audiology student. 66
B&R = Berruecos & Rodriguez TEJAS Volume XXXI 2008 Texas Journal of Audiology and Speech-Language Pathology
and between the Berruecos and Rodriguez and Comm Tech lists. Pairwise comparisons of the presentation levels indicated that participants’ performance consistently improved as intensity was increased. The two-way interaction effect between test and presentation level was driven by differences between the Auditec of St. Louis and Berruecos and Rodriguez lists, and the Auditec and Comm Tech lists at each of the six presentation levels. The Boston College and Berruecos and Rodriguez lists and the Boston College and Comm Tech lists were also different at all presentation levels except 20 dB SPL. In other words, percent correct scores were similar between the Berruecos and Rodriguez and Comm Tech lists at each of the presentation levels, and between the Auditec of St. Louis and Boston College lists for all but one presentation level. We also calculated and compared the psychometric slopes between the 20% and 80% mean percent correct points for the Auditec of St. Louis and Boston College lists. Since the Berruecos and Rodriguez and Comm Tech lists did not yield mean percent correct scores above 80%, a goodness-of-fit line was used to approximate this value. For all Spanishspeaking participants, the linear portion of the Auditec of
St. Louis list and Boston College list were 3.9%/dB and 4.2%/dB, respectively, indicating that the Auditec of St. Louis material was slightly more difficult than the Boston College material. For the Berruecos and Rodriguez list and Comm Tech word list, the slope functions yielded values of 2.8%/dB and 3.2%/dB, respectively. The performance on Spanish word recognition tests was compared to performance on the English CID W-22 word recognition test (see Figure 1). Pairwise comparisons suggested that performance on the Auditec of St. Louis and Boston College lists was essentially the same as performance on the CID W-22 list, but significantly different (p < .05) from performance on the Berruecos and Rodriguez and Comm Tech lists. The psychometric slope of the CID W-22 list yielded a value of 4.0%/dB, which is comparable to values derived for the Auditec of St. Louis (3.9%/dB) and Boston College (4.2%/dB) lists. The CID W-22 slope function in this study differed slightly from the 4.1%/dB to 4.6%/dB range reported in Beattie, Edgerton and Svihovec (1977) and Heckendorf, Wiley and Wilson (1997). The minor discrepancy in values may be attributed to the adjustment of the overall power to the stimulus prior to data collection, resulting in a slightly more difficult task for the listeners in this study.
Between Group Analysis Figure 2 Psychometric functions for group L2 and group BB. Error bars indicate Bonferroni-corrected 95-percent confidence intervals.
Figure 2 shows the psychometric functions for the two groups of Spanish-speaking participants. Statistical analysis yielded a significant two-way interaction effect between group and presentation level (F(5, 14) = 4.72, p = .01). Pairwise comparisons showed differences in performance between Groups L2 and BB at the two higher presentation levels (36 and 40 dB SPL). The slope functions of each test were recalculated as a function of group (Table 1), using the goodness-offit procedure described earlier. The Boston College list yielded the steepest slope for Groups L2 and BB, while the Berruecos and Rodriguez list yielded the most shallow slope for both groups. This finding suggests that the Berruecos and Rodriguez material was significantly more difficult than the Boston College material for both groups of listeners. Slopes were then calculated separately for the two groups of Spanish-speaking listeners (Group L2 vs. Group BB). The difference in slope functions between the two groups ranged from 0.1%/dB for the Comm Tech list to 0.9%/dB for the Auditec of St. Louis list, with performance being steeper (i.e., easier) for each word list heard by listeners in Group L2. Large differences in slope functions for the Auditec of St. Louis and Boston College lists suggest that Group BB performed at a lower level than Group L2. We compared the psychometric slopes
TEJAS Volume XXXI 2008 Texas Journal of Audiology and Speech-Language Pathology
67
for these lists, using the method described by Zar (1999), which yielded a statistically significant difference (p < .05) between groups. To determine whether a pattern of errors existed in each group, the words that yielded the lowest mean percent correct scores were examined (Tables 2 and 3). Of the words most missed by participants in Group L2, 58% (14/24) were from the Comm Tech list and 38% (9/24) were from the Berruecos and Rodriguez list (Table 2). Many of the words that yielded the lowest mean percent correct scores for Group BB were also from Comm Tech (48%, 10/21) and from the Berruecos and Rodriguez list (43%, 9/21, Table 3). Note that no words from the Boston College list were among the words that yielded the lowest mean percent correct scores.
The results indicated that a majority of items that yielded the lowest percent correct scores came from the Berruecos and Rodriguez and Comm Tech lists for both Spanishspeaking groups. The two most common errors occurred when a word had f and fr in the initial position (e.g., fa, frito) and r in the final position. For f and fr, common errors included substitutions of [b] and [p] for f, and [p], [v] and
Table 2
Discussion and Conclusion The primary aim of this study was to evaluate the psychometric function of four Spanish word recognition materials and to compare the data with an English word recognition test. Our findings suggested that listener performance for the Auditec of St. Louis and Boston College test yielded similar psychometric functions, while listeners performed similarly for the Berruecos and Rodriguez test and the Comm Tech test. Compared to the English monosyllabic word test (CID W-22), psychometric functions for the Auditec of St. Louis and Boston College more closely approximated the psychometric function for the CID W-22 words.
Rank Order of the Words that Yielded the Lowest Mean Percent Correct Scores across Tests for Group L2 Rank
Word
List
Mean percent correct
1
Club
Comm Tech
0
2
Orge
B&R
15
2
Reo
B&R
15
2
Ligo
B&R
15
2
Fa
Comm Tech
15
2
Pie
Comm Tech
15
7
Mar
Comm Tech
25
8
Frito
B&R
30
9
Himno
B&R
35
9
Presas
B&R
35
9
Sor
Comm Tech
35
Table 1
9
Freir
Comm Tech
35
A Comparison of Psychometric Slopes for each Spanish Word Recognition Test for all Spanish-Speaking Listeners, Group L2, Group BB, and between Groups
9
Del
Comm Tech
35
14
Esas
B&R
40
14
Ruin
Comm Tech
40
14
Ver
Comm Tech
40
17
Fiar
Comm Tech
45
18
Viles
B&R
50
19
Frente
Auditec
55
The secondary aim was to investigate whether there were differences between Spanish speakers who learned English later as an L2 and those who were balanced English-Spanish
Slope Function (in %/dB) List
68
bilinguals. With respect to the group differences, results indicated that percent correct scores were significantly higher among Spanish speakers who learned English as an L2 (Group L2) than balanced bilingual participants (Group BB) for each of the materials assessed in this study. This finding suggests that the listeners’ bilingual backgrounds might affect word recognition accuracy.
All SpanishSpeaking Listeners
Group L2
Group BB
Difference between Groups
Auditec
3.9
4.4
3.5
0.9*
19
Rubia
B&R
55
B&R
2.8
3.1
2.7
0.4
19
Col
Comm Tech
55
Boston College
4.2
4.6
3.9
0.7*
19
Te
Comm Tech
55
Comm Tech 3.2 3.2 * p < .05 B&R = Berruecos and Rodriguez
3.1
0.1
19
Se
Comm Tech
55
19 Drill Comm Tech B&R = Berruecos and Rodriguez
55
TEJAS Volume XXXI 2008 Texas Journal of Audiology and Speech-Language Pathology
[pr] for fr. Four items among the most missed words ended with r for both groups (e.g., sor, ver). The final position r was produced as an alveolar tap by the male speaker in the recording of the stimuli, and most listeners either omitted it or substituted [l] for the final r. These patterns suggest that some of the words were not familiar to the Spanishspeaking listeners in this study. In summary, the findings from this study indicated that psychometric functions for the Auditec of St. Louis and Boston College were more similar to the psychometric function of the CID W-22 than the Berruecos and Rodriguez and the Comm Tech tests. In addition, Spanish speakers who learned Spanish as their first language had higher percent correct scores on Spanish word recognition tests than Spanish speakers who were born and raised in the U.S. The results may provide clinically relevant information for Spanish-speaking populations in Texas.
Acknowledgments The authors sincerely thank Amyn Amlani for all of his work on earlier versions of this manuscript. We also thank Ana Regalado and Brenda Fields for their efforts during data collection and Jeffrey Danhauer, Lisa Lucks Mendel, and Rajinder Koul for their comments. This study was supported by a grant awarded to the first author from the Texas Speech-Language-Hearing Foundation.
References Beattie, R. C., Edgerton, B. J., & Svihovec, D. V. (1977). A comparison of the Auditec of St. Louis cassette recordings of NU-6 and CID W-22 on a normal-hearing population. Journal of Speech and Hearing Disorders, 42, 60-64. Berger, K. W. (1977). Speech audiometry materials. Kent, OH: Herald Publishing House.
Table 3 Rank Order of the Words that Yielded the Lowest Mean Percent Correct Scores across Tests for Group BB Rank
Word
List
Mean Percent Correct
1
Reo
B&R
2
Ligo
B&R
5
2
Pie
Comm Tech
5
2
Ver
Comm Tech
5
5
Himno
B&R
10
5
Frito
B&R
10
5
Orge
B&R
10
8
Club
Comm Tech
11
8
Freir
Comm Tech
11
10
Liena
B&R
15
11
Fa
Comm Tech
16
12
Faz
Comm Tech
17
13
Miden
B&R
20
14
Sor
Comm Tech
21
14
Ruin
Comm Tech
21
16
Lema
B&R
25
16
Ostras
Auditec
25
18
Bar
Comm Tech
26
18
Laca
Comm Tech
26
20
Frente
Auditec
30
20 Daros B&R B&R = Berruecos and Rodriguez
0
30
TEJAS Volume XXXI 2008 Texas Journal of Audiology and Speech-Language Pathology
Berruecos, P. T., & Rodriguez, J. L. (1967). Determination of the phonetic percent in the Spanish language spoken in Mexico City, and formation of P.B. lists of trochaic words. International Journal of Audiology, 6, 211216. Comstock, C. L., & Martin, F. N. (1984). A children’s Spanish word discrimination test for non-Spanishspeaking clinicians. Ear and Hearing, 5, 166-170. Ferrer, O. (1960). Speech audiometry: A discrimination test for Spanish language. Laryngoscope, 70, 15411551. Harris, J. W. (1995). Projection and edge marking in the computation of stress in Spanish. In J. A. Goldsmith (Ed.), The handbook of phonological theory (pp. 867888). Cambridge, MA: Blackwell. Heckendorf, A. L., Wiley, T. L., & Wilson, R. H. (1997). Performance norms for the VA compact disc versions of CID W-22 (Hirsh) and PB-%0 (Rush Hughes) word lists. Journal of the American Academy of Audiology, 8, 163-172. Hirsh, I. J., Davis, H., Silverman, S. R., Reynolds, E. G., Eldert, E., & Benson, R. W. (1952). Development of materials for speech audiometry. The Journal of Speech and Hearing Disorders, 17, 321-337. McCullough, J. A., & Wilson, R. H. (2001). Performance on a Spanish picture-identification task using a multimedia format. Journal of the American Academy of Audiology, 12, 254-260.
69
McCullough, J. A., Wilson, R. H., Birck, J. D., & Anderson, L. G. (1994). A multimedia approach for estimating speech recognition of multilingual clients. American Journal of Audiology, 3, 19-22. Pickett, J. M. (1999). Prosodic and tonal features. In J. M. Pickett (Ed.), The acoustics of speech communication: Fundamentals, speech perception theory, and technology (pp. 75-98). Boston: Allyn and Bacon. Roeser, R. J. (1996). Audiological procedures/materials. In R. J. Roeser (Ed.), Audiology desk reference: A guide to the practice of audiology (pp. 161-256). New York: Thieme. Thornton, A. R., & Raffin, M. J. M. (1978). Speechdiscrimination scores modeled as a binomial variable. Journal of Speech, Language, and Hearing Research, 21, 507-518. Tillman, T., & Carhart, R. (1996). An expanded test for speech discrimination utilizing CNC monosyllabic words: Northwestern University Test No. 6. Brooks Air Force Base, TX: USAF School of Aerospace Medicine Technical Report. Brooks Air Force Base. U. S. Census Bureau. (1990). General population and housing characteristics. Retrieved June 17, 2005, from http://factfinder.census.gov/servlet/QTTable?_ bm=y&-qr_name=DEC_1990_STF1_DP1&-geo_ id=01000US&-ds_name=DEC_1990_STF1_&-_ lang=en&-redoLog=true.&-format=&-CONTEXT=qt U. S. Census Bureau. (2000a). Profile of general demographic characteristics: 2000. Retrieved June 17, 2005, from http://factfinder.census. gov/servlet/QTTable?_bm=y&-geo_id=D&-qr_ name=DEC_2000_SF1_U_DP1&-ds_name=D&-_ lang=en&-redoLog=true
70
U. S. Census Bureau. (2000b). Projections of the resident population by age, sex, race, and Hispanic origin: 1999 to 2100. Retrieved June 17, 2005, from http:// www.census.gov/population/projections/nation/detail/ d2011_20.pdf U. S. Census Bureau. (2000c). Profile of selected social characteristics: 2000. Retrieved October 17, 2004, from http://factfinder.census.gov/bf/_lang=en_vt_ name=DEC_2000_SF3_U_DP2_geo_id=01000US. html von Hapsburg, D., & Peña, E. D. (2002). Understanding bilingualism and its impact on speech audiometry. Journal of Speech, Language, and Hearing Research, 45, 202-213. Weisleder, P., & Hodgson, W. R. (1989). Evaluation of four Spanish word-recognition-ability lists. Ear and Hearing, 10, 387-393. Wilson, R. H., & Antablin, J. K. (1980). A pictureidentification task as an estimate of the word-recognition performance of nonverbal adults. Journal of Speech and Hearing Disorders, 45, 223-248. Zar, J. H. (1999). Comparing simple linear regression equations. In J. H. Zar (Ed.), Biostatistical Analysis (4th ed., pp. 360-376). Englewood Cliffs, NJ: Prentice Hall. Zubick, H. H., Irizarry, L. M., Rosen, L., Feudo, P. Jr., Kelly, J. H., & Strome, M. (1983). Development of speech-audiometric materials for native Spanishspeaking adults. Audiology, 22, 88-102.
TEJAS Volume XXXI 2008 Texas Journal of Audiology and Speech-Language Pathology