Abstract. Despite the long recognized importance of apple snails (Pomacea paludosa Say) in Florida wetland food webs, surprisingly little is known about their ...
J. Moll. Stud. (1999), 65, 195–208
© The Malacological Society of London 1999
A COM PARISO N O F SAMPLING TE CHN IQUE S FOR QUANTIF YING AB UNDANCE O F THE FL ORIDA APPLE SNAIL (P OM ACEA PALUD OSA S A Y ) PH ILIP C. D ARB Y, RO B ERT E. BENN ETTS , JASON D. C ROOP, PA TRIC IA L. VAL ENTI NE-D ARBY and WI LEY M. K ITCHE NS Department of Wildlife Ecology and Conservation, Florida Cooperative Fish and Wildlife Research Unit University of Florida, Gainsville, FL 32611-0450 USA (Received 15 April 1998; accepted 30 June 1998)
ABSTRACT Despite the long recognized importance of apple snails (Pomacea paludosa Say) in Florida wetland food webs, surprisingly little is known about their life history and ecology. The paucity of information is due, in part, to the lack of a validated sampling technique. In this study, we compared the effectiveness of a dip net, bar seine, and suction dredge in extracting apple snails from 1-m2 throw traps. We also evaluated the reliability of egg cluster counts as an index of snail abundance. The bar seine was eliminated as a suitable extraction method based on poor performance in densely vegetated habitats. The suction dredge appeared slightly less sensitive than the dip net to habitat differences with regards to both marked snail recovery and higher yield of free-ranging (unmarked, not previously extracted) snails. Our results indicate that the probability of recovering snails from throw traps can be considerably less than 1.0, and that recovery probabilities vary among sites and habitats. Therefore, without reliable estimates for the fraction of animals recovered, density estimates, especially comparisons among sites and habitats, are not reliable. We found no relationship between egg cluster counts and estimates of snail density. The high degree of temporal and spatial variability in egg production precludes the use of egg clusters as a reliable index of apple snail abundance.
INTRODUCTION The Florida apple snail (Pomacea paludosa Say) is a critical component of Florida’s aquatic food web. Research on this species has been identified as a high priority in the Florida Everglades restoration effort (USFWS, 1986; Science Subgroup, 1996). The apple snail is the nearly exclusive food of the endangered snail kite (Rostrhamus sociabilis) (Howell, 1932; Cottam & Knappen, 1939; Haverschmidt, 1962), and comprises over 75% of the diet of limpkins
(Aramus guarauna) in central and south Florida (Cottam, 1936; Snyder & Snyder, 1969). Other predators include white ibis (Eudocimus albus) (Kushlan, 1974), boat-tailed grackles (Cassidix mexicanus) (Snyder & Snyder, 1969), alligators (Alligator missippienisis) (Fogarty & Albury, 1967; Delaney & Abercombie, 1986), redear sunfish (Lepomis microlophus) (Chable 1947), and soft-shelled turtles (Trionyx ferox) (Dalrymple, 1977). Despite their long recognized importance in Florida wetlands, surprisingly little is known about the life history and ecology of apple snails. Many basic questions about snail ecology require some measure of abundance, or at least relative abundance. However, reliable techniques for sampling apple snail populations have not been validated. Throw traps [described under Methods] have been used for sampling macroinvertebrates and fish in the Everglades system (Kushlan, 1981; Owre & Rich, 1987; Chick, Jordan, Smith & McIvor, 1992; Jordan, Babbitt, McIvor & Miller, 1996). Extraction techniques for sampling fish and macroinvertebrates from throw traps include a dip net (Jacobsen & Kushlan, 1987; Chick et al. 1992), bar seine (Rozas & Odum 1988; Chick et al. 1992), and suction dredge (Brook, 1979; Owre & Rich, 1987; Bennetts, Collopy & Beissinger, 1988). Although each of these methods has also been used to sample apple snails (Owre & Rich, 1987; Bennetts & Kitchens, 1993; Jordan, 1997), no quantitative comparison has been made among these extraction techniques. Counts of egg clusters have also been suggested as an indirect measure of relative snail abundance (Perry, 1974; Owre & Rich, 1987; Bennetts et al., 1988; Takekawa & Beissinger, 1989). Apple snail egg clusters, which female snails deposit above water on emergent vegetation, are conspicuous
196 P.C. DARBY, R.E. BENNETTS, J.D. CROOP, P.L. VALENTINE-DARBY & W.M. KITCHENS
and may be quite numerous. These characteristics make sampling egg clusters attractive as a potential tool for assessing snail abundance. In this study, we compared three methods of extracting apple snails from 1-m2 throw traps. We also examined the reliability of egg cluster counts as a measure of snail abundance.
STUDY AREA Our study sites were in Water Conservation Area (WCA) 2B, WCA3A, and the Upper
St. Johns River Basin. WCA2B, an 11,300 ha impoundment in Broward County, and WCA3A, a 237,000 ha impoundment in Dade and Broward Counties, are both in the Everglades (Fig. 1). The marsh substratum consists of fibrous peat in all of our Everglades sampling sites, although we did encounter some scattered limestone rock. The plant communities of both WCAs are a mosaic of sawgrass (Cladium jamaicense) marsh interspersed with wet prairie and slough, and dotted by tree islands of Melaleuca (Melaleuca quinquen ervia), pond apple (Annona glabra) and/or willow (Salix caroliniana). Sawgrass is a large
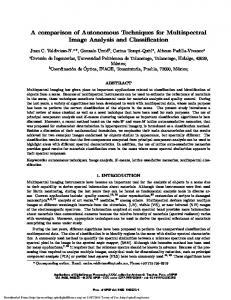
Figure 1. Map of south Florida showing the location of field study areas (BCWMA Blue Cypress Water Management Area, WCA Water Conservation Area). Specific sampling sites noted by . Cities (*), Lake Kissimmee (L. KISS) and Lake Okeechobee (L. OKEE) included for reference.
QUANTIFYING APPLE SNAIL ABUNDANCE
(1 to 3 m tall), emergent sedge which is a dominant feature of the Everglades ecosystem (Loveless 1959, Wood & Tanner 1990). Wet prairie habitats are characterized by an abundance of periphyton and the presence of shorter and less dense emergent macrophytes (relative to sawgrass) such as spike rush (Eleocharis cellu losa), maidencane (Panicum hemitomon), beak rushes (Rhynchospora spp.), and arrowhead (Safittaria spp.). Slough habitats are deeper depressional areas of the marsh which support floating-leaved plants such as water lily (Nymphaea ordatata) and submerged plants such as bladderwort (Utricularia spp.). We found wet prairie and slough habitats difficult to demarcate within sites sampled, so we refer to these habitats collectively as prairie/slough. In addition to the WCAs, we include our egg cluster data from studies conducted in the eastern portion of the Blue Cypress Water Management Area (BCWMA), part of the upper St. Johns River basin in Indian River County (Fig. 1). Eastern BCWMA is also a mixed graminoid system, which differs primarily from the WCAs in having a predominately sand substratum.
197
METHODS Throw trap sampling In 1995 we conducted a pilot investigation of throw trap sampling to (1) refine our sampling protocols, (2) compare the proportion of marked animals that were recovered from throw traps using three extraction techniques, and (3) evaluate the effort required for each extraction method, Sampling was accomplished using a throw trap, which quickly encloses a 1-m2 area after being thrown into the marsh (Chick et al., 1992; Kushlan, 1981). The throw trap is a 60 cm high, 1 m 1 m box that lacks a top and a bottom (Chick et al., 1992). We constructed ours of a welded aluminum pipe frame enclosed with aluminum sheeting (Fig. 2). A removable 40 cm extension was placed on the top of the trap, as necessary, to permit sampling in water depths up to 100 cm. The trap was hand thrown in a randomly selected direction from a standing position. The trap was immediately pushed into the substratum to prevent animals from escaping under the trap. All vegetation was then uprooted, rinsed vigorously, and examined for snails. During the pilot study we explored the use of a bar seine, dip net and suction dredge for extracting snails from throw traps. The bar seine was a 1 m 1 m aluminum frame with two handles extending 0.5 m from
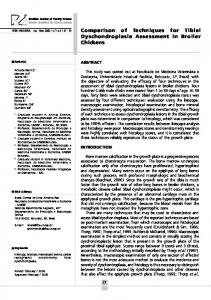
Figure 2. Equipment used to sample apple snails. From left to right; throw trap, bar seine, and dip net.
198 P.C. DARBY, R.E. BENNETTS, J.D. CROOP, P.L. VALENTINE-DARBY & W.M. KITCHENS each side of the frame (Fig. 2). The frame was covered with 1.3 cm mesh netting. The bar seine was swept through the trap until 10 consecutive sweeps devoid of snails were obtained. The dip net was constructed of welded aluminum pipe, consisting of a 1.5 m handle centered on a 0.30 m H 0.66 m L frame, which supported 1.3 cm mesh netting (Fig. 2). It required two sweeps of the net to cover the entire trap. Once the vegetation was removed, the net was passed through the trap until 20 consecutive sweeps devoid of snails were obtained. The suction dredge consisted of a self-priming 2-cycle 5-hp pump, a Mays fluid transformer (Keene Engineering, Northridge, CA) to induce suction (Brook, 1979), and a reinforced rubber intake hose (7.5 cm diameter). The hose was attached to a 7.5 cm diameter aluminum handle with a 15 cm 15 cm box on the end (Fig. 3). The dredge was operated until we had extracted the top 8–10 cm of substratum of the 1 m2 trap area. All material extracted through the suction hose passed over a sorting tray of 1.3 cm wire screen and into a 1.3 cm mesh bag at the end of the sorting tray. Extracted material was then sorted and all snails were removed. In 1996, three sites for throw trap sampling were selected in WCA3A based on the presence of sawgrass stands adjacent to prairie/slough habitat and on
signs of snail presence (i.e., egg clusters on emergent vegetation and/or catching a few snails in a preliminary trapping effort). Consequently, these sites may not be representative of snail densities throughout the area. Because our purpose was to compare methods, rather than to estimate snail densities, having a sufficient sample of snails was of greater concern than having representative densities. All throw traps were placed at least 10 m from the ecotone, defined by juxtaposed sawgrass and prairie habitats, in order to avoid edge effects. For each extraction method within each of these habitats, at least 50 throw trap samples were collected. Bennetts and Kitchens (1993) calculated coefficients of variation (CV) based on throwing up to 80 traps per site, and estimated that at least 50, and maybe up to 100, throw traps per site were required to obtain reasonable precision (CV of 20 to 30%). They suggested that obtaining substantially lower coefficients of variation would not have been logistically feasible given the labor intensity of the methods and the patchy distribution of snails. For throw trap sampling to provide reliable estimates of snail density, it must be assumed that all animals within each throw trap are counted or that the proportion of animals counted must be estimated (Burnham, 1981; Nichols, 1992). We estimated the
Figure 3. The suction dredge used to extract apple snails from throw traps. The pump, fluid transformer, and sorting tray float on the pontoons. Note that holes are needed in the bottom side walls of a throw trap extracted by a suction dredge to allow for water flow during the extraction process.
QUANTIFYING APPLE SNAIL ABUNDANCE proportion of snails extracted using marked snails, which were placed in some throw traps after deployment but prior to plant removal. The number of snails placed in the traps ranged from 0 to 5, which reflected the number of snails collected in 1-m2 traps during this study and earlier studies (Bennetts & Kitchens 1993). The proportion of animals recovered from throw traps (capture probability) was then estimated as the proportion of marked snails recovered. This procedure was intended to be ‘blind’ (i.e., the person collecting the sample did not now if or how many snails were placed in each throw trap); however, we later discovered that our ‘blind’ protocol had not been strictly adhered to during our 1995 pilot study. Consequently, we took advantage of this error to examine the effect of observer bias on our estimates of recovery probability. Effort was measured as the time required to clear a given throw trap using each of the initial three extraction methods in 1995. Extraction time was the time from when the trap was positioned until it had been completely cleared; thus, it included the removal of vegetation. This procedure was only intended to compare extraction time among methods and did not reflect the total time required for sampling (i.e., the additional time for transportation, setup, and equipment maintenance during sampling). Egg Clusters We examined the relationship between counts of egg clusters (henceforth referred to as clusters) and apple snail densities using data from five sampling efforts. Cluster sampling in all five studies was conducted along the sawgrass and prairie/slough ecotone. This is the habitat most frequently chosen by apple snails for oviposition in graminoid marshes (Bennetts et al., 1988; Turner, 1996). Corresponding snail densities in these studies came from sampling in the adjacent prairie/slough habitat. First, we used data from Bennetts et al. (1988), who counted egg clusters and estimated density at two sites in WCA3A during 1987. Their cluster counts were conducted such that each sample represented 10 m2 using a 1 m 2.5 m polyvinylchloride (PVC) frame flipped end over end four times (Bennetts et al ., 1988). Their estimates of apple snail density were derived using throw trap sampling with a suction dredge. Our second and third sources of data came from egg cluster counts we conducted in four sites in WCA2B and three sites in western WCA3A during 1995 and 1996, respectively. The cluster counting technique in these areas was virtually identical to that of Bennetts et al. (1988), except that 5-m 2 quadrats were counted as one sample. As with Bennetts et al., we estimated apple snail densities using throw traps extracted by suction dredge. Fourth, we counted egg clusters in BCWMA East in Spring 1996. Again, we considered 5-m2 as a sampling unit. The density estimate in this fourth study came from a mark-recapture pilot study (Darby, unpublished data). The fifth source of egg cluster and snail density data came from work in eastern WCA3A in the spring of 1997. Again, egg
199 2
clusters were sampled using 5-m sampling units, and densities were obtained from mark-recapture experi ments (Darby, unpublished data). For a comparison of egg cluster counts in relation to distance from the sawgrass/prairie ecotone, we used data from Bennetts et al. (1988) in which egg clusters were counted along the ecotone (0 m) and 7.5 m and 15 m into the interior sawgrass. We repeated this evaluation in WCA3A in 1996, except that counts were conducted along the ecotone (0 m) and 5 m and 10 m into the interior sawgrass. For an evaluation of seasonal variation in egg cluster abundance, we conducted repeated counts along the same three 60-m transects in BCWMA at 6 different times between February and August 1996. Data Analysis A preliminary analysis of the throw trap data revealed that they were not normally distributed (Shapiro-Wilk test, P 0.001) (SAS Inc. 1988); nor did standard transformations (e.g., log x 1), which sometimes help normalize data and stabilize the variance, result in satisfactory improvement. However, our data were reasonably well fitted by an unconstrained negative binomial distribution (G 14.96, 12 df, P 0.244) (White & Bennetts, 1996). Consequently, we used the likelihood-ratio testing framework of program SURVIV (White, 1983) for a negative binomial distribution, as described by White & Bennetts (1996), to test for all main effects attributable to site, habitat, and extraction method. The negative binomial distribution has 2 parameters: m (the arithmetic mean) and k (a dispersion parameter) (Bliss & Fisher, 1953). White and Bennetts’ approach uses a combination of likelihood-ratio tests, Akaike’s Information Criteria (AIC) (Akaike, 1973; Shibata, 1989), and goodness-of-fit tests to determine if m and/or k differ among treatment groups. A disadvantage of their approach is that it is computationally difficult and limited software is available to analyze more complex designs (White & Bennetts, 1996). Consequently, we used ANOVA to further explore the full suite of potential interaction effects. Although these data do not meet the assumptions of ANOVA, it has been shown that ANOVA is quite robust to violation of its assumptions when the data are distributed as negative binomial (Mitchell, 1977), even when the variances are unequal (White & Bennetts, 1996). For our analysis of recovery probabilities of marked snails we considered recovery as a binomial random variable where n the total number of marked snails that were placed in throw traps and p the proportion of those snails that were recovered. We then used the same modelling approach described above for the negative binomial model. Because we used a logit-link function (SAS Inc. 1988), this analysis is identical to logistic regression. We began our analysis of effort by modelling the relationship between extraction time and the total number of marked or wild snails extracted using an ANOVA. Finding a snail in a trap inherently
200 P.C. DARBY, R.E. BENNETTS, J.D. CROOP, P.L. VALENTINE-DARBY & W.M. KITCHENS increases the time required for clearing the trap because our search criteria for both the dip net and bar seine were based on the number of sweeps without finding a snail. Consequently, we used the residuals from the first ANOVA as a dependent variable to examine the additional effects of extraction method, habitat, and site, having already accounted for increased time due to the number of snails extracted. We then examined the effects of site, habitat, and extraction method on the residual times. Because our ‘blind’ protocol for estimating recovery probabilities of marked snails had not been adhered to during 1995, we included an additional effect in our analysis for whether or not marked snails had been placed in the throw trap. A significant interaction between this treatment effect and extraction method would have indicated if any bias was unequally distributed among treatments. The relationship between egg cluster counts and snail density estimates was analysed using linear regression (SAS Inc., 1988). Temporal variation in egg cluster production was analyzed using ANOVA with month and transect as sources of variation (SAS Inc., 1988).
RESULTS Throw Trap Sampling Based on likelihood-ratio tests and AIC, our final model of recovery probabilities during
1995 was strongly influenced by site ( 2 15.01, 2 df, P 0.001) and method ( 2 18.36, 2 df, P 0.001), but not by habitat ( 2 0.51, 1 df, P 0.476). The probability of recovery of marked snails at different sites ranged from 0.46–0.91 using the suction dredge, from 0.70–0.86 using the dip net, and from 0.27–0.77 using the bar seine. Based on these results, we decided to omit the bar seine as an extraction method for our 1996 effort in order to concentrate on the dip net and suction dredge. Our final model during 1996 indicated that recovery probabilities (for dip net and suction dredge only) were strongly influenced by extraction method ( 2 19.19, 1 df, P 0.001) and habitat ( 2 12.24, 1 df, P 0.001), but not by site ( 2 1.61, 2 df, P 0.446). The probability of recovery of marked snails tended to be higher using the suction dredge compared to the dipnet and in prairie/slough habitats compared to sawgrass (Fig. 4). We did not attempt to pool data to test for a year effect because the sampling protocols were different between years with respect to ‘blindness.’ In 1996 we extracted free-ranging snails (unmarked, not previously extracted snails) from 610 throw traps. The most snails extracted from a single throw trap in 1996 was four, but most traps contained either one snail (94 traps) or no
Figure 4. The proportion of marked snails ( SE) recovered from 241 throw traps in prairie/slough and sawgrass habitat using dip net (DN) and suction dredge (SD) in 1996.
QUANTIFYING APPLE SNAIL ABUNDANCE
snails (492 traps). A negative binomial model in which dispersion (k) was constant, but the mean number of snails per throw trap (m) differed among extraction methods, sites, and habitats, was best supported by our data (Table 1). This model had the lowest AIC score and was further supported by all likelihood-ratio tests (at 0.05). This model also had a reasonable fit (G 17.64, 23 df, P 0.777). Our ANOVA supported the conclusion of our negative binomial model, indicating that mean number of snails per throw trap differed among all main effects, and further supported the inclusion of additional interaction effects (Table 2). The number of free-ranging snails/m2 was substantially higher in prairie/slough habitat using the suction dredge at site 2 compared to other sites, habitats, and extraction methods (Fig. 5). Higher numbers of snails tended to
201
be extracted using the suction dredge in all prairie/slough habitats compared to sawgrass habitats. The suction dredge also extracted more snails than dip net in either habitat (although marginally so in sawgrass). Snail densities appeared similar among sites in sawgrass habitats using either extraction method. We evaluated effort (extraction time) from 955 throw traps sampled in WCA2B in 1995. After accounting for the number of snails extracted (marked or unmarked), the residual extraction time was influenced by site, habitat, extraction method, and whether or not marked snails had been placed in the trap (Table 3). The mean ( SD) extraction time (all methods) in sawgrass habitats (10.7 7.8 min.) was higher than prairie/slough habitats (7.9 4.1 min.) particularly at our first site sampled (22.0 13.9 minutes). Our final model indicated a
Table 1. Description of negative binomial models and their corresponding Akaike Information Criteria (AIC) scores. Lower AIC scores indicate more parsimonious models. ‘None’ refers to models not accounting for contributing effects of either Site (SITE), Habitat (HAB), or Method (METH) or any combination (i.e., potential effects are unknown or random). Also shown is the parameter structure (i.e., whether m [the arithmetic mean] and/or k [dispersion] differed among extraction methods, habitats, or sites) Model
Source(s) of Variation (m)
Source(s) of Variation (k)
1 2a 3 4 5 6 7 8 9 10
None SITE,HAB,METH None SITE,HAB,METH SITE HAB METH HAB,METH METH,SITE HAB,METH
None None SITE,HAB,METH SITE,HAB,METH None None None None None None
No. Parameters 2 13 13 24 4 3 3 7 7 5
AIC 749.25 714.89 767.89 734.21 736.34 734.93 740.64 719.26 730.74 724.50
a
The model we selected based on AIC, likelihood-ratio tests and goodness-of-fit.
Table 2. Analysis of variance (ANOVA) table for the fully saturated model of wild apple snail numbers in relation to habitat (HAB), site (SITE), and extraction method (METH) from throw traps. Sums of squares (SS) are type III partial SS, which are adjusted for all other terms in the model (SAS Inc., 1988) Source
df
SS
MS
F
HAB SITE METH HAB HAB SITE SITE Error
1 2 1 2 1 2 2 598
4.629 5.282 3.029 4.952 2.659 1.677 1.914 157.553
4.629 2.641 3.029 2.476 2.659 0.838 0.957 0.263
17.57 10.02 11.50 9.40 10.09 3.18 3.63
SITE METH METH HAB METH
Prob. 0.001 0.001 0.001 0.001 0.002 0.042 0.027
F
202 P.C. DARBY, R.E. BENNETTS, J.D. CROOP, P.L. VALENTINE-DARBY & W.M. KITCHENS
Figure 5. The mean ( SE) number of apple snails per m2 in prairie/slough and sawgrass habitats at each of three sites in WCA3A during 1996 using a dip net (DN) and suction dredge (SD).
Table 3. ANOVA table for our final model of residual extraction time after having taken into account the time attributable to the number of snails extracted. Effects were habitat (HAB), site (SITE), extraction method (METH), and whether or not marked snails had been placed in the throw trap (MARK). Sums of squares (SS) are type III partial SS, which are adjusted for all other terms in the model (SAS Inc., 1988) Source HAB SITE METH MARK SITE HAB MARK SITE Error
df 1 3 2 1 3 2 942
SS 1391.699 3246.463 371.247 116.109 2263.432 304/762 34468.146
site habitat interaction effect and an interac tion between sites and whether or not marked snails had been placed in the throw trap. Overall, more time was expended on throw traps in which marked snails had been placed ( residual 2.70 minutes) compared to traps in which marked snails had not been placed ( residual 0.36 minutes). However, our data did not support the inclusion of an additional interaction between extraction method and whether or not marked snails had been placed in the trap (F2,940 1.99, P 0.138).
MS
F
1391.699 1082.154 185.623 116.109 754.477 152.381
54.43 42.32 7.26 4.54 29.51 5.96
Prob.
F
0.001 0.001 0.001 0.033 0.001 0.001
Egg Clusters We found no relationship between egg cluster counts and estimated apple snail densities (R2 0.043, n 12, P 0.52) (Fig. 6). However, we did find several potential sources of variation in egg cluster counts that could influence this result. Cluster counts differed strongly among repeated sampling at the same site over a 7-month period (F5,210 45.46, P 0.0001) with peak counts occurring in April/May (Fig. 7). Our initial ANOVA, which included both
QUANTIFYING APPLE SNAIL ABUNDANCE
month and transect as sources of variation, revealed no transect effect (F2,198 0.13, P 0.87) or interaction effect (F10,198 1.11, P 0.36). Our data also indicated higher numbers of egg clusters along the ecotone compared to interior sawgrass (Fig. 8). In 1996 we examined the precision of our egg cluster estimates in BCWMA. We found that the coefficient of variation stabilized at approximately 20% after sample sizes (number of 5-m2 quadrats) equalled or exceeded nine. Most of the egg cluster data used in our analysis had sample sizes above this threshold. The two sites from Bennetts et al. (1988) had a sample size of 26 and 28 and each sample was 10 m2. In our study from BCWMA East, the sample size was twelve 5-m2 PVC quadrats per transect. The egg cluster data from eastern WCA3A in 1997 consisted of ten 5-m2 quadrats. However, the data from WCA2B in 1995 and western WCA3A in 1996 had sample sizes of only three 5-m2 quadrats per site.
203
DISCUSSION Extraction of snails from throw traps using the suction dredge yielded the highest estimates of snail density. Because removal of snails from the traps precludes multiple counting of individuals, the higher estimates probably were more accurate. This conclusion is further supported by our independent estimates of recovery probabilities. The suction dredge consistently had the highest recovery of marked individuals, regardless of habitat type. The relative effectiveness of these extraction methods probably reflects how well they remove snails from uneven substrata. Plant removal from within the trap creates numerous small depressions and holes into which snails may fall, thereby avoiding collection by the dip net and bar seine. We have confirmed this by retrieving unrecovered marked snails by hand following attempted extraction. A seining method (done without throw traps) such as that described by
Figure 6. Egg cluster counts and estimated snail densities from a pooled sample from each of 5 sampling efforts. Snail density estimates were derived from throw trap sampling using a suction dredge in prairie/slough habitat (Bennetts et al. 1988, WCA3A 1996, WCA2B 1995) and preliminary results of mark-recapture studies (BCWMA 1996, WCA3A 1997).
204 P.C. DARBY, R.E. BENNETTS, J.D. CROOP, P.L. VALENTINE-DARBY & W.M. KITCHENS
Figure 7. Mean ( SE) number of egg clusters per 5-m2 sampled at one site in BCWMA 6 times during 1996. Sample size was 36 for each session (pooled from 3 transects of 12 quadrats each).
Donnay & Beissinger (1993) would probably suffer from the same problems in uneven substrata. Differences in extraction time among habitats were not surprising. Sampling snails in sawgrass habitat, with its greater vegetation density and more rigid structure, takes longer regardless of the extraction method used. Differences in sites also were not surprising, given variability in substrata and vegetation density. In addition, site 1 in WCA2B was the first site of our pilot study and may have taken longer due to lack of experience working with the extraction techniques. Longer time for extraction of throw traps having marked snails was likely due to ‘observer expectancy bias’ (Balph & Balph, 1983). During the 1995 pilot, when extraction time was measured, observers were aware of whether or not marked snails were in the throw trap. When an observer knows that a snail is present in the throw trap, effort may be increased, intentionally or not, to ensure its recovery. We did not measure extraction time during 1996, but have no reason to have expected this bias, since observers were ‘blind’
to whether or not marked snails were in the trap. A lack of an interaction between whether or not a marked snail was in the trap and the extraction method indicates that this bias was not differentially distributed among extraction methods. Consequently, we believe that our comparisons among capture probabilities of different extraction methods during 1995 were reasonable. We strongly recommend that estimation of capture probabilities always be ‘blind.’ Despite its better performance relative to the dip net and bar seine, the suction dredge does have limitations that may preclude its utility. The pontoons supporting the dredge pump are cumbersome to manœuvre through vegetation, especially sawgrass. Also, the suction dredge cannot function adequately in less than 15 cm of water, a depth common to much of the apple snail’s range. The dredge also had a tendency to damage the snails’ shells. This may not be acceptable for some studies, for example, if repeated sampling over time is done in the same site. All of the throw trap methods, regardless of extraction method, require vege-
QUANTIFYING APPLE SNAIL ABUNDANCE
205
Figure 8. Mean ( SE) number of egg clusters sampled at three distances relative to the sawgrass/prairie ecotone. Numbers inside bars indicate sample size.
206 P.C. DARBY, R.E. BENNETTS, J.D. CROOP, P.L. VALENTINE-DARBY & W.M. KITCHENS
tation removal which alters the habitat, and therefore may influence subsequent sampling results. An important consideration of any potential sampling method is the amount of effort involved in sampling. The throw trap we used weighed in excess of 18 kg (in order to penetrate vegetated habitats). This, in combination with the effort required to uproot vegetation from the trap, makes this method very labor intensive regardless of the extraction technique employed. Also, a large number of 1-m2 throw trap samples are needed to make comparisons of apple snail density (Bennetts & Kitchens, 1993). We deployed at least 50 traps per method per habitat per site to gain enough precision to compare the extraction methods. Our counts of egg clusters along sawgrass/prairie ecotones were not correlated with snail densities in adjacent wet prairies. Bennetts et al. (1988) also found no relationship between counts of egg clusters and capture rates of foraging snail kites. We believe that these results are due to temporal and spatial variability in egg cluster production. Oviposition is influenced by many factors including temperature and vegetation (Hanning, 1979; Turner, 1996). Our results also indicated that egg laying is quite seasonal, and the majority of eggs are deposited over a period of 4 to 12 weeks (see also Odum, 1957; Hanning, 1979). However, even sampling two sites simultaneously may not eliminate the problem. Hanning (1979) found spatial variation in peak egg laying among 6 transects in the southwestern littoral zone of Lake Okeechobee. We would also expect differences to occur along a latitudinal gradient due to the effects of temperature (Hanning, 1979). Additionally, in agreement with Turner (1996), we found variation in egg cluster abundance attributable to the distance from the sawgrass- prairie/slough ecotone. Finally, observations of snail movements and reproductive ecology (Darby, unpubl. data) indicated that variation of egg cluster production among individual snails may contribute to quadrat to quadrat variation in egg cluster counts. Thus, although it is possible that egg cluster counts may provide meaningful results for studies in which these sources of variation are carefully controlled, our results indicate that egg clusters are not a reliable index of apple snail abundance. Owre & Rich (1987) and Turner (1994) hypothesized that apple snails do not use interior sawgrass marsh to any great extent. Their suggestion was based on egg cluster
indices which are not reliable due to the high temporal and spatial variation (see earlier discussion). Our data from both throw trap sampling and egg cluster counts indicate that apple snails regularly occur within stands of sawgrass, although densities may be lower than in adjacent prairies or sloughs in some sites. Our results do not dispute the importance of the prairie/sawgrass or slough/sawgrass ecotones as being critical for oviposition (Bennetts et al., 1988; Turner, 1996). We would simply add that the interior of sawgrass communities should also be recognized as important apple snail habitat. We agree with Turner (1996) that most favorable snail habitat would probably include a mosaic of densely vegetated and sparsely vegetated habitats within a wetland system. Based on our experience with site to site variability in the habitat distribution of snails, we anticipate that a considerably greater effort will be required to make generalizations about snail distribution in different habitat types. Conclusions Of the throw trap-based methods, the dip net and suction dredge were similar in performance. The suction dredge appeared a little less sensitive to habitat differences and tended to have slightly higher overall capture probabilities. However, the dip net required less effort and may require less initial investment (Croop, 1996). In contrast to these two extraction methods, the bar seine had a lower overall capture probability and was substantially more affected by habitat type. Consequently, if a throw trap-based method is to be used, we encourage use of either the dip net or suction dredge. However, we also agree with previous authors (e.g., Burnham, 1981; Nichols, 1992) that counts of animals, whether they be from a throw trap or other sampling method, are of questionable value without having an estimate of the proportion of animals being counted. Estimates of this proportion are obtainable using marked individuals, as described herein. Without information on recovery probabilities, investigators risk misinterpreting site-to-site recovery variability as a real difference in snail density. We found no support for use of egg cluster counts as a reliable index of apple snail abundance. Obtaining reliable estimates of apple snail density, regardless of the method, will be time and labour intensive. The Florida apple snail, although the largest aquatic gastropod in North
QUANTIFYING APPLE SNAIL ABUNDANCE
America, is a relatively small, inconspicuous animal which occurs in relatively low densities in densely vegetated wetlands. The level of effort required to perform throw trap studies, as well as the discouraging results from egg cluster counts, has motivated us to explore alternative sampling techniques potentially applicable to apple snails (e.g., wire traps) (Owre & Rich, 1987). ACKNOWLDGEMENTS This paper is dedicated to the memory of Earl Rich and Oscar ‘Bud’ Owre, whose early efforts guided our approach to this study. We greatly appreciate the contributions of our field biologists Eric E. Tenoso and Mauricio Rojas. We thank Dale Gawlik (South Florida Water Management District), Steve Miller (St. Johns River Water Management District), Frank Jordan (Jacksonville University) and Franklin Percival (U.S.G.S.-Biological Resources Division) for their helpful comments on drafts of this manuscript. This work was funded under joint contract by the South Florida WMD (Contract No. C-E6609) and the St. Johns River WMD (Contract No. 95D159). This study was conducted under the auspices of the Florida Cooperative Fish and Wildlife Research Unit (Florida Game and Fresh Water Fish Commission, Univ. of Florida, U.S.G.S.-Biological Research Division, and Wildlife Management Institute, cooperating). This is contribution No. R-064317 of the Florida Agriculture Experiment Station Journal Series, Institute of Food and Agricultural Sciences, University of Florida. REFERENCES A KAIKE, H. 1973. Information theory and an extension of the maximum likelihood principle. In: Pro ceedings of the 2nd International Symposium on Information Theory (B. Petrov & F. Czakil, eds), 267-281. BALPH, D.F. & BALPH, M.H. 1983. On the psychology of watching birds: the problem of observerexpectancy bias. Auk. 100: 755-575. BENNETTS, R.E., COLLOPY , M.W. & BEISSINGER, S.R. 1988. Nesting ecology of snail kites in Water Con servation Area 3A. Department of Wildlife and Range Science., Univ. of Florida, Gainesville. Florida Cooperative Fish and Wildlife Research Unit. Technical Report No. 31. BENNETTS, R.E. & K ITCHENS, W.M. 1993. Estimation and environmental correlates of survival and move ments of snail kites in Florida. 1993 Annual Progress Report. Florida Cooperative Fish and Wildlife Research Unit, University of Florida, Gainesville. BLISS, C.I. & F ISHER, R.A. 1953. Fitting the negative binomial distribution to biological data. Biomet rics, 9: 176-200.
207
BROOK, I.M. 1979. A portable suction dredge for quantitative sampling in difficult substrates. Estu aries, 2: 54-58. BURNHAM, K.P. 1981. Summarizing remarks: environmental influences. In: Estimating Numbers of Terrestrial Birds (C.J. Ralph, J.M. Scott, eds). Studies in Avian Biology 6. CHABLE, A.C. 1947. A study of the good habits and ecological relationships of the sunfishes of Northern Florida. M.S. Thesis, University of Florida, Gainesville. CHICK, J.H., JORDAN, C.F., SMITH, J.P. & MCIVOR, C.C. 1992. A comparison of four enclosure traps and methods used to sample fishes in aquatic macrophytes. Journal of Freshwater Ecology, 7: 353-361. COTTAM, C. 1936. Food of the limpkin. Wilson Bul letin, 48: 11-13. COTTOM, C. & KNAPPEN, P. 1939. Food of some uncommon North American birds. Auk, 56: 138169. CROOP, J.D. 1996. A quantitative comparison of sam pling techniques and habitat use for the apple snail (Pomacea paludosa) in the Florida Everglades. M.S. Thesis, University of Florida, Gainesville. D ALRYMPLE, G.H.1977. Intraspecific variation in the cranial feeding mechanism of turtles of the genus Trionyx (Reptilia, Testudines, Trionychidae). Journal of Herpetology, 11: 255-285. DELANEY, M.F. & ABERCOMBIE , C.L. 1986. American alligator food habits in northcentral Florida. Journal of Wildlife Management, 50: 348. DONNAY, T.J. & BEISSINGER, S.R. 1993. Apple snail (Pomacea doliodes) and freshwater crab (Dilocari nus dentatus) population fluctuations in the Llanos of Venezuela. Biotropica, 25: 206-214. F OGARTY, M.J. & ALBURY , J.D. 1967. Late summer foods of young alligators in Florida. In: Proceed ings of 21st Annual Conference of the Southeastern Assoc. Game and Fish Commissioners (J.W. Webb ed.), 220-222. HANNING, G.W. 1979. Aspects of reproduction in Pomacea paludosa (Mesogastropoda: Pilidae). M.S. Thesis, Florida State University, Tallahassee. H AVERSCHMIDT, F. 1962. Notes on the feeding habits and good of some hawks of Surinam. Condor, 64: 154-158. HOWELL, A.H. 1932. Florida bird life. CowardMcMann, Inc. Jacobsen, T.L. & Kushlan, J.A. 1987. Sources of sampling bias in enclosure fish trapping: effects on estimates of density and diversity. Fisheries Research , 5: 401-412. JORDAN, F. 1997. Spatial ecology of decapods and fishes in a northern Everglades wetland mosaic. Ph.D. Dissertation, University of Florida, Gainesville. JORDAN, F., JELKS, H.L. & KITCHENS, W.M. 1994. Habitat use by the fishing spider Dolmoides triton in a northern Everglades wetland. Wetlands, 14: 239-242. JORDAN, F., BABBITT, K.J., MCI VOR, C.C., & MILLER, S.J. 1996. Spatial ecology of the crayfish Procam -
208 P.C. DARBY, R.E. BENNETTS, J.D. CROOP, P.L. VALENTINE-DARBY & W.M. KITCHENS barus alleni in a Florida wetland mosaic. Wetlands, 16: 134-142. KUSHLAN, J.A. 1974. Ecology of the white ibis in southern Florida. Ph.D. Dissertation. University of Miami, Coral Gables. KUSHLAN, J.A.1975. Population changes of the apple snail (Pomacea paludosa) in the southern Everglades. The Nautilus, 89: 21-23. KUSHLAN, J.A. 1981. Sampling characteristics of fish enclosure traps. Transactions of the American Fish eries Society, 110: 557-562. LOVLESS, C.M. 1959. A study of the vegetation in the Florida Everglades. Ecology, 40: 1-9. MITCHELL, J.H.1977. A robustness study of the analy sis of variance on negative binomial data. M.S. Thesis, University of Washington, Seattle. NICHOLS, J.D. 1992. Capture-recapture models: using marked animals to study population dynamics. Bioscience, 42: 94-102. O DUM, H.T. 1957. Trophic structure and productivity of Silver Springs, Florida. Ecological Monographs, 27: 55-112. OWRE, O.T. & RICH, E.R. 1987. Development and evaluation of field census methodologies for the apple snail. Final report., U.S.D.I. Fish and Wildlife Service. Department of Biology, University of Miami, Coral Gables. P ERRY, M.C. 1974. Ecological studies of the apple snail at Lake Woodruff National Wildlife Refuge. Florida Scientist, 36: 22-30. ROZAS, L.P. & ODUM, W.E.1988. Occupation of submerged aquatic vegetation by fishes: testing the roles of food and refuge. Oecologia 77: 101-106. SAS INC. 1988 SAS/STAT User’s guide. Release 6.03. SAS Institute, Inc. Cary, North Carolina, USA. SCIENCE SUBGROUP. 1996. South Florida Ecosystem
Restoration: Scientific Information Needs. Report to the Working Group of the South Florida Ecosystem Restoration Task Force. SHIBATA, R. 1989. Statistical aspects of model selection. From data to model (J.C. Williams, ed.), 215240. Springer-Verlag, New York. SNYDER, N.F.R. & SNYDER, H.A. 1969. A comparative study of mollusk predation by limpkins, everglade kites, and boat-tailed grackles. The Living Bird, 8: 177-223. TAKEKAWA, J.E. & BEISSINGER, S.R. 1989. Cyclic drought, dispersal, and conservation of the snail Kite in Florida: lessons in critical habitat. Conser vation Biology, 3: 302-311. TURNER, R.L. 1994. The effects of hydrology on the population dynamics of the Florida apple snail (Pomacea paludosa). St. Johns Water Management District Technical Report No. SJ94-SP3. Palatka, FL. TURNER , R.L. 1996. Use of stems of emergent vegetation for ovisposition by the Florida apple snail (Pomacea paludosa), and implications for marsh management. Florida Scientist, 59: 34-49. USFWS. 1986. Florida snail kite (Rostrhamus sociabilis sociabilis Ridgeway) revised recovery plan. U.S. Fish and Wildlife Service. Atlanta, Georgia. WHITE, G.C. 1983. Numerical estimation of survival rates from band-recovery and biotelemetry data. Journal of Wildlife Management, 47: 716-728. WHITE, G.C. & BENNETTS, R.E.1996. Analysis of frequency count data using the negative binomial distribution. Ecology, 77: 2549-2557. WOOD, J.M. & TANNER, G.W.1990. Graminoid community composition and structure within four Everglades management areas. Wetlands, 10: 127149.