truncated Cooper-Frye formula [15]. (E dN ... The Cooper-Frye formula is ..... [34] QM2002 poster presentation, Abstract at http://alice-france.in2p3.fr/qm2002/.
A comparison of statistical hadronization models Giorgio Torrieri and Johann Rafelski
arXiv:nucl-th/0305071v3 25 Jun 2003
Department of Physics, University of Arizona, Tucson, AZ 85721 Abstract. We investigate the sensitivity of fits of hadron spectra produced in heavy ion collisions to the choice of statistical hadronization model. We start by giving an overview of statistical model ambiguities, and what they tell us about freeze-out dynamics. We then use Montecarlo generated data to determine sensitivity to model choice. We fit the statistical hadronization models under consideration to RHIC data, and find that a comparison χ2 fits can shed light on some presently contentious questions. PACS: 12.38.Mh, 25.75.-q, 24.10.Pa
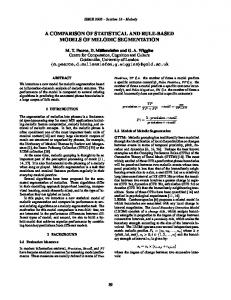
1. Statistical hadronization models There is increasing interest to apply the statistical model [1, 2, 3] in a description of both particle yields [4, 5, 6, 7] and spectra [8, 9, 10, 11, 12, 13, 14] produced in heavy ion collisions in terms of a statistically hadronizing transversely expanding fireball. The fitted parameters, and in particular the temperature, however, have varied considerably, ranging from as low as 110 MeV [8, 9, 10, 11, 14] to 140 MeV [4, 13] to as high as 160 and 170 MeV [5, 6, 7, 12]. This report examines these differences in terms of the different possible approaches to statistical hadronization, and studies data sensitivity to model choice. The most commonly used prescription for statistical emission of hadrons is the truncated Cooper-Frye formula [15]. � � � � Z dN dN µ 3 µ µ 3 = p d Σµ f (p uµ , T, λ)θ(p d Σµ ) + E 3 (1) E 3 d p cf d p Res Where pµ is the particle’s four-momentum, uµ is the system’s transverse flow, T is the temperature, λ is the normalization and/or chemical potential, f (E, T, λ) is the statistical distribution of the emitted particles in terms of energy and conserved quantum numbers, Σµ describes the hadronization geometry and θ(pµ d3 Σµ ) is a step function, which corrects for inward emission [16, 17]. The Cooper-Frye formula is appealing because it’s the most general covariant way of describing statistical particle emission. However, its form is compatible with a variety of freeze-out scenarios. 1.1. Resonances and normalization As Fig. 1 shows, the resonance contribution (E ddN 3 p )Res is a non-negligible and strongly temperature dependent admixture to the total multiplicity. Its role within particle spectra, however, is a matter of controversy. If an interacting hadron gas phase reequilibrates resonance decay products [18], it might be more realistic to not include
2
A comparison of statistical hadronization models 1.0
800
π Λ
p
0.7
600 400 Before resonance decays After resonance decays PHOBOS (130 GeV)
200
0.6
K 0
0.5
Ξ
0.3
−3
−1
φ
0.1 0.5
1.0 Mass
1
3
5
1
3
5
y
600
*
K
0.2
0.0 0.0
−5
800
0.4 dN/dη
Resonance contribution
0.8
dN/dy
T=140 MeV T=160 MeV T=180 MeV
0.9
Ω~0
1.5
400 200 0
−5
−3
−1 η
Figure 1. Left: Fraction of particles produced by resonances as a function of Temperature, Right: dNtot /d(y, η) arising from freeze-out of a Bjorken fluid, before (open circles) and after (solid circles) resonance decays. The normalization is arbitrary, chosen to coincide with PHOBOS [28] data (triangles)
resonances when analysing spectra [8, 9, 10, 11]. Direct detection of resonances [19, 20, 21, 22] through invariant mass reconstruction, however, suggests that at least in some cases their feed-down has to be taken into account. These resonances will have a different distribution than those produced directly, and their inclusion can shift the temperature by as much as 20 MeV [23]. If an incoherent system is considered, one can factor out the decay matrix elements (the angular distribution of decay products and lifetime), and arrive at the distribution of “daughter” particles (N with momentum p) from “parent particles” (NR with momentum pR ) by simply integrating over the available phase space � � � � Z Y N N X d3 pj dNR dN µ µ µ = (2) pj ) ER 3 δ(pR − p − E 3 d p res Ej d pR 2 j=2 In general, this expression can get very complicated, and Montecarlo integration [24] becomes necessary. For most cases considered here, where there is one feed-down and two or three body decays, eq. 2 can be integrated semi-analitically [12, 13, 25]. While including resonances in this way is computationally demanding [25], it can be implemented with no extra degrees of freedom. It is therefore straightforward to check the effect of resonance inclusion on χ2 . A large increase in statistical significance would be a strong indication that resonance decay products do in fact emerge from the system with little rescattering. Otherwise, rescattering has to be taken into account. The handling of resonance decays is connected with the way particle spectra are normalized. Several ways to normalize spectra are possible, and the fitted temperature could change significantly depending on the chosen method, since temperature becomes correlated to a different set of parameters. The simplest approach is to treat normalization of each particle as a free parameter [8, 9, 10, 11]. If the post-hadronization interacting hadron gas phase is long enough to allow inelastic interactions to alter the chemical composition of the fireball, this may be the correct approach. In this case, temperature will be correlated to flow but not to normalization.
A comparison of statistical hadronization models
3
The arbitrary normalization means there is no way to include feed-down from resonances without introducing many more parameters (the resonance normalizations) into the fit. (If rescattering is significant, however, these parameters would be physically justified). Alternatively, a common normalization volume, together with the introduction of flavor chemical potentials, can be used [12, 13]. This approach, justified by the success in handling short-lived resonances through thermal models [7], is consistent with a scenario in which post-hadronization dynamics does not change particle abundances or distributions significantly. It does not require extra degrees of freedom for resonances to be included. However, feed-down from resonances means the fitted temperature will be strongly correlated with chemical potentials and reaction volume, in addition to transverse flow: Most short-lived resonances have the same quark content as the lighter daughter particles, making their yield relative to the lighter particle dependent on temperature only. Hence, temperature will influence both absolute normalization (correlating it with volume, chemical potentials) and the slope (correlating it with flow). If chemical potentials are used, the eventuality of chemical non-equilibrium raises the possibility that, additionally to chemical potentials, the flavor phase space occupancy parameter γ needs to be used for either strange [6, 12] or light [4, 26] flavors. If these parameters are used, they will correlate temperature with chemical potential even more strongly, since, just like temperature, γ affects particles and antiparticles abundance in the same way. 1.2. Freeze-out geometry and flow profile Several choices of the freeze-out geometry Σµ are possible. This choice is important both for getting a full understanding of how freeze-out happens [27] and because it correlates with the shape of particle spectra, and hence on parameters such as transverse flow and temperature. Measured RHIC rapidity distributions [28, 29] indicate that around midrapidity Bjorken boost-invariance [30] holds. This, together with cylindrical symmetry (appropriate for the most central collisions) constrains d3 Σµ to be of the form [25, 27] Σµ = [tf cosh(yL ), r cos(θ), r sin(θ), tf sinh(yL )] (3) ∂t f pT cos(θ − φ))rdrdy (4) pµ dΣµ = (mT cosh(y − yL ) − ∂r where y, φ are the particle’s rapidity and momentum directions, while yL , θ are the longitudinal rapidity and emission angle of the freeze-out hypersurface. tf is the freeze-out time in a longitudinally co-moving frame. It is clear that several freeze-out models can be produced with different choices of ∂tf /∂r, giving quantitatively different results. It is also clear that the choice of ∂tf /∂r might influence fitted parameters such as temperature, transverse velocity and normalization. Recently published fits use a variety of freeze-out geometries: • [8, 9, 10, 11] assume ∂tf /∂r = 0, i.e. emission is independent of radius. Emission happens in the same lab momentum time. • [13] fits ∂tf /∂r as a free parameter, with the result being ∼ 1. This indicates explosive freeze-out, driven by negative vacuum pressure [31]
4
A comparison of statistical hadronization models 20 Sample I, full fit Sample I, no chemistry Sample I, no resonances Sample I, Hubble Sample I, γq,s=1 Sample II fit to no spread
10
18 16
600 events + − π,K ,K ,φ,p,Λ,Ξ,Ω and antiparticles
14
χ /DoF
Parameters: T,vT,dtf/dr,
8
normalization, λq,s,γq,s
Sample I, full fit Sample I, No resoances Sample I, No chemistry Sample I, γq,s=1 Sample II, fit to no spread
Parameters: T,vT,dtf/dr, normalization,
6 Fit to MC data sample I and II
160−8 DoF
4
Blast wave, dtf/dr=0 600 events + − π,K ,K ,φ,p,Λ,Ξ,Ω and antiparticles
1 0.10
10
2
2
χ /DoF
12
0.12
0.14 T [MeV]
0.16
2
0.18
0 −2.0
λq,s,γq,s 160−8 DoF Fit to MC Data sample I and II Blast wave, dtf/dr=0
−1.0
0.0 dtf/dr
1.0
2.0
dt
Figure 2. Results of fits to Montecarlo generated data samples I and II ( drf = 0): χ2 profiles for temperature (left) and fitted ∂tf /∂r (right). The models used in the fits are described in sections 1.1 and 1.2 Full fit includes fitted chemical potentials and γq,s , resonances and fitted ∂tf /∂r. Last profile shows effect of fitting sample II using Eq. 6 (Sample I Full fit)
• In [12] freeze-out happens at the same proper time τ throughout the fireball, (d3 Σµ ∝ uµ ). Freeze-out might have this form (“Hubble” freeze-out) if dynamical effects are negligible during hadronization [27]. An additional physical uncertainty, which is found to be correlated to flow and ∂tf /∂r in fits, is the flow profile. Hydrodynamics requires that each part of the fireball volume will in general have a different density and transverse expansion rate. For this reason, the integral over d3 Σ will in general span a range of flows, weighted by density function ρ(r). Z dtf dN )f (T, yT (r), λ)ρ(r) (5) E 3 = rdr(E − pT d p dr Just like the form of d3 Σ, the flow profile depends on the hadronization conditions. For instance, assuming that freeze-out happens at a critical energy density yields yT ∝ r [32], while assuming freeze-out happening at approximately the same time in the lab frame leads to a power distribution for the transverse expansion velocity vT ∝ rα [33] One can approximate the flow profile with one “average” flow and assume [10, 13] dN dtf ∝ (E − pT )f (T, < yT >, λ) (6) d3 p dr However, this approach might result in a systematic shift of fitted parameters such as flow and ∂tf /∂r E
2. Sensitivity to model choice The ambiguities presented in sections 1.1 and 1.2 mean that it is important to study their effect on the statistical model’s fitted parameters. One way to do this is to use a Montecarlo to generate data according to a particular freeze-out model, and to see what happens if the “wrong” model is used to perform the fit. We have written a MonteCarlo program which can be used for this purpose. While a detailed description
5
A comparison of statistical hadronization models 10
8
6
160−8 DoF
1
0.10
4
2
χ /DoF
2
χ /DoF
Parameters: T,vT,dtf/dr, normalization, λq,s,γq,s
Fit to MC Data sample III
Full fit no chemistry no resonances Hubble dtf/dr=0 γq,s=1
Blast wave, dtf/dr=1 600 events + − π,K ,K ,φ,p,Λ,Ξ,Ω and antiparticles
0.12
0.14 T [MeV]
0.16
0.18
Full fit No resonances No chemistry γq,s=1 Parameters: T,vT,dtf/dr, normalization, λq,s,γq,s 160−8 DoF
2
Fit to MC data sample III Blast wave, dtf/dr=1 600 events + − π,K ,K ,φ,p,Λ,Ξ,Ω and antiparticles
0 −2.0
−1.0
0.0
1.0
dtf/dr
dt
Figure 3. Results of fits to Montecarlo generated data samples III ( drf = 1): χ2 profiles for temperature (left) and fitted ∂tf /∂r (right). The models used in the fits are described in sections 1.1 and 1.2 Full fit includes fitted chemical potentials and γq,s , resonances and fitted ∂tf /∂r.
of the algorithm is outside the scope of this write-up [34], we shall provide a short summary of its features here. An acceptance/rejection algorithm is used to generate particles in a statistical distribution in the volume element’s rest frame. The accepted particles are then Lorentz transformed to the lab frame. (Any flow and density profile, as well as any freeze-out surface can be accomodated). Resonance decays are handled through Eq. 2, using the MAMBO algorithm [24] to generate points in phase space. Output can be used to generate spectra or fed into a microscopic model such as uRQMD [35]. The Montecarlo output was used to produce the data points in Fig. 1. It can be seen that a boost-invariant statistical hadronization can explain the global properties of the system such as dNtot /dη. It can also be verified that the role of resonances is absolutely crucial. We proceeded to generate three datasets of particles. Each data set had a temperature of 140 MeV, a maximum transverse flow of 0.55, and out of equilibrium chemistry (γq = 1.4, γs /γq = 0.8). Generated particles include π, K + , K − , p, p, Λ, Ξ, Ω and their resonances. The three samples differ in their choice of freeze-out geometry (specifically ∂tf /∂r) and flow profile: Sample I ∂tf /∂r = 0 and no flow profile, as fitted in [10] Sample II ∂tf /∂r = 0 and a quadratic flow profile, as fitted in [8, 9, 11] Sample III ∂tf /∂r = 1, the boost-invariant analogue of [13]. We have fitted the three samples to a variety of models, producing χ2 /DoF profiles for freeze-out temperature and the ∂tf /∂r parameter. Fig. 3 shows the profiles resulting in the fit to sample III while samples I and II are shown in Fig. 2. A full chemistry model with resonances (solid black line) seems to be equivalent (as far as the position of the χ2 minimum and the value of χ2 /DoF ) to a fit in which normalization is particle-specific (dashed red line). However, the chemical potential fit has greater statistical significance since considerably more degrees of freedom are required for arbitrary normalization.
6
A comparison of statistical hadronization models 8
Full fit No chemistry No resonances 3 "Hubble" freeze−out (d Σµ~uµ) Blast, dtf/dr=0 γq,s=1
10
6
Full fit no resonances no chemistry γq,s=1 +
+
χ /DoF
*
STAR (Λ,Ξ,Ω, and antiparticles,K ,φ) 4
2
2
χ /DoF
−
Fit to PHENIX (π,K ,K ,p,ap) and
−
Fit to PHENIX (π,K ,K ,p,ap) and * STAR (Λ,Ξ,Ω, and antiparticles,K ,φ)
2
Parameters: T,v,dtf/dr,normalization,λq,s,γq,s 194−8 DoF 1 0.10
0.12
0.14 T [MeV]
0.16
Parameters: T,v,dtf/dr,normalization,λq,s,γq,s 194−8 DoF
0.18
0 −2.0
−1.0
0.0
1.0
dtf/dr
Figure 4. Fit to RHIC data profiles for temperature (left) and fitted ∂tf /∂r (right). The models used in the fits are described in sections 1.1 and 1.2 Full fit includes fitted chemical potentials and γq,s , resonances and fitted ∂tf /∂r.
If chemical potentials are included resonances become essential since a fit with chemical potentials but no resonances (dotted blue line) loses all statistical significance. Similarly, the physical presence of non-equilibrium (γq,s 6= 1) means chemical potentials have to include the non-equilibrium parameter for the fit to be meaningful (black dot-dashed line). The freeze-out geometry does not seem to impact the temperature minimum that much. However, the correct freeze-out geometry can be picked out by a comparison of fits to different models by choosing the model with the lower χ2 /DoF . Moreover, data sensitivity to temperature is strongly affected by freeze-out geometry: Comparing the temperature profiles for different choices of ∂tf /∂r (Figs. 2 and 3) it is apparent that the temperature χ2 minimum is more definite in the ∂tf /∂r = 0 case. In the case of explosive freeze-out, the correlation between temperature and other parameters in the fit (notably flow) increases, resulting in a shallow χ2 increase at larger than minimum temperatures. Finally it should be noted that flow profile, freeze-out geometry and temperature appear to be strongly correlated. If data sample II is fitted with a distribution with no flow profile (such as Sample I) there is a non-negligible shift in both the fitted temperature and ∂tf /∂r, and a small rise in χ2 /DoF (Fig. 2, brown dot-dashed line). √ 3. Fit to RHIC data ( sN N = 130GeV ) Finally, we have perfomed a fit to the available RHIC data. The data sample we used is the same as the one used for the Montecarlo, but, since the STAR and PHENIX spectra had different trigger requirements (notably centrality) and acceptance regions, we have used two different system volumes, one for STAR particles and another one for PHENIX. The results are similar to the Monte Carlo data in many ways. The χ2 /DoF was only slightly larger. A fit with particle-specific normalization gives a very similar χ2 and fitted temperature to a fit including chemistry and resonances. If chemistry is included in particle spectra
A comparison of statistical hadronization models
7
analysis, resonances and non-equilibrium are essential. The fit to freeze-out geometry weakly points to ∂tf /∂r = 1, a picture that is supported by the temperature χ2 profile, virtually identical to data sample III. However, we can not claim our study to be complete in this respect, since we have not yet investigated the effect of including flow profile in the models. As Montecarlo simulations have shown, the conclusion can differ once these are taken into account. Fig. 5 shows the hyperon and pion spectra from the global fit of Fig. 4. A comparison of the fits on the left panel confirms that a model with no chemistry is about as good at fitting particle spectra as a model with resonances and chemical potentials. However, the second fit also has predictive power: We have used the fitted parameters to predict the mT spectrum for the Σ∗ . Unsurprisingly, we found that the Σ∗ should have roughly the same slope as the Ξs, but its total multiplicity should be about three times as big. We therefore suggest that a greater sample of spectra, in particular more spectra of heavy resonances taken within the same centrality bin as light particles (to make sure both flow and emission volume are the same for each particle) would help in establishing whether chemical potentials are a good way to normalize hadron spectra or not. The only spectrum which presents a significant systematic deviation for most models is the π − . As Fig. 5 (right panel) shows, most models fail to catch the upward dip of the low momentum pions, and indeed simple transverse expansion predicts the reverse trend [8, 9, 10, 11]. Including resonances, and allowing for γq > 1 helps (the latter is equivalent to postulating a pion “chemical potential” [36]) However, to fully account for the lowest momentum pions, even addition of resonances and γq > 1 are not enough. One has to add a power-law component to the pion spectrum � � dN A dN E 3 = E 3 + (7) d p d p cf (pT + pT 0 )α This contribution (roughly 6% of the total pion yield in the best fit) also accounts for the highest pT pions. Such a parametrization has been justified [37, 38] and successfully used [39] before. In conclusion, we have presented a comparison of different statistical models currently used to fit spectra in heavy ion collisions. We have described how these different models arise from different freeze-out scenarios of a system hadronizing from a thermalized quark gluon plasma. We have used MonteCarlo simulated data to study the sensitivity to model choice of presently available experimental data, and have evaluated different models ability to fit presently existing RHIC data. While data slightly favors a chemical non-equilibrium explosive freeze-out, there is not enough evidence to make a definitive conclusion about this issue. We hope the forthcoming 200 GeV results will clarify this further. Acknowledgments Supported by a grant from the U.S. Department of Energy, DE-FG03-95ER40937 . GT acknowledges partial conference support provided by NSF grant PHY-03-11859 We thank Magno Machado (IF-UFRGS) for helpful revision suggestions. References [1] E. Fermi, Prog. Theor. Phys. 5 (1950) 570.
8
A comparison of statistical hadronization models 10
10
0
Global fit (from Fig. 4): Hyperons
∗
Σ (1385)
−
Global fit (from Fig. 4): π
Ξ
10
−1
dN/pTdpT (a.u.)
dN/mTdmT (a.u)
10
Ω 10
10
−2
10
10
STAR Full fit No resonances or chemistry Montecarlo, full fit used as input
−3
10
10
3
2
1
0
−
PHENIX π (130 GeV) No resonances Resonances, γq=1 Resonances, γq Fitted (Full fit) α Resonances, γq Fitted + A/(pT+pT0)
−1
−4
0.5
1.5
2.5 mT [GeV]
3.5
0.0
1.0 pT [GeV]
2.0
Figure 5. Left: Ξ and Ω mT distributions, together with the global fit (from Fig. 4, solid black and dashed red). The model with chemical potentials (solid black) was used to predict the Σ∗ mT distribution using the Montecarlo. Right: PHENIX π − pT distribution, with the global fit from Fig 4. As can be seen, both resonances and γq help, but are not sufficient to explain the pion distribution fully.
[2] [3] [4] [5] [6] [7] [8] [9] [10] [11] [12] [13] [14] [15] [16] [17] [18] [19] [20] [21] [22] [23] [24] [25] [26] [27] [28] [29] [30] [31] [32] [33] [34] [35] [36] [37] [38] [39]
I. Pomeranchuk, Proc. USSR Academy of Sciences (in Russian) 43 (1951) 889. R. Hagedorn, Suppl. Nuovo Cimento 2 (1965) 147. J. Rafelski and J. Letessier, arXiv:nucl-th/0209084. P. Braun-Munzinger, I. Heppe and J. Stachel, Phys. Lett. B 465, 15 (1999). S. V. Akkelin, et al., Nucl. Phys. A 710, 439 (2002) [arXiv:nucl-th/0111050]. D. Magestro, J. Phys. G 28, 1745 (2002) [arXiv:hep-ph/0112178]. J. M. Burward-Hoy for the PHENIX collaboration, QM 2002 and proceedings M. Van Leeuwen for the NA49 collaboration, QM 2002 and proceedings Ladislav Sandor for the NA57 collaboration, these proceedings J Castillo for the STAR collaboration, these proceedings W. Broniowski and W. Florkowski, Phys. Rev. Lett. 87, 272302 (2001) [arXiv:nucl-th/0106050]. G. Torrieri and J. Rafelski, New J. Phys. 3, 12 (2001) [arXiv:hep-ph/0012102]. K. A. Bugaev, M. Gazdzicki and M. I. Gorenstein, arXiv:hep-ph/0211337. F. Cooper and G. Frye, Phys. Rev. D10 (1974) 186 K. A. Bugaev, Nucl. Phys. A 606, 559 (1996) [arXiv:nucl-th/9906047]. C. Anderlik et al., Phys. Rev. C 59, 3309 (1999) [arXiv:nucl-th/9806004]. M. Bleicher and J. Aichelin, Phys. Lett. B 530 (2002) 81 [arXiv:hep-ph/0201123]. P. Fachini [STAR Collaboration], arXiv:nucl-ex/0211001. G. Van Buren for the STAR collaboration, QM 2002 and proceedings C. Markert [STAR Collaboration], J. Phys. G 28, 1753 (2002). V. Friese [NA49 Collaboration], Nucl. Phys. A 698 (2002) 487. G. Torrieri and J. Rafelski, J. Phys. G 28, 1911 (2002) [arXiv:hep-ph/0112195]. R. Kleiss and W. J. Stirling, Nucl. Phys. B 385, 413 (1992). E. Schnedermann et. al Phys. Rev. C 48, 2462 (1993) [arXiv:nucl-th/9307020]. J. Letessier and J. Rafelski, Int. J. Mod. Phys. E 9, 107 (2000) [arXiv:nucl-th/0003014]. G. Torrieri and J. Rafelski, arXiv:nucl-th/0212091. A. Olszewski et al. [PHOBOS Collaboration], J. Phys. G 28, 1801 (2002). P. Staszel et al., Acta Phys. Polon. B 33, 1387 (2002). J. D. Bjorken, Phys. Rev. D 27, 140 (1983). J. Rafelski and J. Letessier, Phys. Rev. Lett. 85, 4695 (2000) [arXiv:hep-ph/0006200]. D. Teaney, J. Lauret and E. V. Shuryak, arXiv:nucl-th/0110037. E. Schnedermann and U. W. Heinz, Phys. Rev. C 47, 1738 (1993). QM2002 poster presentation, Abstract at http://alice-france.in2p3.fr/qm2002/ S. A. Bass et al., Prog. Part. Nucl. Phys. 41, 225 (1998) [arXiv:nucl-th/9803035]. B. Tomasik, et. al., Heavy Ion Phys. 17, 105 (2003) [arXiv:nucl-th/9907096]. R.D. Fields and R.P. Feynman, Phys. Rev. D 15, 2590 (1977); R. Hagedorn, Riv. Nuovo Cim. 6N10, 1 (1984). T. Peitzmann, arXiv:nucl-th/0303046.