We consider the distribution of the cross-periodogram, defined as the conjugate product of ... mal Variance Mean Mixtures, which are skewed forms of Gaussian.
A COMPLEX CROSS-SPECTRAL DISTRIBUTION MODEL USING NORMAL VARIANCE MEAN MIXTURES J. A. Palmer1, S. Makeig1 and K. Kreutz-Delgado2 1
Swartz Center for Computational Neuroscience Department of Electrical and Computer Engineering University of California San Diego, La Jolla, CA 92093 2
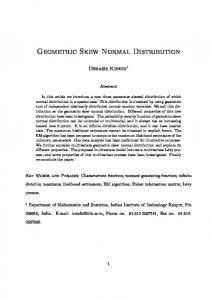
ABSTRACT We propose a model for the density of cross-spectral coefficients using Normal Variance Mean Mixtures. We show that this model density generalizes the corresponding marginal density of the Complex Wishart distribution for the cross-spectral density. The Maximum Likelihood estimate of parameters in the distribution is derived, and examples are given from alpha brain wave sources in separated EEG data. Index Terms— cross-spectrum, coherence, phase, estimation 1. INTRODUCTION We consider the distribution of the cross-periodogram, defined as the conjugate product of the complex short time Fourier transform coefficients at a given frequency. Cross-spectral coefficients are typically averaged to form estimates of the coherence and phase lag between two random processes at a given frequency. To use these estimates in analysis or decision making, we would like to have exact or at least approximate forms of the probability density of the estimates. Estimation of coherence between signals is important in many signal processing areas, including communications and biological signal processing. We propose a derivation of the distribution of cross-spectral coefficients based on the spectral representation of stationary processes. This derivation leads to the consideration of Normal Variance Mean Mixtures, which are skewed forms of Gaussian Scale Mixtures. To fix ideas and describe the practical context that motivates the present work, consider the application of electroencephalogram (EEG) analysis [1]. In the EEG setup, an array of electrodes on the scalp records the superposition of ambient electromagnetic field generating sources. The technique of Independent Component Analysis (ICA) [1] has been applied successfully to such recordings to separate them into brain components of interest, and artifacts and interfering signals not of interest. Figure 1 shows EEG data after it has been separated into independent source activations using ICA, along with the corresponding scalp maps defining the projection of the source activity to the scalp. A prominent rhythm in the recording is the alpha, or 10 Hz, rhythm, and this rhythm is also present in several of the separated components. ICA separates out the alpha activity into a small number of components with spatially distinct scalp maps. These components however have residual dependence that cannot be eliminated by an instantaneous linear unmixing. This research was partially supported by NSF grants ISS-0613595 and CCF-0830612.
The assumption of independence among the brain sources is, however, only made as an analytical expedient. Ultimately we would like to model any residual dependence that might remain after the attempted separation, and indeed such residual dependence is often the primary object of inquiry. A type of signal dependence of central importance in the analysis of EEG and MEG signals in neuroscience is coherence. Components 6, 12, and 22 each show significant alpha activity at similar times. The scalp maps each project widely, to largely distinct regions. A basic question is whether or not the alpha activity separated by ICA is in indeed independent, or whether it represents aspects of a single underlying dynamic alpha phenomenon involving all of these components, which is responsible for all of the alpha. In the latter case, the alpha signals in the (supposedly) separated components should be phase coherent (as well as amplitude coherent), i.e. the periodic activity washing over them should have a constant phase delay. 2. COMPLEX CROSS SPECTRA Given two real-valued, zero-mean, discrete time stationary random processes, X1 (t) and X2 (t), the cross-spectrum S12 (ω) is defined P∞ 1 by S12 (ω) , 2π τ =−∞ R12 (τ ) exp(− ωτ ), where we denote √ the imaginary number by , −1, E{·} denotes expectation, and R12 (τ ) = E{x1 (t + τ )x2 (t)} is the cross-covariance. Using the spectral representation, the stationary time-series Xi (t) can be represented as a sum of complex exponentials, Z π Xi (t) = exp( ωt) dZi (ω) −π
where Zi (ω) is an orthogonal increment process. The cross spectrum can also be written, S12 (ω) = E{dZ1 (ω) dZ2∗ (ω)} If we interpret the increment dZi (ω) as the coefficient of exp( ωt) in the Xi (t), then S12 (ω) may be interpreted as the average value of the product of these coefficients of exp( ωt) in the processes X1 and X2 [2, p. 659]. Letting dZi (ω) = |dZi (ω)| exp( φi (ω)), we see that, � S12 (ω) = E |dZ1 (ω)||dZ2 (ω)| exp((φ1 (ω) − φ2 (ω))) Thus the magnitude of the cross-spectrum is approximately the average of the product of the magnitudes of the spectra of X1 and X2 at the frequency ω, while the phase of the cross-spectrum is approximately the average difference in the phases of X1 and X2 at frequency ω [2, pp. 660-661].
2 20
34
40 2
33
2 60
33
1 60
36
1 65
36
1 60
36
(a)
(b)
10
10
8
8
1 2 3
5 6 7 8 9 10 11
imaginary part
imaginary part
4
6 4 2
6 4 2
12 13
0
0
−2 −6
−2
14 15 16 17
−4
−2
18
0 2 real part
4
6
−5
0 real part
5
19 20
(c)
21 22 23
(d)
8
8
6
6
24 25
+ −
28 69
70
71
72
73
74
75
76
77
78
log histogram
15
27
log histogram
Scale
26
4
2
4
2
(a) Separated EEG activations 0 −6
1
2
−4
−2
0 2 real part
4
6
0 −2
0
2 4 6 imaginary part
8
10
3
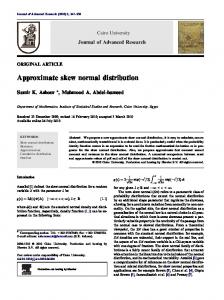
Fig. 2. Complex cross-periodogram of components 6 and 12, at 10Hz (sampling rate 256Hz). 3000 samples using non-overlapping blocks of 750 ms (192 samples). (a) Scatter plot of complex crossperiodogram values. (b) Contour plot of smoothed 2D histogram. (c) Log histogram of the real part. (d) Log histogram of imaginary part. Note the log convexity of the tails. (b) EEG component maps
(c) Alpha components 6, 12, 22
Fig. 1. Separated EEG components. (a) Activation time series of top variance components in EEG unmixed using ICA. (b) Component maps corresponding to the activations in (a). (c) Component maps corresponding to the alpha activations in components 6, 12, and 22 respectively.
The spectral representation and the convenience of the FFT motivate the following estimate for the cross-spectrum. Define the finite Fourier transform of the T -sample segment of process i by, T 1 X dXi(ω) , √ Xi (t) exp(− ωt) T t=1
A window or taper is commonly used as a convergence factor [3], but we shall suppress this here for simplicity of exposition since the results are largely independent of the taper. The periodogram for process i is defined by [3, p. 120], Iii (ω) , (2π)−1 |dXi(ω)|2 The periodogram is used as a statistic for the estimation of the power spectral density. Similarly, the cross-periodogram, defined for processes X1 and X2 by, I12 (ω) , (2π)−1 dX1(ω) d∗X2(ω) is used as a statistic for the estimation of the cross-spectrum. The form of the distribution is motivated by the following simplified model. We shall be interested primarily in estimating the cross-spectra between two series whose individual spectral densities are sharply peaked about a particular frequency. We thus model
the two processes X1 (t) and X2 (t) as follows. Suppose we have B segments, or blocks, of each process. We model the realization in the kth segment by, 1/2
X1 (t)
=
ξk A1 cos(ωt + θk ) + ν1 (t)
X2 (t)
=
ξk A2 cos(ωt + θk + φ) + ν2 (t)
1/2
where ν1 (t) and ν2 (t) are independent stationary noise processes with spectra N1 (ω) and N2 (ω) respectively. The random nonnegative amplitude coefficient ξk reflects a common power source modulating the processes X1 and X2 , scaled respectively by the positive amplitudes A1 and A2 , which are taken to be constant. The segments are taken to be chosen such that the phase θk is uniformly random over (−π, π), with the phase lag between X1 and X2 at frequency ω given by φ, which is taken to be constant. We now consider the distribution of the cross-periodogram statistic for X1 (t) and X2 (t). The Fourier coefficients, dXi (ω) are given by, T
dX1 (ω)
= =
1 X √ X1 (t) exp(− ωt) T t=1 √ 1/2 1 T A1 exp( θk ) ξk + dν1 (ω) 2
Similarly, dX2 (ω)
=
1 2
√
1/2
T A2 exp( θk ) exp( φ) ξk + dν2 (ω)
The cross-periodogram statistic is thus given by, 2π I12 (ω) =
1 4
A1 A2 exp(− φ) T ξk + Yk (T ξk )1/2 + Wk
(1)
where,
3.2. Distribution of cross spectra
Yk = 12 A1 exp( θk ) d∗ν2 (ω) + 12 A2 exp(− θk ) exp(− φ)dν1 (ω)
P H If x is complex Normal, then the distribution of N t=1 xt xt is complex Wishart [3, 6]. The distribution is defined over the set of Hermitian, positive semi-definite S ∈ Cn×n , � p(S; Σ) = C(n, N )−1 |Σ|−N |S|N−n exp − trace(Σ−1 S)
and, Wk = dν1(ω) d∗ν2 (ω) Yk is the sum of independent complex Normal random variables, and is thus complex Normal (and circular). Wk is a complex Gaussian scale mixture, which is also circular. We assume that the noise processes have relatively small variance so that the distribution of Wk is concentrated around zero and does not significantly influence the form of the distribution of I12 (ω). From (1), we see that the joint distribution of the real and imaginary parts of I12 (ω) has the form of a Normal Variance Mean Mixture [4], x = ξ 1/2 z + ξ β
(2)
convolved with the distribution of Wk . The non-negative scale mixing random variable is T ξ, and the drift (or skew, or bias) vector β = 41 A1 A2 exp(−φ). 3. COMPLEX GAUSSIAN SCALE MIXTURES AND NORMAL VARIANCE MEAN MIXTURES Real valued scalar R ∞ Gaussian scale mixtures (GSMs) [4, 5] have the form p(x) = 0 N (x; 0, ξ) dF (ξ), where N (x ; µ, σ 2 ) denotes the Gaussian density with mean µ and variance σ 2 . A GSM distributed random variable, x, can be represented as a product x = ξ 1/2 z, where p(x|ξ) = N (0, ξ). Vector GSMs, e.g. x = ξ 1/2 z, where z ∼ N (0, Σ), produce ellipsoidally symmetric densities. Perhaps the most familiar GSM is Student’s t distribution for the mean of a Gaussian sample scaled by square root of its sample variance. Since the sample mean and variance are independent, and the sample mean is Gaussian, the normalized sample mean is a Gaussian scale mixture, with mixing density distributed as inverse χ2 . Normal Variance Mean Mixtures (NVMMs) are a generalization of GSMs, and can be represented in the form, x = ξ 1/2 z + ξβ. The resulting density is non-ellipsoidally symmetric (non-circular), and skewed in the direction of β, in a cone like shape. Note that the particular combination of exponents ξ 1/2 and ξ is required for the analytical tractability. 3.1. Complex Fourier coefficients of stationary time series Fourier coefficients of a stationary time series are complex valued random variables, possessing a (circular) complex Normal distribution [3, 6, 7], denoted, x ∼ NC (c, Σ). The (real domain) joint probability density over the real and imaginary parts, (xR , xI ) can be written in terms of complex quantities p(x) , p(xR , xI ) as, p(x; c, Σ) = π
−n
(det Σ)
−1
H
exp − (x − c) Σ
−1
(x − c)
�
In particular, the univariate complex normal distribution is given by NC (x; µ, σ 2 ) = π −1 σ −2 exp(−σ −2 |x − µ |2 ) where xR and xI are independent N (µR , σ 2 /2) and N (µI , σ 2 /2) respectively. As in the real valued case, scale mixtures of complex Normals and complex NVMMs may also be constructed. The scalar multiplier is real valued, and multiplies a complex random vector. NVMMs are also extendable to complex random vectors with complex drift.
Q where N ≥ n, and C(n, N ) = π n(n−1)/2 N i=1 Γ(N − i + 1). The distribution of the cross-periodogram for complex Normal random variables when N ≥ n may be obtained by calculating the marginal distribution of an off-diagonal element of the complex Wishart density. But the distribution of the cross-periodogram values themselves (without summing over multiple blocks) has N = 1, and thus even for the minimal dimension of 2 which is necessary for a cross-periodogram, this form of complex Wishart distribution fails to describe the distribution of the raw cross-periodogram values. We may also determine the raw cross-periodogram distribution directly, as follows. Proposition 1. Let x1 and x2 be complex Normal distributed random variables with complex covariance Σ. Then the random variable s = x1 x∗2 is a complex Normal Variance Mean Mixture with χ2 distributed mixing density. Proof. Define the Cholesky factorization Σ = TH T, where � � T11 T12 T= 0 T22 with T11 , T22 > 0. Then x = [x1 x2 ]T can be represented as x = Tz, where z = [z1 z2 ]T with z1 and z2 complex Normal and independent. Then we have, x1 x∗2
= = =
(T11 z1 + T22 z2 )T22 z2∗ T11 z1 z2∗ + T12 T22 |z2 |2
|z2 |T11 e−φ2 z1 + |z2 |2 T12 T22
Thus x1 x∗2 is distributed as a Normal Variance Mean mixture distribution with mixing variable ξ = |x2 |2 , which has a χ2 distribution. The resulting Gaussian scale mixture has a Mackay’s Bessel K distribution [4]. Note that Mackay’s Bessel K distribution has exponential, log concave tails. Student’s t distribution, which has mixing density inverse gamma distributed, does not admit skew because it has asymptotically algebraic tails, while skewed NVMMs require exponential tails [4]. 3.3. Generalized Inverse Gaussian and Generalized Hyperbolic The Generalized Inverse Gaussian (GIG) density [4, 8, 9] can be thought of as a combination and generalization of the gamma and inverse gamma distributions. The GIG density has the form, � �� (κ/δ)λ λ−1 N † ξ ; λ, δ 2 , κ2 = ξ exp − 12 δ 2 ξ −1+κ2 ξ (3) 2 Kλ (δκ) for ξ > 0, where Kλ is the Bessel K function, or modified Bessel function of the second kind. The moments of the Generalized Inverse Gaussian are easily found by direct integration, using the fact that (3) integrates to one, � �r δ Kλ+r (δκ) E{ξ r } = (4) κ Kλ (δκ)
log likelihood = −0.37487 −0.2 1 0 −1 log density
0 −1 −2 −3 −4
−2 −3 −4
−5
−5
−6
−6
−7 −6
−7 −2
−4
−2
0 2 real part
4
6
−0.4 log likelihood
1
log density
The parameters λ, δ, and κ are redundant given the scale. As we will estimate the scale of the complex normal and the norm of the drift vector directly, we will eliminate this redundancy by setting κ = 1 in the mixing density. The generalized hyperbolic distribution [4], in dimension d, is the Normal Variance Mean Mixture with GIG mixing density. We write the generalized hyperbolic density in the form,
−0.6
−0.8
−1
0
2 4 6 imaginary part
8
−1.2
10
0
20
40 iteration
60
80
log likelihood = −0.33553
where δ(x) ,
q
�λ−d/2
×
� Kλ−d/2 δ(x)κ(β) exp(β T Σ−1 x)
δ 2 + kxk2Σ−1 and κ(β) ,
q
(5)
0
Writing out the “complete likelihood” of (ξ, x), we get, p(ξ, x; Σ, β, δ, λ) = (2π)−d/2 |Σ|−1/2 ξ −d/2 p(ξ; λ, δ) � � × exp − 21 ξ −1 xT Σ−1 x + β T Σ−1 x − 12 ξ β T Σ−1 β
(6)
It can be seen that the posterior density of ξ given x is also GIG. Taking the logarithm, we see that we require two posterior moments, E{ξ|x} and E{ξ −1 |x}. which are found using (4) to be, �r � δ(x) Kλ−d/2+r (δ(x)κ(β)) r E{ξ |x; Σ, β, δ, λ} = κ(β) Kλ−d/2 (δ(x)κ(β)) In the case of the complex cross-spectra, the complex random variable can be seen as a two dimensional random vector containing the real and imaginary parts. In this case the variance is just a scalar, Σ = σ 2 , giving the cross-spectral amplitude correlation. Let x be the vector of real and imaginary parts of the cross-periodogram statistic, so that the cross-periodogram is in R2 . The maximization steps can be computed in closed form. Define ξt , E{ξ|xt ; Σ, β, λ, δ} and γt , E{ξ −1 |xt ; Σ, β, λ, δ}, in dimension d = 2, and define the quantities, PN PN a = N1 b = N1 t=1 γt , t=1 ξt Also let c =
1 N
PN
t=1
xt . Then the updates are given by,
β
=
c/b
σ2
=
1 a 2
− cT β + 12 b kβk2
(7) (8)
This algorithm monotonically increases the likelihood with no step size parameters. We may also fit the parameter δ by gradient ascent on the complete log likelihood as follows, ∆δ ∝
Kλ+1 (δ) 2λ − − aδ Kλ (δ) δ
−1
−2 −3 −4
−3 −4 −5
−6
−6 −2
0 2 real part
4
6
−0.5
−2
−5
−4
−0.4
−7 −2
−0.6 −0.7 −0.8 −0.9
0
2 4 6 imaginary part
8
10
−1
0
20
40 iteration
60
80
Fig. 3. Fits using the EM algorithm. Top row: one model, λ = 0. Bottom row: two models λ1 = 0, λ2 = 1. The δ parameters were optimized with the σ and β parameters. Last panel demonstrates monotonicity of the closed form algorithm.
4. MAXIMUM LIKELIHOOD BY EM Given the mixing random variable ξ, a NVMM is Normal, Z ∞ � p(x; Σ, β) = N x ; ξβ, ξΣ p(ξ) dξ
0
−1
−7 −6
1 + kβk2Σ−1 .
1
0
log likelihood
δ(x) κ(β)
1 δ λ Kλ (δ)
log density
�
1
1 (2π)d/2 |Σ|1/2
log density
GH(x; Σ, β, δ, λ) =
5. DISCUSSION AND CONCLUSION The probabilistic EM framework allows straightforward extension to a mixture of complex NVMM densities. In Figure 3, we see in the top row that while the Maximum Likelihood fit of a single generalized hyperbolic is log convex and more likely than the single Wishart model, it nevertheless poorly captures the coherence tail. The bottom row of Figure 3 shows that the ML estimate of a mixture densities, a non-coherent (circular) complex GSM and a coherent NVMM (non-circular) density, yields a good fit. This is not surprising since examination of the data shows that the signals are not oscillating at alpha continuously, but only over certain periods. The mixture model then gives an estimate of the relative proportions of the coherent and non-coherent periods, as well as a simple Bayesian detection for the (blindly learned) coherence model vs. the non-coherent model. The EM algorithm provides monotonic convergence with closed form updates. 6. REFERENCES [1] S. Makeig, A. J. Bell, T.-P. Jung, and T. J. Sejnowski, “Independent component analysis of electroencephalographic data,” in Advances in Neural Information Processing Systems, D. Touretzky, M. Mozer, and M. Hasselmo, Eds. 1996, pp. 145– 151, MIT Press, Cambridge, MA. [2] M. B. Priestley, Spectral Analysis and Time Series, vol. 2, Academic Press: London, 1981. [3] D. R. Brillinger, Time Series: Data Analysis and Theory, SIAM: Philadelphia, 2001, Reproduction of original publication by Holden Day, Inc., San Francisco, 1981. [4] O. Barndorff-Nielsen, J. Kent, and M. Sørensen, “Normal variance-mean mixtures and z distributions,” International Statistical Review, vol. 50, pp. 145–159, 1982. [5] D. F. Andrews and C. L. Mallows, “Scale mixtures of normal distributions,” J. Roy. Statist. Soc. Ser. B, vol. 36, pp. 99–102, 1974. [6] N. R. Goodman, “Statistical analysis based on a certain multivariate complex Gaussian distribution (an introduction),” The Annals of Mathematical Statistics, vol. 34, no. 1, pp. 152–177, 1963. [7] E. J. Hannan, Mutltiple Time Series, John Wiley & Sons, Inc., New York, 1970. [8] T. Eltoft, T. Kim, and T.-W. Lee, “Multivariate scale mixture of Gaussians modeling,” in Proceedings of the 6th International Conference on Independent Component Analysis, J. Rosca et al., Ed. 2006, Lecture Notes in Computer Science, pp. 799–806, Springer-Verlag. [9] J. A. Palmer, K. Kreutz-Delgado, B. D. Rao, and S. Makeig, “Modeling and estimation of dependent subspaces with non-radially symmetric and skewed densities,” in Proceedings of the 7th International Conference on Independent Component Analysis, M. E. Davies, C. J. James, S. A. Abdallah, and M. D Plumbley, Eds. 2007, Lecture Notes in Computer Science, Springer-Verlag.