bioRxiv preprint first posted online Nov. 16, 2017; doi: http://dx.doi.org/10.1101/220079. The copyright holder for this preprint (which was not peer-reviewed) is the author/funder. It is made available under a CC-BY-NC-ND 4.0 International license.
1
2
3
4
5
6
ChIPdig: a comprehensive user-friendly tool for mining multi-sample ChIP-seq data 1*
Ruben Esse
1
and Alla Grishok
1
Department of Biochemistry, Boston University School of Medicine, Boston, MA 02118, USA
*Correspondence:
[email protected]
Abstract
7
Background:
8
sequencing technologies become more accessible and affordable. However, this advancement has not
9
been matched with similar progress in data analysis capabilities from the perspective of experimental
10
biologists not versed in bioinformatic languages. For instance, chromatin immunoprecipitation followed
11
by
12
transcription
13
mapping
14
sophisticated analyzes aimed
15
designs
16
comprehensive
17
researchers who would like to generate genomic data.
18
Results:
19
allow researchers to perform several analyzes, namely read mapping to a reference genome, peak
20
calling, annotation of regions based on reference coordinates (e.g. transcription start and termination
21
sites, exons, introns, 5' UTRs and 3' UTRs), and generation of heatmaps and metaplots for visualizing
In recent years, epigenetic research has enjoyed explosive growth as high-throughput
next-generation
and
factor
peak
constitute
sequencing
binding
calling,
a
(ChIP-seq)
and
can
histone
be
at
present
modifications.
accomplished
widely
Basic
through
used
ChIP-seq
several
to
identify
data
genomic
analysis,
well-established
analysis
bottleneck.
pipeline
We
could
reason
be
that
beneficial
the
for
tools,
implementation
many
loci
including
at comparing data derived from different conditions or
significant
ChIP-seq
is
but
of
read
more
experimental
of
experimental
a
single
(wet
lab)
Here we present ChIPdig, a stand-alone application with adjustable parameters designed to
ChIPdig: a comprehensive user-friendly tool for mining multi-sample ChIP-seq data R. Esse and A. Grishok
Page
1 of 16
bioRxiv preprint first posted online Nov. 16, 2017; doi: http://dx.doi.org/10.1101/220079. The copyright holder for this preprint (which was not peer-reviewed) is the author/funder. It is made available under a CC-BY-NC-ND 4.0 International license.
22
coverage.
23
differential enrichment analysis in regions of interest to be performed. ChIPdig is written in R and
24
enables access to several existing and highly utilized packages through a simple user interface powered
25
by the Shiny package. Here, we illustrate the utility and user-friendly features of ChIPdig by analyzing
26
H3K36me3 and H3K4me3 ChIP-seq profiles generated by the modENCODE project as an example.
27
Conclusions:
28
ChIP-seq data by both experimental and computational researchers. It is open source and available at
29
https://github.com/rmesse/ChIPdig.
30
Importantly,
accepts
multiple
ChIP-seq
datasets
as
input,
allowing
genome-wide
ChIPdig offers a comprehensive and user-friendly pipeline for analysis of multiple sets of
Keywords
31
ChIP-seq;
32
heatmaps; metaplots
33
ChIPdig
read
mapping;
peak
calling;
genomic
region
annotation;
differential
enrichment
analysis;
Background
34
Interactions between nuclear proteins and DNA are vital for cell and organism function. They control
35
DNA replication and repair, safeguard genome stability, and regulate chromosome segregation and gene
36
expression. Chromatin immunoprecipitation coupled with high-throughput sequencing (ChIP-seq) is a
37
powerful method for assessing such interactions and has been widely used in recent years to map the
38
location of post-translationally modified histones, transcription factors, chromatin modifiers and other
39
non-histone DNA-associated proteins in a genome-wide manner. This progress has been fostered by the
40
increasing
41
technical support available to researchers, including commercial library preparation kits, aided by the
42
plummeting costs of sequencing and the ease of multiplexing samples. In light of this progress, ChIP-seq
43
data sets are continuously deposited in publicly-accessible databases, such as the National Center for
technical
feasibility
and
affordability
of
this
technology,
with
more
documentation
ChIPdig: a comprehensive user-friendly tool for mining multi-sample ChIP-seq data R. Esse and A. Grishok
Page
and
2 of 16
bioRxiv preprint first posted online Nov. 16, 2017; doi: http://dx.doi.org/10.1101/220079. The copyright holder for this preprint (which was not peer-reviewed) is the author/funder. It is made available under a CC-BY-NC-ND 4.0 International license.
44
Biotechnology Information's (NCBI) Gene Expression Omnibus (GEO) and the ENCODE consortium portal
45
[1]. Therefore, there is an unprecedented wealth of epigenomic data in the public domain that can be
46
used for integrative and correlative analyses.
47
This important advancement had not been accompanied with similar progress in user-friendly post-
48
sequencing
49
bioinformaticians. A key step in ChIP-seq data analysis is to map reads to a reference genome assembly.
50
Programs such as BWA [2] or Bowtie/Bowtie2 [3,4] are frequently employed for this purpose. Aligned
51
data are then processed to find regions of enrichment along the genome, thereby identifying potential
52
loci of DNA binding by the target protein or of deposition of the histone post-translational modifications
53
of interest. This process is known as peak calling and can be performed by using algorithms such as
54
MACS/MACS2
55
sequencing (NSG) analysis that provides various utilities for manipulating alignments, including sorting,
56
merging, indexing and generating alignments in a per-position format [8].
57
Following
58
analysis is often more customizable and may present a hurdle, especially in the case of comparing data
59
derived
60
fragmentation, variation of immunoprecipitation efficiency, as well as polymerase chain reaction (PCR)
61
amplification and sequencing depth bias, result in ChIP-seq experiments with distinct signal-to-noise
62
ratios and impose great challenges to the computational analysis [9]. Several methods addressing the
63
differential enrichment analysis problem, i.e. the detection of genomic regions with changes in ChIP-seq
64
profiles
65
Generally, these methods rely on the initial detection of candidate peak regions by a conventional peak
66
calling algorithm, and then this peak-defining information is applied to analysis with methods tailored
67
for the differential expression analysis of RNA-seq data such as edgeR [13] or DESeq [14]. Downstream
data
the
from
analysis
[5,6]
and
initial
between
SICER
and
different
two
pipelines,
[7].
common
conditions
distinct
which
is
still
SAMtools
steps
or
samples
in
is
a
another
ChIP-seq
experimental
or
significant
sets
of
bottleneck
popular
data
analysis
settings.
replicate
software
often
used
mentioned
Artifacts
samples,
in
been
by
from
downstream
bias
proposed
of
DNA
[10–12].
ChIPdig: a comprehensive user-friendly tool for mining multi-sample ChIP-seq data R. Esse and A. Grishok
skilled
next-generation
above,
arising
have
handled
Page
3 of 16
bioRxiv preprint first posted online Nov. 16, 2017; doi: http://dx.doi.org/10.1101/220079. The copyright holder for this preprint (which was not peer-reviewed) is the author/funder. It is made available under a CC-BY-NC-ND 4.0 International license.
68
analysis of ChIP-seq data may also involve the annotation of genomic regions based on reference
69
coordinates (e.g. distance from nearest transcription start site) and visualization of normalized coverage
70
by means of heatmaps and metaplots.
71
Importantly, ChIP-seq data analysis typically relies, at least in part, on tools that have been designed to
72
run
73
unfamiliar with such operating systems. In the past few years, several packages designed to handle NGS
74
data have been released for R, a popular platform-independent programming language and software
75
environment for computing and graphics. Here we present ChIPdig, an open-source application that
76
leverages on several R packages to enable comprehensive and modular analysis of multi-sample ChIP-
77
seq data sets through a user-friendly graphical user interface (GUI), allowing any experimental biologist
78
with minimal computational expertise to use it easily.
79
primarily
on
Linux/Unix-based
systems,
while
biologists
who
need
to
work
with
NGS
may
be
Implementation
80
ChIPdig is developed in R using package Shiny and relies on multiple R/Bioconductor packages, including
81
QuasR and BSgenome [15], for mapping reads to a reference genome assembly [16], BayesPeak for peak
82
calling [17], csaw [12] and edgeR [13] for differential enrichment analysis, ChIPseeker for annotation of
83
genomic
84
Packages used in several analysis modules implemented in ChIPdig are GenomicRanges [20], valr [21],
85
shinyFiles, GenomicFeatures, ggplot2, ggsignif, reshape2 and circlize. A few command lines provided in
86
https://github.com/rmesse/ChIPdig suffice to launch the GUI from within R Studio, allowing integrative
87
and
88
experience from the user.
regions
interactive
of
interest
usage
of
[18],
these
and
EnrichedHeatmap
powerful
libraries
for
without
generating
requiring
coverage
heatmaps
programming
or
[19].
statistical
89
90
ChIPdig: a comprehensive user-friendly tool for mining multi-sample ChIP-seq data R. Esse and A. Grishok
Page
4 of 16
bioRxiv preprint first posted online Nov. 16, 2017; doi: http://dx.doi.org/10.1101/220079. The copyright holder for this preprint (which was not peer-reviewed) is the author/funder. It is made available under a CC-BY-NC-ND 4.0 International license.
91
Results
92
ChIPdig has the following capabilities: (1) alignment of reads to a reference genome; (2) normalization
93
and comparison of distinct ChIP-seq data sets; (3) annotation of genomic regions; (4) generation of
94
comparative heatmaps and metaplots for visualization of normalized coverage in user-defined specific
95
regions. Each capability corresponds to a specific analysis module which can be loaded separate from
96
other modules and using different input files. To illustrate each module, raw single-end ChIP-seq data
97
for H3K4me3 and H3K36me3 in the model organism
98
NCBI GEO with series IDs GSE28770 and GSE28776, respectively. These two histone modification marks
99
have different distribution profiles, namely promoter-proximal enrichment with punctuated peaks for
100
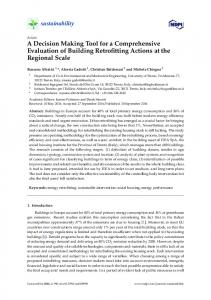
H3K4me3, and gene body enrichment with broad peaks for H3K36me3 [22]. Figure 1 shows the GUI
101
displayed
102
corresponding to one of the four analysis modules, as well a clickable box for selection of the folder
103
containing the input files for the analysis.
104
• Alignment of ChIP-seq reads
105
The aligning module of ChIPdig relies primarily on the QuasR package, which supports the analysis of
106
single-read and paired-end deep sequencing experiments [16]. If desired, read preprocessing can be
107
performed to prepare the input sequence files prior to alignment, e.g. removal of sequence segments
108
corresponding to adapters and low quality reads. Sequence files in FASTQ format for each input DNA
109
and ChIP sample corresponding to the H3K4me3 and H3K36me3 ChIP-seq experiments were aligned to
110
the WS220/ce10 reference genome (available through the BSgenome package [15]) (Fig. 2), producing
111
an average of 10 million mapped reads per sample. A report with several quality metrics for each
112
alignment was automatically generated and is available in Additional file 1.
upon
launching
ChIPdig
from
R
Studio.
Caenorhabditis elegans
The
left
pane
displays
were downloaded from
four
radio
buttons,
each
113
ChIPdig: a comprehensive user-friendly tool for mining multi-sample ChIP-seq data R. Esse and A. Grishok
Page
5 of 16
bioRxiv preprint first posted online Nov. 16, 2017; doi: http://dx.doi.org/10.1101/220079. The copyright holder for this preprint (which was not peer-reviewed) is the author/funder. It is made available under a CC-BY-NC-ND 4.0 International license.
114
• ChIP-seq data normalization, peak calling and differential enrichment analysis
115
A recurrent problem in ChIP-seq data analysis lies at the comparison of multiple coverage profiles
116
generated
117
addressed in the second analysis module of ChIPdig. Upon its selection, the user is prompted to provide
118
a tab-delimited text file with the names of each ChIP sample (treatment) mapped reads file in BAM
119
format, the matching input DNA (control) file, a sample ID, the condition or target name, and a color
120
designation for the output peak and coverage files (Fig. 3a). Any of the 657 R built-in colors can be
121
chosen (Additional file 2). A bin size parameter set to 50 bp (base pairs) by default is used in both peak
122
calling and genome-wide library normalization for differential enrichment analysis. If desired, duplicate
123
reads can be removed prior to normalization and sequences can be extended to a median fragment
124
length that can be estimated either computationally or experimentally (e.g. average size of fragments
125
generated by chromatin shearing) (Fig. 3b). The initial mapped read processing outputs a table with
126
library sizes and median fragment sizes, a chromosome size list, and a multidimensional scaling plot
127
representing the similarity of samples in the data set (Fig. 3c). Data are normalized based on library sizes
128
and on the trimmed means of M values (TMM) approach [23], which is implemented in the edgeR
129
package [13].
130
Completion of the initial processing of mapped reads releases options for downstream processing which
131
are posted to the sidebar panel, namely export of files representing sequencing coverage, peak calling
132
and differential enrichment analysis (Fig. 4). Coverage is expressed in log2-transformed counts per
133
million (cpm) for each genomic bin and, for each sample ID indicated by the user, three files with
134
bedGraph
135
treatment-to-control ratio. Each file can be loaded onto a genome browser for visualization (Fig. 5).
136
Peak calling is performed via the BayesPeak package by using a hidden Markov model and Bayesian
137
statistical methodology [17]. The user
from
different
format
are
experiments
generated:
or
corresponding
treatment
(ChIP
to
sample),
different
control
conditions.
(input
DNA
This
problem
sample)
and
the
specifies a posterior probability (PP) threshold and genomic
ChIPdig: a comprehensive user-friendly tool for mining multi-sample ChIP-seq data R. Esse and A. Grishok
is
Page
6 of 16
bioRxiv preprint first posted online Nov. 16, 2017; doi: http://dx.doi.org/10.1101/220079. The copyright holder for this preprint (which was not peer-reviewed) is the author/funder. It is made available under a CC-BY-NC-ND 4.0 International license.
138
regions with PP above such threshold are identified as peaks. If replicates are indicated, commonly
139
enriched genomic regions representing replicated peaks can be derived, and a track definition line can
140
be added, allowing each file to be loaded onto the UCSC genome browser for visualization. In addition, a
141
consensus peak set representing all candidate enriched regions across the full data set may be obtained.
142
The user may be interested in choosing this option for posterior differential enrichment analysis. Peak
143
calling was performed for the H3K4me3 and H3K36me3 ChIP-seq data sets, yielding 4994 replicated
144
peaks for H3K4me3 (Additional file 3) and 25855 replicated peaks for H3K36me3 (Additional file 4).
145
Differential enrichment analysis resorts to functions implemented in the csaw [12] and edgeR [13]
146
packages. Following library size and TMM normalization, bin-level coverage is computed and, if desired,
147
bins in which coverage for input DNA samples exceeds that of the corresponding ChIP samples are
148
filtered off. If the user is interested in differential enrichment analysis in a specific set of regions, the
149
corresponding file in BED format has to be provided. To illustrate this feature of ChIPdig, differential
150
enrichment analysis was performed for comparing H3K4me3 coverage with that of H3K36me3 using
151
either H3K4me3 replicated peak coordinates (Fig. 6a and Additional file 5) or those corresponding to
152
H3K36me3 peaks (Fig. 6b and Additional file 6), with a false discovery rate (FDR) threshold of 0.1. As
153
expected, at H3K4me3 genomic peak coordinates, H3K4me3 coverage is greater than that of H3K36me3,
154
and the opposite is observed for H3K36me3 peaks.
155
• Annotation of genomic regions
156
Annotation of genomic regions of interest is performed via the ChIPseeker package [18]. The user
157
supplies the file with regions in BED format and chooses the reference genome assembly, as well as the
158
distance
159
assignment of promoter regions (Fig. 7a). Replicated H3K4me3 and H3K36me3 peaks were annotated
160
and, characteristically of these marks [22], most H3K4me3 peaks were assigned to promoters (Fig. 7b
upstream and downstream
of the
annotated
transcription
start site
to be considered for
ChIPdig: a comprehensive user-friendly tool for mining multi-sample ChIP-seq data R. Esse and A. Grishok
Page
7 of 16
bioRxiv preprint first posted online Nov. 16, 2017; doi: http://dx.doi.org/10.1101/220079. The copyright holder for this preprint (which was not peer-reviewed) is the author/funder. It is made available under a CC-BY-NC-ND 4.0 International license.
161
and Additional file 7), whereas H3K36me3 peaks lie predominantly at gene bodies (Fig. 7c and Additional
162
file 8).
163
• Comparative heatmaps and metaplots
164
The user can supply multiple coverage files in bedGraph format and generate heatmaps and metaplots
165
to visualize coverage in a specific region set in a comparative manner. This module of ChIPdig relies on a
166
custom algorithm which builds a coverage matrix based on bin size and reference coordinates (start, end
167
or both) selected by the user. Such matrix is then plotted in the form of a comparative metaplot and a
168
set of heatmaps. H3K4me3 and H3K36me3 coverage files were loaded onto ChIPdig, along with a BED
169
file with
170
in 25 bp bins and gene bodies were either expanded or compressed to 500 bp. Windows of 250 bp
171
upstream and downstream of each region were selected (Fig. 8a). Typical of H3K4me3, coverage is
172
higher in the vicinity of the transcription start site, whereas H3K36me3 is enriched at transcription unit
173
bodies.
174
C. elegans transcription units in the WS220/ce10 reference assembly. Coverage was computed
Conclusions
175
ChIPdig is a user-friendly application for handling multiple ChIP-seq data sets and has diverse useful
176
capabilities spanning a comprehensive analysis pipeline, namely: read alignment to a reference genome,
177
ChIP-seq
178
regions,
179
coverage.
data
and
normalization,
generation
of
peak
calling,
comparative
differential
heatmaps
enrichment
and
metaplots
analysis,
for
annotation
visualization
of
of
genomic
normalized
180
181
182
ChIPdig: a comprehensive user-friendly tool for mining multi-sample ChIP-seq data R. Esse and A. Grishok
Page
8 of 16
bioRxiv preprint first posted online Nov. 16, 2017; doi: http://dx.doi.org/10.1101/220079. The copyright holder for this preprint (which was not peer-reviewed) is the author/funder. It is made available under a CC-BY-NC-ND 4.0 International license.
183
184
185
Availability and requirements
186
•
Project name: ChIPdig
187
•
Project home page: https://github.com/rmesse/ChIPdig
188
•
Operating system(s): Platform-independent
189
•
Programming language: R, Shiny
190
•
Other requirements: None
191
•
License: GNU General Public License version 3.0 (GPL-3.0)
192
•
Any restrictions to use by non-academics: No
193
Abbreviations
194
bp: base pairs; ChIP-seq: chromatin immunoprecipitation followed by next-generation sequencing; cpm:
195
counts
196
interface; H3K36me3: histone H3 trimethylated at lysine 36; H3K4me3: histone H3 trimethylated at
197
lysine 4; NCBI: National Center for Biotechnology Information; NGS: next-generation sequencing; PCR:
198
polymerase
199
transcription start site; UCSC: University of California Santa Cruz
200
201
202
per
million;
chain
FDR:
false
reaction;
discovery
PP:
rate;
posterior
GEO:
Gene
probability;
Expression
TMM:
Omnibus;
trimmed
means
GUI:
of
graphical
M
values;
user
TSS:
Acknowledgements Not applicable.
Funding ChIPdig: a comprehensive user-friendly tool for mining multi-sample ChIP-seq data R. Esse and A. Grishok
Page
9 of 16
bioRxiv preprint first posted online Nov. 16, 2017; doi: http://dx.doi.org/10.1101/220079. The copyright holder for this preprint (which was not peer-reviewed) is the author/funder. It is made available under a CC-BY-NC-ND 4.0 International license.
203
204
205
206
This research was supported by the GM107056 R01 grant awarded to AG.
Availability of data and materials All source code has been made publicly at https://github.com/rmesse/ChIPdig.
Authors’ contributions
207
RE conceived the study and wrote the code. RE and AG wrote the paper. All authors read and approved
208
the final manuscript.
209
210
211
212
213
214
215
Competing interests The authors declare that they have no competing interests.
Consent for publication Not applicable.
Ethics approval and consent to participate This study does not involve humans, human data or animals.
References
216
1. Davis CA, Hitz BC, Sloan CA, Chan ET, Davidson JM, Gabdank I, et al. The Encyclopedia of DNA
217
elements
218
http://academic.oup.com/nar/article/doi/10.1093/nar/gkx1081/4595865
219
2.
Li
H,
(ENCODE):
Durbin
R.
data
Fast
portal
and
update.
accurate
Nucleic
short
read
Acids
Res.
alignment
[Internet].
with
2017;
Available
Burrows-Wheeler
transform.
ChIPdig: a comprehensive user-friendly tool for mining multi-sample ChIP-seq data R. Esse and A. Grishok
from:
Page
10 of 16
bioRxiv preprint first posted online Nov. 16, 2017; doi: http://dx.doi.org/10.1101/220079. The copyright holder for this preprint (which was not peer-reviewed) is the author/funder. It is made available under a CC-BY-NC-ND 4.0 International license.
220
Bioinformatics. 2009;25:1754–60.
221
3. Langmead B. Aligning short sequencing reads with Bowtie. Curr. Protoc. Bioinforma. 2010;
222
4. Langmead B, Salzberg SL. Fast gapped-read alignment with Bowtie 2. Nat. Methods. 2012;9:357–9.
223
5. Zhang Y, Liu T, Meyer CA, Eeckhoute J, Johnson DS, Bernstein BE, et al. Model-based analysis of ChIP-
224
Seq (MACS). Genome Biol. 2008;9.
225
6. Feng J, Liu T, Qin B, Zhang Y, Liu XS. Identifying ChIP-seq enrichment using MACS. Nat. Protoc.
226
2012;7:1728–40.
227
7. Zang C, Schones DE, Zeng C, Cui K, Zhao K, Peng W. A clustering approach for identification of
228
enriched domains from histone modification ChIP-Seq data. Bioinformatics. 2009;25:1952–8.
229
8. Li H, Handsaker B, Wysoker A, Fennell T, Ruan J, Homer N, et al. The Sequence Alignment/Map format
230
and SAMtools. Bioinformatics. 2009;25:2078–9.
231
9.
232
chromatin biology. Nat. Rev. Genet. 2014. p. 709–21.
233
10. Liang K, Keles S. Detecting differential binding of transcription factors with ChIP-seq. Bioinformatics
234
[Internet].
235
http://www.ncbi.nlm.nih.gov/pubmed/22057161%5Cnhttp://www.pubmedcentral.nih.gov/articlerende
236
r.fcgi?artid=PMC3244766
237
11.
238
comparison
239
http://genomebiology.biomedcentral.com/articles/10.1186/gb-2012-13-3-r16
240
12. Lun ATL, Smyth GK. Csaw: A Bioconductor package for differential binding analysis of ChIP-seq data
241
using sliding windows. Nucleic Acids Res. 2015;44:1–10.
242
13. Robinson MD, McCarthy DJ, Smyth GK. edgeR: a Bioconductor package for differential expression
243
analysis
Meyer
Shao
CA,
Liu
XS.
Identifying
and
mitigating
bias
in
2012;28:121–2.
Z,
of
Zhang
of
Y,
Yuan
ChIP-Seq
digital
gene
G-C,
Orkin
data
sets.
expression
SH,
data.
sequencing
methods
Available
Waxman
Genome
next-generation
DJ.
Biol.
Bioinformatics
MAnorm:
[Internet].
[Internet].
a
robust
from:
model
2012;13:R16.
2010;26:139–40.
for
quantitative
Available
Available
ChIPdig: a comprehensive user-friendly tool for mining multi-sample ChIP-seq data R. Esse and A. Grishok
for
Page
from:
from:
11 of 16
bioRxiv preprint first posted online Nov. 16, 2017; doi: http://dx.doi.org/10.1101/220079. The copyright holder for this preprint (which was not peer-reviewed) is the author/funder. It is made available under a CC-BY-NC-ND 4.0 International license.
244
http://www.ncbi.nlm.nih.gov/pubmed/19910308%255Cnhttp://www.pubmedcentral.nih.gov/articleren
245
der.fcgi?artid=PMC2796818
246
14. Anders S, Huber W. Differential expression of RNA-Seq data at the gene level – the DESeq package.
247
EMBL,
248
http://gga01.med.wayne.edu/online_help/help_regionminer/DESeq.pdf
249
15. Bonhoure N, Bounova G, Bernasconi D, Praz V, Lammers F, Canella D, et al. An introduction to the
250
Biostrings
251
http://www.bioconductor.org/packages/release/bioc/vignettes/csaw/inst/doc/csawUserGuide.pdf%5Cn
252
http://journals.plos.org/plosone/article?id=10.1371/journal.pone.0011471%5Cnhttp://www.ncbi.nlm.ni
253
h.gov/pubmed/18594521$%5C$nhttp://www.pubmedcentral.nih.gov/ar
254
16. Gaidatzis D, Lerch A, Hahne F, Stadler MB. QuasR: Quantification and annotation of short reads in R.
255
Bioinformatics. 2015;31:1130–2.
256
17. Cairns J, Spyrou C, Stark R, Smith ML, Lynch AG, Tavar?? S. BayesPeak-an R package for analysing
257
ChIP-seq data. Bioinformatics. 2011;27:713–4.
258
18.
259
comparison and visualization. Bioinformatics. 2015;31:2382–3.
260
19.
261
https://github.com/jokergoo/EnrichedHeatmap. 2017.
262
20. Lawrence M, Huber W, Pagès H, Aboyoun P, Carlson M, Gentleman R, et al. Software for Computing
263
and Annotating Genomic Ranges. PLoS Comput. Biol. 2013;9.
264
21. A. Riemondy K, M. Sheridan R, Gillen A, Yu Y, G. Bennett C, R. Hesselberth J. valr: Reproducible
265
genome
266
https://f1000research.com/articles/6-1025/v1
267
22. Liu T, Rechtsteiner A, Egelhofer TA, Vielle A, Latorre I, Cheung MS, et
Yu
Heidelberg,
G,
Gu
/
BSgenome
Wang
Z.
Ger.
LG,
He
QY.
framework.
ChIP
EnrichedHeatmap:
interval
analysis
[Internet].
in
seeker:
Nature
An
Making
R.
2012;
[Internet].
R/Bioconductor
Enriched
F1000Research
Available
2014;11:1–13.
package
Heatmaps.
[Internet].
R
for
ChIP
package
2017;6:1025.
from:
Available
peak
annotation,
version
Available
1.6.0.
from:
al. Broad chromosomal
ChIPdig: a comprehensive user-friendly tool for mining multi-sample ChIP-seq data R. Esse and A. Grishok
from:
Page
12 of 16
bioRxiv preprint first posted online Nov. 16, 2017; doi: http://dx.doi.org/10.1101/220079. The copyright holder for this preprint (which was not peer-reviewed) is the author/funder. It is made available under a CC-BY-NC-ND 4.0 International license.
268
domains of histone modification patterns in C. elegans. Genome Res. 2011;21:227–36.
269
23. Robinson MD, Oshlack A. A scaling normalization method for differential expression analysis of RNA-
270
seq data. Genome Biol. 2010;11.
271
Figure legends
272
Fig. 1
273
ChIPdig user interface displayed upon launch.
274
the analysis module and a clickable box for selection of the folder containing the input files. Additional
275
features
276
generated throughout the analysis and additional instructions are placed in the main panel under a tab
277
corresponding to the analysis module selected by the user.
278
Fig. 2
279
Alignment module. The user supplies a text file listing the input files corresponding to unmapped reads
280
in either uncompressed (e.g.: '.fq', '.fastq') or compressed (e.g.: '.gz', '.bz2', '.xz') format. Both single-end
281
and paired-end data are supported. A scroll-down menu displays the reference genome assemblies
282
available for alignment.
283
Fig. 3
284
Initial processing of mapped reads. The user supplies a tab-delimited text file listing the input DNA and
285
ChIP sample mapped read files
286
be performed
287
chromosome size list, and a multidimensional scaling plot representing the similarity of samples in the
288
data set
289
Fig. 4
are
sequentially
(b).
unlocked
(a).
as
the
The left pane displays four radio buttons for selection of
user
progresses
through
the
software
suite.
Outputs
If desired, duplicate read removal and fragment size extension can
The application outputs a table with library sizes and median fragment sizes,
a
(c).
ChIPdig: a comprehensive user-friendly tool for mining multi-sample ChIP-seq data R. Esse and A. Grishok
Page
13 of 16
bioRxiv preprint first posted online Nov. 16, 2017; doi: http://dx.doi.org/10.1101/220079. The copyright holder for this preprint (which was not peer-reviewed) is the author/funder. It is made available under a CC-BY-NC-ND 4.0 International license.
290
Downstream processing of mapped reads. The user may generate coverage files in bedGraph format,
291
perform peak calling for each sample, and assess differential enrichment for a set of genomic regions of
292
interest.
293
Fig. 5
294
H3K4me3
295
sample
296
exported from ChIPdig and loaded onto the UCSC Genome Browser. These profiles exemplify the well-
297
known scenario whereby H3K4me3 accumulates around the transcription start site (TSS) and H3K36me3
298
is enriched at the gene body.
299
Fig. 6
300
Differential
301
H3K36me3 using either H3K4me3 peak genomic coordinates
302
false discovery rate (FDR) threshold of 0.1. For each analysis, a mean-different plot representing the
303
library
304
transformed coverage (the mean), as well as a box-and-whisker plot showing the global change in
305
normalized coverage between the two conditions, were originated.
306
Fig. 7
307
Annotation
308
assembly, as well as distances upstream and downstream of transcription start site, are chosen
309
Replicated H3K4me3 peaks are mostly promoter-proximal
310
predominantly at gene bodies
311
Fig. 8
312
Generation of heatmaps and comparative metaplot for visualizing coverage. Coverage files for H3K4me3
313
and H3K36me3 were supplied to ChIPdig, as well as a file with coordinates of
and
H3K36me3
subtracted
by
of
coverage.
log2-transformed
enrichment
size-adjusted
ChIP-seq
analysis
results.
log2-transformed
genomic
regions.
The
cpm
Values
for
the
H3K4me3
fold
region
in
input
(the
BED
log2-transformed
sample.
ChIP-seq
change
file
represent
Files
coverage
cpm
in bedGraph
was
compared
for
the
format
with
were
that
of
(a) or those of H3K36me3 peaks (b) with a
difference)
format
(b),
is
against
uploaded
and
the
average
reference
log2-
genome
(a).
whereas H3K36me3 peaks are found
(c).
C. elegans
transcription
ChIPdig: a comprehensive user-friendly tool for mining multi-sample ChIP-seq data R. Esse and A. Grishok
ChIP
Page
14 of 16
bioRxiv preprint first posted online Nov. 16, 2017; doi: http://dx.doi.org/10.1101/220079. The copyright holder for this preprint (which was not peer-reviewed) is the author/funder. It is made available under a CC-BY-NC-ND 4.0 International license.
314
units. The heatmaps and metaplot were generated by considering a 25-bp bin size, and gene bodies
315
were resized to 500 bp. Windows of 250 bp upstream and downstream of each region were selected
316
As observed in both the heatmaps
317
overall
318
transcription unit bodies.
319
higher
in
the
vicinity
of
(b)
and the comparative metaplot
transcription
start
sites,
while
that
(c), of
(a).
coverage for H3K4me3 is
H3K36me3
is
enriched
at
Additional file description
320
Additional file 1
321
File name and extension: Additional_file_1_alignment_report.pdf
322
Title of data: Read alignment report
323
Description of data: Report generated by the read alignment module of ChIPdig
324
Additional file 2
325
File name and extension: Additional_file_2_available_colors.txt
326
Title of data: Available colors
327
Description of data: List of R built-in colors available for the user to choose from
328
Additional file 3
329
File name and extension: Additional_file_3_H3K4me3_replicated_peaks.bed
330
Title of data: H3K4me3 replicated peaks
331
Description of data: Peaks found in both H3K4me3 ChIP-seq experimental replicates
332
Additional file 4
333
File name and extension: Additional_file_4_H3K36me3_replicated_peaks.bed
334
Title of data: H3K4me4 replicated peaks
335
Description of data: Peaks found in both H3K36me3 ChIP-seq experimental replicates
336
Additional file 5
ChIPdig: a comprehensive user-friendly tool for mining multi-sample ChIP-seq data R. Esse and A. Grishok
Page
15 of 16
bioRxiv preprint first posted online Nov. 16, 2017; doi: http://dx.doi.org/10.1101/220079. The copyright holder for this preprint (which was not peer-reviewed) is the author/funder. It is made available under a CC-BY-NC-ND 4.0 International license.
337
File name and extension: Additional_file_5_H3K4me3_vs_H3K36me3_at_H3K4me3_peaks.csv
338
Title of data: Differential enrichment analysis of H3K4me3 versus H3K36me3 at H3K4me3 peaks
339
Description of data: Table summarizing the results of the differential enrichment analysis comparing
340
H3K4me3 coverage with H3K36me3 coverage at replicated H3K4me3 peaks
341
Additional file 6
342
File name and extension: Additional_file_5_H3K4me3_vs_H3K36me3_at_H3K36me3_peaks.csv
343
Title of data: Differential enrichment analysis of H3K4me3 versus H3K36me3 at H3K36me3 peaks
344
Description of data: Table summarizing the results of the differential enrichment analysis comparing
345
H3K4me3 coverage with H3K36me3 coverage at replicated H3K36me3 peaks
346
Additional file 7
347
File name and extension: Additional_file_7_H3K4me3_replicated_peaks_annotation_table.csv
348
Title of data: Annotation of H3K4me3 peaks
349
Description of data: Annotation table for H3K4me3 replicated peaks considering 1500 bp upstream and
350
500 bp downstream of transcription start site for promoter assignment and using
351
assembly ce10
352
Additional file 8
353
File name and extension: Additional_file_7_H3K36me3_replicated_peaks_annotation_table.csv
354
Title of data: Annotation of H3K36me3 peaks
355
Description of data: Annotation table for H3K36me3 replicated peaks considering 1500 bp upstream and
356
500 bp downstream of transcription start site for promoter assignment and using
357
assembly ce10
C. elegans reference
C. elegans reference
ChIPdig: a comprehensive user-friendly tool for mining multi-sample ChIP-seq data R. Esse and A. Grishok
Page
16 of 16
bioRxiv preprint first posted online Nov. 16, 2017; doi: http://dx.doi.org/10.1101/220079. The copyright holder for this preprint (which was not peer-reviewed) is the author/funder. It is made available under a CC-BY-NC-ND 4.0 International license.
bioRxiv preprint first posted online Nov. 16, 2017; doi: http://dx.doi.org/10.1101/220079. The copyright holder for this preprint (which was not peer-reviewed) is the author/funder. It is made available under a CC-BY-NC-ND 4.0 International license.
bioRxiv preprint first posted online Nov. 16, 2017; doi: http://dx.doi.org/10.1101/220079. The copyright holder for this preprint (which was not peer-reviewed) is the author/funder. It is made available under a CC-BY-NC-ND 4.0 International license.