Proceedings of the 9th International Conference on Structural Dynamics, EURODYN 2014 Porto, Portugal, 30 June - 2 July 2014 A. Cunha, E. Caetano, P. Ribeiro, G. Müller (eds.) ISSN: 2311-9020; ISBN: 978-972-752-165-4
A compressive sensing based approach for estimating stochastic process power spectra subject to missing data Liam Comerford1, Ioannis A. Kougioumtzoglou, Michael Beer1 Institute for Risk and Uncertainty, University of Liverpool, Liverpool, L69 3GH, UK, email:
[email protected],
[email protected],
[email protected] 1
ABSTRACT: A compressive sensing (CS) based approach for power spectrum estimation of stationary stochastic processes subject to missing data is developed. In general, stochastic process records such as wind and wave excitations can often be represented with relative sparsity in the frequency domain. Relying on this attribute, a CS framework can be applied to reconstruct a signal that contains sampling gaps, possibly occurring for reasons such as sensor failures, data corruption, limited bandwidth/storage capacity, and power outages. Specifically, first a Fourier basis is selected for the recorded signal expansion. Next, an L1-norm minimization procedure is performed for obtaining the sparsest Fourier based representation of the signal. Finally, power spectrum estimates are derived from the determined expansion coefficients directly circumventing reconstruction of the signal in the time domain. The technique is shown to estimate successfully the essential features such as the dominant spectral peaks of the recorded processes’ power spectra. Further, it appears to be efficient even in cases with 75% missing data demonstrating superior performance in comparison with alternative existing techniques. A significant advantage of the approach relates to the fact that it performs satisfactorily even in the presence of noise. Several numerical examples demonstrate the versatility and reliability of the approach. KEY WORDS: Compressive sensing; Stochastic processes; Missing data; Power spectrum estimation 1
INTRODUCTION
Acquired data corresponding to environmental processes, for instance, is often pivotal for defining and calibrating probabilistic engineering load models to be used in subsequent analyses of critical engineering systems. In this regard, due to the underlying harmonic nature of many environmental processes, power spectrum estimation can be an invaluable tool and an important building block in engineering systems analyses, especially within a Monte Carlo framework, e.g.[1]. Nevertheless, in the presence of missing data, there are certain limitations to standard spectral analysis techniques, such as those based on Fourier transform. Missing data in this context refers to a time-history record of a process, which for some reason has been sampled irregularly or lost some of its original content. There are numerous situations in which missing data may be unavoidable. For instance, these include sensor failures, data loss or corruption as well as limited allocated time with shared equipment. In these situations it may be unfeasibly expensive or logistically impossible to re-record the process in full, and therefore alternative analysis techniques are required to best analyze and process the available data. It is important to note that there exist many algorithms and procedures in the literature that provide alternatives to standard Fourier analysis for spectral estimation in the presence of missing data. However, these alternatives come with certain drawbacks and often impose assumptions on the statistics of the original process. For instance, autoregressive methods can be used to fit a model to the data, most often under the assumption that the source time-history is relatively long and that the missing data are grouped and infrequent [2, 3]. Least-squares sinusoid fitting and zero-padded gaps [4-6]
offer efficient solutions for re-constructing the Fourier spectrum in the presence of missing data but suffer from falsely detected peaks, spectral leakage and significant loss of power as the number of missing data increases. Recently, an artificial neural network based approach was developed by the authors for power spectrum estimation and simulation of stochastic processes subject to missing data [7]. A significant advantage of the approach relates to the fact that no prior knowledge of statistics of the underlying process is required. Further, many environmental processes such as earthquakes, sea waves, and tidal patterns may inhabit a relatively small area of dominant frequencies in the frequency domain. This feature leads to the consideration of compressive sensing (CS) [8, 9] as a possible route for signal reconstruction and spectral estimation of stationary stochastic processes. In this paper, the recently developed CS framework is applied to address the problem of estimating stationary process power spectra in cases where the available realizations exhibit missing data. In conjunction with an appropriate harmonic basis, power spectra are reconstructed in the presence of large (up to 75%) amounts of missing data. 2
STATIONARY STOCHASTIC PROCESS REPRESENTATION AND SPECTRAL ESTIMATION
In this section, a concise review on stationary stochastic process representation is presented. Further, power spectrum estimation of stationary stochastic processes based on Fourier transform is delineated, providing a basis upon which CS can be applied. For any real-valued stationary process, , there exists a corresponding complex orthogonal process such that can be written in the form, (e.g.[10‐12])
2995
Proceedings of the 9th International Conference on Structural Dynamics, EURODYN 2014
, where
has the properties |
Ε |
(1)
4
,
(2)
and
Ε
0.
(3)
In Eq.2, is the two-sided power spectrum of the process . Further, a versatile formula for generating realizations compatible with the stationary stochastic process model of Eq.1 is given by [1]
4
Δ sin ω
Φ ,
(4)
where Φ are uniformly distributed random phase angles in 2 . Furthermore, regarding estimation of the range 0 Φ the power spectrum of the process of Eq1 based on available realizations, this is given by the ensemble average of the square of the absolute Fourier transform of the realizations. In this context, standard established Fast Fourier Transform algorithms can be utilized (e.g. [13]). In the ensuing analysis and, specifically, in the numerical examples section, stationary process realizations compatible with a given power spectrum are generated by utilizing Eq.4. Further, power spectrum estimates for stationary processes are determined by calculating the ensemble average of the square of the absolute Fourier transform of the realizations. 3
COMPRESSIVE SENSING
The Shannon-Nyquist theorem states that a time-dependent signal with maximum frequency can be completely determined when sampled at time intervals of 1⁄2 or smaller. This maximum sampling frequency is commonly known as the Shannon-Nyquist rate. Compressive sensing is a recently developed signal processing technique which allows for signal reconstruction even if the maximum frequency present in the signal is greater than the half the signal’s sampling rate [14]. Note that the idea shares many features with existing “lossy” compression algorithms (e.g. JPEG image compression) that take advantage of a signal’s relative sparsity in some basis or frame. When data is captured, it is often convenient to expand it into a new basis. In the case of “lossy” compression techniques, bases (e.g. redundant dictionaries) are chosen so that the vast majority of coefficients of the transformed signal will be close or equal to zero. If these coefficients are simply removed, the amount of space required to store the signal is reduced significantly (possibly by several orders of magnitude). Next, when the signal is finally reconstructed back into its original form, for instance in the case of digital images, music or videos, it is often indiscernible from the true signal. Compressive sensing explores the possibility of recording data directly in its compressed state, allowing not only the space-saving advantages of compressed data but also saving on recording time, complexity and compression processing [14].
2996
For robust compressive sensing there are several important properties to be considered, one restriction is that of sparsity. The signal being sampled must be sparse in some known basis, i.e. it must be possible to represent the full signal with far fewer coefficients than the number determined by the Shannon-Nyquist rate. Further, the sampling domain and the relatively sparse transformation domain must have high incoherence. This implies that a sparse signal in the transform must have a non-sparse representation in the sampling domain (i.e. a single Fourier coefficient in the transform domain would form a harmonic signal spanning the entire sample length). CS also relies on the choice of an appropriate sensing matrix. These are commonly random matrices which satisfy the restricted isometry property, e.g. [15], in which subsets of the matrix columns are nearly orthogonal with high probability. Unfortunately in the case of missing data, it is likely unfeasible to choose a sensing matrix as the arrangement of the missing data may not be under control. Despite this condition, reconstruction based on the assumption of sparsity still gives advantages over more common leastsquares/zero-padding approaches and is ideal for identifying sharp spectral peaks despite massive data loss, in some cases >90%. Further, given a sample record y, of length N0-Nm, where N0 is the original sample length and Nm is the number of missing data, assuming the locations of the missing data are known, a corresponding (N0-Nm by N0) sampling matrix, A can be drawn, (5) where x is the measurement vector assumed to be sparse. Eq.5 represents an underdetermined system with infinite solutions. This problem may be solved easily under the constraint that x must be minimized in the least squares sense, (6) Considering a Fourier basis, this solution is virtually identical to replacing the missing data with zeros and applying the Fourier transform in the usual way. However, in the majority of cases this does not lead to a sparse solution. The sparsest solution of Eq.5 occurs when the L0-norm is minimized, sometimes called the pseudo norm [16] and defined as: 1, 0 0 | | (7) 0, 0 This optimization problem is non-convex with no known exact solution. However, a viable alternative exists in minimizing the L1-norm instead. L1-norm minimization promotes sparsity and will often yield the same result as L0norm minimization in many cases [16]. Further, the problem becomes convex and may be set in a convenient linear programming form, min| | (8) Eq.8 describes a basis pursuit optimization problem and is easily solved via a gradient-based optimization method, e.g. [15]. Figure 1 shows how L1-minimization gives sparse solutions by comparing both L1 and L2 norm minimization for the simple 2-dimensional problem, 2 1, (for which there are infinite solutions). Note, as the L2-ball is stretched (Figure 1, left), unless the equation for y is parallel to one of
Proceedings of the 9th International Conference on Structural Dynamics, EURODYN 2014
the axes, the solution will incorporate components of both a and b. However, unless the equation for y is parallel to the edge of the L1-ball (Figure 1, right), as it is stretched, the minimum solution will lie on one of the two axes.
4
NUMERICAL EXAMPLES
The effectiveness of the approach is demonstrated on simulated sea-wave data compatible with the JONSWAP spectrum (Eq.9) [18]. This spectrum typically has a very sharp, strong peak and may be relatively sparse in the frequency domain. Stationary processes of length N0=256 are generated directly from Eq.9, utilizing Eq.4. (9)
;
Figure 1. Minimum L2 and L1 solutions to the equation, 2 1 For the cases where either the signal is not sparse enough or the missing data is too extensive for L1-minimization to exactly reconstruct the original signal, it is important to note that there may still be significant advantages over a minimum L2 solution. In spectral estimation, minimizing the L2-norm (or zero-padding) is likely to spread the solution over many frequencies; that is, because individually, large coefficients are penalized. Minimizing the L1-norm however is far more likely to yield larger individual coefficients, having the effect of producing sharp, well defined peaks at the key freqencies. 3.1
Basis matrix construction
For stationary stochastic processes, consistent with Eq.1, the power spectrum is estimated based on the mean square value of the Fourier transform over an ensemble of time-histories [17]. As such, a partial Fourier basis is required. This is easily formed first by generating a full, square (N0 by N0) Fourier basis via the Inverse Fast Fourier Transform (IFFT). Nm Rows are then removed from the matrix corresponding to the positions of the missing data. This is then equivalent to a CS sensing matrix for a stationary harmonic process. Figure 2 demonstrates the procedure.
0.07, 0.09, For comparison, the procedure is demonstrated on simulated data compatible with a Kanai-Tajimi earthquake spectrum [19, 20]. This spectrum is arranged with wider peak and longer tail and as a result is less suitable for CS reconstruction. Again, stationary processes of length N0=256 are generated directly from the spectrum utilizing Eq.4, where
0.03,
S
0.5,
3.3, and
1
,
2
(10)
where the natural frequency, =12rad/s, damping ratio =0.4 and =20. Gaussian white noise is added to the process realizations of magnitude 1/5th the standard deviation of the record in both cases. Three examples are shown, two for the JONSWAP spectrum and one for the Kanai-Tajimi spectrum. For each example, ten process realizations are generated and data is removed. The spectrum is then estimated via scaled zero padding and L1-minimization in the Fourier basis. Scaled zero padding is a common spectral reconstruction technique when dealing with missing data. The result is the same as that of a least squares solution but the resulting spectrum is scaled up relative to the amount of missing data in the signal. Even with this additional scaling, estimates often fall short of the original target spectrum. For the JONSWAP examples, two different arrangements of missing data are applied. The first case simulates missing data at random locations drawn from a uniform distribution of the time index, , (11) 0, where is the sample time history with missing data, is a vector of is the original sample generated from Eq.9, equally spaced numbers from 0 to 1 arranged in random order and is the fraction of missing data. The second case simulates missing data that occur in groups, positioned at random locations again drawn from a uniform distribution of the time index,
, 0,
1 0
(12)
where
Figure 2. Fourier sensing matrix construction with missing data
comes from the following, , 1⁄ (13) 1⁄ 0, and is the number of intervals, is a vector of ones of ⁄ and length 0 is a vector of equally spaced numbers from 0 to 1 arranged in random order.
2997
Procceedings of the 9tth International Conference C on Struuctural Dynamicss, EURODYN 20 014
Thee Kanai-Tajim mi spectral reeconstruction assumes miissing dataa of the form Eq.11 E only. 4.1
L1-spectraal reconstructtion examples
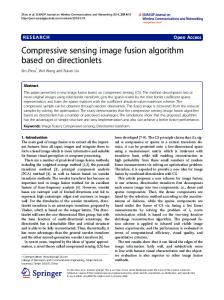
Thee first exampple is of a JONSWAP J p process with 75% misssing data at random r locations. Figure 3 shows thaat L1minnimization in a Fourier baasis has correectly identified the keyy peak frequenncy of the proocess and onlyy lost roughlyy 25% of its i original poower. Furtherr, comparing with Figure 4 it is cleaar that the CS S approach iss far superiorr to a scaled least squares which haas a very low spectral peakk and a long tail t of o frequencies. noisse across all other ure 5. JONSW WAP power sppectrum recon nstruction from m10 Figu sttationary proccess records viia L1-minimizzation for 50% % missing dataa over random mly located fix xed intervals
Figgure 3. JONSW WAP power spectrum s reconnstruction from 10 stationary proocess records via v L1-minimization for 75% missinng data at unifo form random locations Figu ure 6. JONSW WAP power sppectrum reconstruction from m 10 staationary process records viaa scaled zero-p padding for 500% missing dataa over random mly located fix xed intervals
Figgure 4. JONSW WAP power sppectrum reconnstruction from m 10 stationary proceess records via scaled zero--padding for 75% 7 missinng data at unifo form random locations
Th he final exampple shows thee limitations of o CS for speectral recon nstruction whhen the signal is not as spaarse in the Fouurier dom main. The Kannai-Tajimi proocess with 75% % missing daata at random locations could not be reliably reco onstructed via CS. Insteead the numbeer of missing data had to bee reduced to 50%, 5 by which w point a least-squarres solution became a viiable optio on. The differrences betweeen Figures 7 and a 8 are far less signiificant than in i previous eexamples. In n this case eiither recon nstruction meethod could bee considered.
T second exxample uses thhe same specctrum but thiss time The ⁄16. The withh 50% missinng data at inntervals of lenngth arraangement of missing data is less simillar to an ideaal CS sam mpling matrix (e.g. Gaussiaan random); thherefore moree data is needed n for reliiable results. Under these conditions, thhe CS recoonstructed speectrum still ouut-performs sccaled zero-paddding signnificantly, witth Figure 5 showing s a much m more deefined specctral peak thann Figure 6. Fig gure 7. Kanai-T Tajimi power spectrum reconstruction frrom 10 stationary proocess records via L1-minim mization for 500% missingg data at unifoorm random lo ocations
2998
Prroceedings of the 9th Internationall Conference on S Structural Dynam mics, EURODYN 2014
Figgure 8. Kanai-Tajimi poweer spectrum recconstruction from f 10 stationary proocess records via v scaled zeroo-padding forr 50% missinng data at unifo form random locations 5
CONCLUS SION
A CS based appproach to missing m data is shown to t be extrremely effecttive under ceertain circumsstances. As with mosst spectral esstimation proccedures that deal with miissing dataa, some knoown a priori statistics off the processs are prefferred. T paper shows that if the data is expectted to be sparrse, or This near sparse in thee frequency-tiime domain, L1-minimizati L ion in a haarmonic basis presents a usseful tool in sppectrum estim mation withh missing dataa. Of particuular note is larrge extent to which w the reconstruction method is effective e for sharp s spectra even afteer losing 75% of the originaal signal. REF FENCES [1] Shinozuka, M., M and Deoddatis, G., 19991, "Simulatioon of Stochastic Processes by b Spectral Representattion," Applied Mecchanics Revieews, 44(4) pp. 191-204. [2] Broersen, P.. M. T., 20066, "Automatic Spectral Anaalysis with Missingg Data," Digital Signal Proocessing, 16(66) pp. 754-766. [3] Broersen, P., and Bos, R.,, 2006, "Timee-Series Analyysis if Data are Randomly R Missing," Ieee Transactionns on Instrumentattion and Meassurement, 55(11) pp. 79-84. [4] Lomb, N., 1976, 1 "Least-Squares Freqquency-Analyssis of Unequally Spaced Datta," Astrophyysics and Space S Science, 39(22) pp. 447-462. [5] Scargle, J., 1982, "Studiees in Astronoomical Time-S Series Analysis .2. Statistical Aspects A of Sppectral-Analyssis of Unevenly Sppaced Data," Astrophysicaal Journal, 263(2) pp. 835-853.. [6] Vanicek, P.,, 1969, "Appproximate Speectral Analysis by Least-Squarees Fit - Suuccessive Sppectral Analyysis," Astrophysicss and Space Science, 4(4) pp. p 387-&. [7] Comerford, L. L A., Kougiooumtzoglou, I. A., and Beerr, M., 2013, "An artificial a neurral network based b approacch for power spectrum estimatioon and simulaation of stochhastic processes suubject to missing data," Proceedings P o the of 2013 IEEE E Symposium m Series on o Computattional Intelligence (IEEE SSCI 2013), 2 Singapoore, Anonymoous . [8] Donoho, D.. L., 2006, "Compressedd Sensing," IEEE Transactionss on Informaation Theory,, 52(4) pp. 12891 1306.
[9] Candes, E. J.., Romberg, JJ., and Tao, T., T 2006, "Roobust Uncertainty Principles: P Exaact Signal Reconstruction from f Highly Incoomplete Freqquency Info ormation," IE EEE Transactions on Informatioon Theory, 52((2) pp. 489-5009. [10] Yaglom, A.M., and Siilverman, R.A., 2004, "An Introduction to the Theeory of Staationary Ranndom Functions," Dover D Publicattions, . [11] Cramér, H., and Leadbettter, R., 1967, "Stationary and related stochaastic processees: sample fu unction propeerties and their appllications," Wiley, . [12] Priestley, B., 1982, "Specctral analysis and time serries," Academic Preess, . [13] Welch, P. D., 1967, "The use of Fast Fourier F Transfform for the Estimaation of Poweer Spectra: A Method Based on Time Averagging Over Shhort, Modified d Periodogram ms," Audio and Ellectroacoustics, IEEE Transsactions on, 15(2) 1 pp. 70-73. [14] Davenport, M.A., M Duartee, M.F., Eld dar, Y.C., 2012, 2 and "Compressed Sensiing: Theory T Applications,"Cambridge U University Preess, . [15] Stanković S., S Orovic, I., and Sejjdi\'c E., 2012, 2 "Multimedia Signals and Systems," Springer, . [16] Patel, V.M., and Cheellappa, R., 2013, "Spparse Representatioons and Com mpressive Sensing for Imaaging and Vision," Springer, S . [17] Newland, D.E., 1993, ""An introducction to ranndom vibrations, sppectral and wavelet anallysis," Longm mans Scientific & Technical, T Harrlow, . [18] Hasselmann, K., 1973, "M Measurementts of wind-w wavegrowth and sw well decay duuring the joint North Sea wave w ches project: (JO ONSWAP)," Deutsches Hydrographis H Institut, . [19] Kanai, K., 1957, "Semii-Empirical Formula F for the Seismic Chaaracteristics oof the Groun nd. Universityy of Tokyo. Bullettin of Earthquuake Research h Institute." . [20] Tajimi, H., 1960, "A Statiistical Method d for Determining the Maximum m Response off a Building Structure durinng an Earthquake. inn: Proceedinggs of the 2nd World W Conference on Earthquake Engineeringg. " .
2999