access, they can easily install software and configure the environment according to their needs. To connect to ... templates for frequently used operating systems pre-installed with the required software for computer .... 12https://wordpress.org/.
A Computational Infrastructure Model for Research on Computer Vision Antonio C. Nazare Jr., Marco Tulio Rodrigues, Victor H. C. Melo, Artur J. L. Correia, Gabriel R. Gonc¸alves, Keiller Nogueira, Carlos A. Caetano, Edemir Ferreira Jr., Jefersson A. dos Santos, William Robson Schwartz Department of Computer Science – Universidade Federal de Minas Gerais (UFMG) Av. Antˆonio Carlos, 6627 – 31270-010 – Belo Horizonte – MG – Brazil {antonio.nazare, tulio.rodrigues, victorhcmelo, arturjordao, gabrielrg, keillernogueira, carlos.caetano, edemirm, jefersson, william}@dcc.ufmg.br
Abstract. With the advances on science, a powerful computational infrastructure is desirable to increase the performance of experiments. The same holds true for research on the Computer Vision field, which deals with large amounts of data and also requires intensive computation. Nevertheless, the administration of a computational infrastructure involves many tasks, such as system configuration, preventive maintenance and storage management, which becomes very challenging for many research groups. With that in mind, this work proposes an infrastructure model to assist researchers with focus on Computer Vision. We conducted a series of tests to evaluate the performance of our model and the processing power of our infrastructure.
1. Introduction Nowadays, computers are crucial tools for research, being applied to the undertaking of modern scientific investigation, which includes preparation, experimentation, data collection, dissemination of results, long-term storage, and accessibility of all materials generated through the scientific process. This stepwise process holds true for research on Computer Vision as well. According to [Haralick 1989], Computer Vision has its experimental and theoretical aspects, which naturally creates its own requirements and challenges in terms of data management and experimentation infrastructure. As detailed in Section 2, experiments related to Computer Vision may deal with huge amount of data and require intensive computation effort. In addition, researchers often need to repeat their analysis several times before achieving satisfactory results, requiring the execution of a large number of experiments. Such number may be even higher when considering a Computer Vision research groups composed by many researchers. Therefore, a powerful computational infrastructure is desirable for keeping high performance and make possible the conduction of thorough experiments. The administration of a computational infrastructure involves many tasks, which include choice of hardware, system configuration, preventive maintenance, and storage management. A typical problem is that, due to lack of financial resources to hire dedicated professionals to the infrastructure management, very often, the researchers themselves become responsible for the administration and maintenance of equipments. However, researchers are focused on their studies and do not have enough time to maintenance
tasks, so the infrastructure components (hardware and software) often present malfunctions and/or are underutilized. Moreover, the project and implementation of a computational infrastructure is a challenge for many research groups because there are few studies to clarify how the infrastructure of a research group should be designed and which computational systems should be chosen. In this work, we propose a new e-Science platform with focus on Computer Vision. It relies on a complete infrastructure model to assist Computer Vision researchers in data management and experimentation tasks. Our model was planned based on the experiences acquired during the design and implementation of the computational infrastructure used by two research groups in the Department of Computer Science at Universidade Federal de Minas Gerais (UFMG): the Smart Surveillance Interest Group (SSIG)1 and the group of interest in Pattern Recognition and Earth Observation (PATREO)2 . Our goal is to describe not only the strategic decisions that were made, but also which systems we have chosen, aiming at providing aid to other research groups to implement their computing infrastructure.
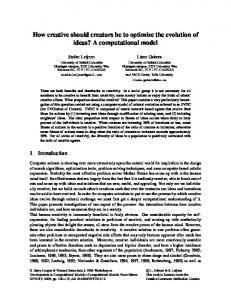
2. Research on Computer Vision Computer Vision is a research field that deals with the problem of deriving meaningful and useful information from visual data. According to [Szeliski 2010], the gap between computer and human performance in computer vision is still large and is likely to remain for many years. In general, the computer vision tasks make use to a wide range of mathematical techniques, including continuous mathematics, such as signal processing, variational approaches, three-dimensional and projective geometry, and linear algebra, and discrete mathematics and computer science, e.g., graph algorithms, combinatorial optimization and even database techniques for information retrieval. Therefore, computer vision can be characterized as an extensive field that does no present any unifying principles that can be used to simplify it. Part of this lies in the broad definition of computer vision, which is the analysis of images and video, as well as the incredible complexity inherent in the formation of visual imagery. A typical computer vision experimental scenario is an iterative cycle of moving data to a computer for analysis or simulation, launching computations and managing the storage of the output results. Thus, the computer vision experiments present high demand in computational resources, concerning three main aspects of an infrastructure: processing power, data storage, and network bandwidth. The majority of computer vision algorithms are complex and require high processing power while handling large amounts of data. For instance, Figure 1(a) illustrates the relationship between processing power and the amount of data generated by a single video camera. A high definition camera of 1920 × 1080 pixels, operating at 30 frames per second (FPS), generates more than 60 megapixels per second. Such large amount of data cannot be handled at the same frame rate by most of the computer vision algorithms. Similarly, Figure 1(b) depicts the storage usage for different recording periods. One fortnight of recording, at 1280 × 720 pixels, may generate 400 GB of visual data to be stored. Finally, Figure 1(c) shows that multiple cameras recording may easily satu1 2
http://ssig.dcc.ufmg.br http://patreo.dcc.ufmg.br
1200
60 50 40 30 20 10
50
1000
Bandwidth (Mb/s)
Storage Required (GB)
Number of Pixels (Mpx/s)
70
800 600 400 200 0
0
320 × 240
640 × 480
1280 × 720
20 fps
30 fps
30 20 10 0
Day
1920 × 1080
Week
Fortnight
Month
1
Period of Time
Image Size 10 fps
40
320 × 240
(a)
640 × 480
1280 × 720
(b)
5
10
25
Number of Cameras 320 × 240
640 × 480
1280 × 720
(c)
Figure 1. Amount of data recorded and effects onto processing, storage, and bandwidth, respectively. (a) Megapixels per second recorded by a single camera at different frame rates and resolutions; (b) Amount of storage required by different periods of time; (c) Bandwidth usage (Megabits per second) by multiple cameras at different resolutions.
rate the bandwidth. Such issues highlight the need of an infrastructure comprising all the aforementioned aspects and an integrated solution of easy management and maintenance.
3. The Proposed Computational Infrastructure The infrastructure model proposed in this work was designed to meet the computational demands of the our research groups. As illustrated in Figure 2, the infrastructure model can be divided into five main parts: (i) the Virtual Research Environment (Section 3.1) that provides to our researchers3 a flexible and scalable environment for computational experiments using the concept of virtualization; (ii) the Data Storage (Section 3.2), where different types of data manipulated in our experiments are stored and managed; (iii) the Network Management (Section 3.3), responsible for network devices and services; (iv) the User Management (Section 3.4), responsible for the administration of the infrastructure use as well as the user policies; and (v) Services (Section 3.5) that provides management systems to our researchers. 3.1. Virtual Research Environment Virtualization plays an important role to allow the scalability of our infrastructure. It allows both flexible working environments and easy management. Regarding flexible environments, virtualization provides to the users full control of their machines. As the users have their own virtual machine (VM), including operating system administrator access, they can easily install software and configure the environment according to their needs. To connect to their virtual machine, the end users use a personal computer. Virtualization also aids the easy management due to working with virtual machines integrated with hypervisor4 . One can easily allocate resources to a given virtual machine just by changing the number of CPU cores, memory, and disk size according to each user’s demand. For fast deployment of new a VM, we maintain virtual machine templates for frequently used operating systems pre-installed with the required software for computer vision research. 3
The term researcher and user are used interchangeably during the text. A hypervisor, also called a virtual machine manager, is a software that allows multiple operating systems to share a single hardware host. Each operating system appears to have the host processor, memory, and other resources entirely to itself. 4
Virtual Research Environment
Virtual Research Machines
Virtual Research Machines
Virtual Research Machines
Xen Server
Xen Server
Xen Server
Physical Research Server 01
Physical Research Server 02
Physical Research Server 03
Researcher Home
VPN
Other Organization
Web
Link Aggregation (4 Gb/s)
Local Area Network (LAN)
Physical Services Server
Raid Level 6
Backup Logical Volume Manager
Xen Server Virtual Services Machines Users Data
Virtual Disks
Image Datasets
Data Storage
Services
Firewall Gateway PPTP (VPN) DHCP DNS
Network Management
Samba4 Radius Log Analyser
User Management
Figure 2. The proposed computational infrastructure model.
Several virtualization hypervisors are available in the community. We opted for using XenServer5 , an operating system built on top of the Xen hypervisor, since it is an open-source solution and actively maintained. To manage each virtual machine, we use the XenCenter, also freely available by Citrix SystemsTM . There are alternative paradigms to virtualization, such as multiuser server or a single desktop for every user. However, the latter is not scalable in space and users. Besides, the multiuser server does not provide the user full control of the machine, requiring a machine administrator, and it is also more susceptible to data loss. To summarize, virtualization presents several advantages, being one of the key features in our infrastructure. We propose to use the virtualization along with the three phases of experimental evaluation in the following manner. In the first phase, the users work on their local prototype using their personal computer to code the algorithm, while the experiments are done using very simple and small tests. In the second phase, the users have already validated their algorithm for small inputs, now they may face two scenarios. They can either need to use a moderate amount of data to catch remaining bugs or require moderate resources and high memory to complete the prototyping. For both scenarios, they may use their virtual machines configured with moderate/high memory and moderate CPU resources. Finally, in the third phase, after the algorithm correctness has been verified in phase two, the users require to perform the real experiment, which is data intensive. For such purpose, we allocate more memory and CPU cores for their virtual machine. By employing these three phases approach, the computational resources available are well balanced among the several users in the research group. 3.2. Data Storage Due the large amount of data handled in computer vision tasks, we employ a storage server composed of eight disks combined by a Redundant Array of Independent Disks (RAID) of 5
http://xenserver.org/
level 6 and managed by Extend File System (XFS) and Logical Volume Manager (LVM). RAID is the way of combining several independent and relatively small disks into a single storage array of a large size. The disks can be combined into the array in different ways known as RAID levels. According to [Patterson et al. 1988], each level has its own characteristics of fault-tolerance, performance and capacity. We choose the RAID of level 6 that utilizes techniques to increase read speed and provide fault tolerance where the lacking of up to two disks in the array is tolerable by the operating system. Such setup provides us not only high speed to access the data but also low risk of data loss. To provide a dynamic management of disk allocation for the users, we use the XFS, which combines advanced journaling technology with full 64-bit addressing and scalable structures and algorithms. This combination delivers a scalable highperformance filesystem [Kamath et al. 2004]. Moreover, this file system is appropriate for computer vision scenery, where big data is usually generated. Our storage server keeps the user data, the image/videos datasets used in the experimental validations and the Virtual Hard Disks (VHD) of the virtual machines (detailed in Section 3.1). To allow a robust expansion of the volume disks in our environment, we implement a solution based on Logical Volume Manager (LVM). The LVM solution creates an abstract layer between the operation system and the hard disks. This way, we can increase the logical volumes [Hasenstein 2001]. We also perform data backup to prevent data loss unexpected ways, e.g., natural disasters and computer virus infection, using the open source software Bacula6 , which performs daily backups for the users virtual machines and their personal data. This service provides three different levels of backup: full, differential and incremental [Preston 2007]. We employ the incremental level, such strategy provides a backup of files that have changed or are new since the last incremental backup. 3.3. Network Management A computer network is an interconnected group of computers to share resources on the same LAN (Local Area Network). These shared resources can be files, data, multimedia or others devices like cameras. Sharing resources require the utilization of certain features. These are: (i) various client-server operating systems accessing the same resources; (ii) any shared hardware or files must be accessed via mapping, which requires services to translation IP addresses and IP naming; and (iii) mechanisms to provide security to remote access. Due to the large amount of data manipulated while conducting our experiments, we use link-aggregation [Wong et al. 2002], a technique that increases the bandwidth on the research hosts and storage server, as one can see in Figure 2. The idea of this technique is straightforward: treat a group of Ethernet ports as a single virtual port. This throughput aggregation increases the bandwidth and help to minimize the effects of the network limitations on the LAN. On the proposed model, we have a gateway to intermediate the connection of the internal machines and the Internet. In addition, we use our own services of Domain Name System (DNS) and Dynamic Host Configuration Protocol (DHCP). The DNS is utilized 6
http://bacula.org/
to provide easier and real-time access to our resources and the DHCP server aims to distribute the IP parameters to the clients once there is only one gateway that is actually connected to the Internet. To allow the external usage of the resources of our infrastructure, we made available a service of Virtual Private Network (VPN) in our gateway. This VPN is based on Point-To-Point-Tunneling-Protocol (PPTP), a solution that is native in several operating systems, ensuring a secure channel between the remote users and our infrastructure. 3.4. User Management The infrastructure delivers to users several services and computational resources, therefore, the security of it is of great importance. Thus, the first action of any new user is to sign a commitment term that explains how the infrastructure works, from services to the use of machines, as well as warns the new user regarding the responsibility of using the infrastructure, since any eventual damage in the infrastructure could be tracked by the system logs. Log services are essential to analyze the services and users and may be used to (re)allocate resources and surpass eventual problems. Log data contain information regarding performance, access patterns, security, and others precious hints which can be used to improve the infrastructure in many aspects and keep it away from future problems. The protocol utilized for the transmission of the log files trough the network is the rsyslog7 together with the tool LogAnalyser8 for the management. The protocol used to manage user directories, which may contain objects related to users, groups, computers, printers and other resources, is the Lightweight Directory Access Protocol (LDAP). This protocol has the great benefit of storing information for an entire organization into a central repository, which makes the maintenance easier. To facilitate even more, the active directory, a LDAP compliant database that contains objects, users, computers, and groups, is also employed. It intuitively provides authentication and authorization mechanisms as well as a framework within which other related services can be deployed. As aforementioned, there are different operating systems in the infrastructure (Windows, Unix, and Mac OS). To allow the management and sharing of resources in this type of network, Samba49 , a Unix-based software, was used. Thus, it is possible to use a Linux server to manage files, printers, and other resources, as if the network was using a Windows server. Samba4 provides all that with great security, since it maintains a rigorous resource control. 3.5. Services A well organized infrastructure is essential to ensure that our activities are carried out consistently and efficiently. Therefore, to manage some aspects in our infrastructure we utilize specific services (in general, every service uses a light-weight virtual machine). The main services provided are described as follows. 7
http://rsyslog.com http://loganalyzer.adiscon.com/ 9 https://samba.org/ 8
To provide access control and several collaboration features between the users for projects, we use a GIT repository management GitLab10 . Besides of many functionalities provided by the GitLab (e.g. web interface, wiki pages, code review, authentication and authorization integration with LDAP), it allows the creation of a self-hosted repository. We also provide a web-based project management, the Redmine11 , which allows us to manage multiple projects. Finally, as in the majority of the scientific community, we also encourage the information sharing between researchers. Therefore, the content developed by our groups normally is made available through services of websites using the WordPress12 , a Content Management System (CMS) easy to use.
4. Performance Evaluation Our infrastructure is currently composed of three physical research servers, one physical service server, one network server, one storage server, one network switch and a group of ten surveillance network cameras used in experiments. The physical research servers R are equipped with 128 GB of RAM memory and two Intel XeonTM 2.40 GHz with six physical cores each. The current storage capacity is 24TB. We performed a set of experiments to evaluate the CPU performance of our research servers to detect possible overheads when using virtualization. Two independent benchmarks were executed to evaluate the performance of the CPU units in our infrastructure. These benchmarks are called Blowfish and Cryptohash tests, provided by a benchmark tool13 that is publicly available to Unix-based systems. Both measure the performance of the processors, evaluating them in expensive algorithms of cryptography. The Blowfish test measures the performance of the processors as a function of time, which means that the result is better when it is low. On the other hand, the Cryptohash measures the performance in megabytes processed by the CPU per second, i.e., the higher values the better. We executed tests to evaluate the performance of the host and analyze the cost of virtualization using XenServer. Based on that, the experiments were conducted using the physical host and using a virtual host (one virtual machine with all host resources). In addition, we decided to vary the number of processor cores available to the benchmark tool to evaluate the influence in performance as a function of the number of cores. Figure 3 shows the results obtained. According to the results in Figure 3, tests executed in the physical host outperform the execution using one virtual machine with all host resources by 5% on the Blowfish test and by 12% on the Cryptohash. This means that there is an extra cost to utilize virtualization, but since this cost is relatively small, it is acceptable due to the benefits we obtain using virtualization, e.g., multi-user environment, balance of resources according to needs, and full control of the virtual machines by the users. We also performed another experiment, now using multiple virtual machines running in parallel in the same physical host. We varied the number of virtual machines and fixed the number of CPU cores in each one in order to evaluate only the cost to increase 10
https://gitlab.com/ http://redmine.org/ 12 https://wordpress.org/ 13 http://hardinfo-benchmark.com/ 11
1200
Physical Host Virtual Host
12.0
Output (MB/s)
Time (seconds)
15.0
9.0 6.0 3.0
Physical Host Virtual Host
900 600 300
0
0.0 1
2
3
4
5
6
7
8
Number of Cores
9
10
(a) Blowfish (lower is better)
11
12
1
2
3
4
5
6
7
8
Number of Cores
9
10
11
12
(b) Cryptohash (higher is better)
Figure 3. Note that, in both benchmarks, there is an attenuation in the difference when more CPU cores are used.
the number of virtual machines. Since our physical host has 12 virtual CPU cores, we performed experiments using 1, 2, 3 and 4 virtual machines with 3 cores each one. For this experiment, we concluded that even if we keep each core attached to a single virtual machine, there is a cost to increase the number of VMs in the physical host. The results show that when we add a new VM, the performance decreases by 2.5% on the Blowfish and by 3.9% on the Cryptohash, on average. That shows that is better to use multiples physical hosts with less processing power and with a few number of virtual machines on each, than use one physical host with high processing power and with a large amount of virtual machines on it.
5. Conclusions This work proposed a computational infrastructure model focused on the Computer Vision research area. This infrastructure includes a policy to user management, a virtualization schema, a network schema to provide remote access and interconnection between the services, and a storage server to maintain the research data. We evaluated the performance of our model by testing the infrastructure processing power. As expected, we observed that there is a cost to provide virtualization to the users. The tests show we loose some performance by providing virtualization to the users. However, the tests also show that this cost is minimal and it is acceptable due the great benefits obtained by providing this kind of service to a multi-user research environment.
References Haralick, R. (1989). Methodology for experimental computer vision. In Proceedings of IEEE Computer Vision and Pattern Recognition (CVPR 1989), pages 437–438. Hasenstein, M. (2001). The logical volume manager (lvm). White paper. Kamath, V. P., Brown, C. S., Pence, J. B., Shekaran, M. C., Lorimor, T. G., Firman, T. R., Gentile, E. J., and Toussaint, K. M. (2004). Extended file system. US Patent 6,754,696. Patterson, D. A., Gibson, G., and Katz, R. H. (1988). A case for redundant arrays of inexpensive disks (RAID), volume 17. ACM. Preston, C. (2007). Backup & recovery: inexpensive backup solutions for open systems. ”O’Reilly Media, Inc.”. Szeliski, R. (2010). Computer Vision: Algorithms and Applications. Springer-Verlag New York, Inc., 1st edition. Wong, D., Shih, C.-c., Cao, J., and Dai, W. (2002). Load balancing in link aggregation and trunking. US Patent 6,363,077.