Biotechnol. Prog. 2006, 22, 1507−1517
1507
ARTICLES A Computational Procedure for Optimal Engineering Interventions Using Kinetic Models of Metabolism Francisco G. Vital-Lopez, Antonios Armaou, Evgeni V. Nikolaev, and Costas D. Maranas* Department of Chemical Engineering, The Pennsylvania State University, University Park, Pennsylvania 16802
The identification of optimal intervention strategies is a key step in designing microbial strains with enhanced capabilities. In this paper, we propose a general computational procedure to determine which genes/enzymes should be eliminated, repressed or overexpressed to maximize the flux through a product of interest for general kinetic models. The procedure relies on the generalized linearization of a kinetic description of the investigated metabolic system and the iterative application of mixed-integer linear programming (MILP) optimization to hierarchically identify all engineering interventions allowing for reaction eliminations and/or enzyme level modulations. The effect of the magnitude of the allowed changes in concentrations and enzyme levels is investigated, and a variant of the method to explore high-fold changes in enzyme levels is also analyzed. The proposed framework is demonstrated using a kinetic model modeling part of the central carbon metabolism of E. coli for serine overproduction. The proposed computational procedure is a general approach that can be applied to any metabolic system for which a kinetic description is provided.
Introduction Recent advances in molecular biology enable the routine deletion or modulation of the expression level of genes in microbial production strains. This new capability has ushered a new era in microbial strain design where genome content can be manipulated at will. A challenge, however, is that the impact of deletions and/or expression modulations is hard to quantitatively predict. Stoichiometric models of metabolism (1-6) attempt to predict the impact of these modifications by optimizing an objective function that serves as a surrogate of true cellular behavior. These hypotheses include maximization of biomass formation (7), minimization of metabolic adjustment (MOMA) (8), regulatory on/off minimization (ROOM) (9) and ratio adjustment minimization (RAM) (10). These hypothesesdriven predictions have, in certain cases, been quite successful at recapitulating new fluxes after an environmental and/or genetic perturbation (11-14). However, in the absence of any regulatory or mechanistic information the stoichiometry-based predictions are bound to be incomplete. In contrast, kinetic models of metabolism directly capture engineering interventions as modifications in the parameters of the model. For example, gene knock-outs, as is the case with stoichiometric models, can be described by setting the maximum flux of the affected reaction to zero. On the other hand, repressions or overexpressions can be modeled by increasing or decreasing the corresponding maximum reaction rate parameters. A limitation of kinetic models is that they are typically constructed for a small subset of the totality of metabolism present and it is questionable whether parameter values are invariant in response to environmental or genetic changes (1). * To whom correspondence should be addressed. Tel: 1+814 863 9958. Fax: 1+814 865 7846. E-mail:
[email protected]. 10.1021/bp060156o CCC: $33.50
Several researchers have employed a hybrid modeling approach that combines stoichiometric information with high quality (kinetic) data, whenever available. For example, Beard and Qian have combined the stoichiometry with thermodynamic constraints to improve the prediction capabilities of stoichiometric models (15, 16). Covert and Palsson (17, 18) have incorporated the regulation of gene expression to flux balance analysis (FBA), whereas Mahadevan et al. (19) have extended FBA (i.e., dFBA) to describe the dynamic behavior of metabolic system. Gadkar et al. (20) included kinetic expressions in dynamic FBA to optimize the concentration of a targeted product molecule. For purely stoichiometric models we introduced the OptKnock (21) framework for optimal deletion strategies and extended it afterward in OptReg (22) to allow for up/down reaction modulations. The ultimate goal is to combine stoichiometric with kinetic descriptions, whenever available, in the context of hybrid kinetic-stoichiometric descriptions. Specifically, given an underlying kinetic description we would like to identify a prespecified number of knock-outs and/or over/under gene expression regulations that maximize the synthesis rate of targeted metabolite (e.g., maximum ethanol production). It is of particular importance to ensure that any proposed algorithms will be able to handle relatively large kinetic models irrespective of the form of the underlying functions used to describe kinetic rates. In this work, we are beginning to unravel some of these computational challenges by exploring how to optimally perform strain engineering modifications for a purely kinetic description. The approach proposed here relies on the iterative use of basis function linearization and mixed-integer linear programming (MILP) optimization. A number of different kinetic modeling descriptions are available, which are either mechanistic descriptions or general-
© 2006 American Chemical Society and American Institute of Chemical Engineers Published on Web 11/08/2006
Biotechnol. Prog., 2006, Vol. 22, No. 6
1508 Table 1. Examples of Generalized Reaction Rates generalized reaction rate linear
mathematical forma
r ) r0 + k(e - e0) +
∑ k (c - c i
i
0,i)
i
linear in logarithms
() ∑ ( ) ∏( ) ( ∑ ( ))
r ) r0 + k ln
e
e0
e0
thermokinetic, lin-log models
r)
e e0
Michaelis-Menten type r ) e
c0,i
ki
c0,i
i
ci
k+
(
ki ln
i
ci
e generalized mass action, r ) r 0k S-systems
ci
+
ki ln
i
c0,i
ci
cj
∏k +c -K∏k +c i
i
i
j
j
j
)
a r: reaction rate, e: enzyme level, c : concentration of metabolite i i affecting the rate; cj: concentration of metabolite j consider as a product in reversible reactions in the last equation; K: ratio of the reverse to forward rate constant; k, ki: kinetic parameters; r0, e0, c0,i stand for a reference state.
ized rate equations. In general, mechanistic kinetic models are mathematically more complicated and require more experimental information to parametrize; however, they offer a more comprehensive view of metabolism (23-26). On the other hand, kinetic models that draw from generalized rate equations conform all reaction rates to general forms (27). This results in more compact models with standardized nonlinearities that may lead to some loss of accuracy. Table 1 illustrates some examples of generalized rate equations such as linear approximations (28, 29), linear with respect to logarithmic functions (30), generalized mass action (GMA) and S-systems (31-34), thermokinetic descriptions (35), lin-log kinetics (36), and general MichaelisMenten type (37). As expected, the simplest linear approximations are valid only within a narrow region around the steady state at which they were parametrized. This region is substantially expanded in linear in logarithms models by substituting the linear variables by logarithmic expressions. Hatzimanikatis and Bailey (38) have shown that these models can accurately describe the dynamic response of a metabolic system that exhibits strong nonlinearities. Moreover, their kinetic parameters can be obtained, using the well-established metabolic control analysis (MCA) framework, either from a mechanistic model or from experimentally elucidated elasticities and control coefficients. Alternatively, reaction rates have been expressed as the product of enzyme levels and various functions of the concentrations. Given the aforementioned modeling frameworks, a number of optimization approaches have already been proposed that make use of these frameworks to drive the re-engineering of metabolism. Nonlinear programming (NLP) has been widely used for this purpose. For instance, Mendes and Kell developed a platform to determine the value of the enzyme levels and kinetic parameters that optimize a given metabolic output (39). They formulated the problem as a NLP and applied it on a branched metabolic pathway with feedback composed of eight metabolites and reactions along with 16 kinetic parameters. They solved the resulting NLP with a variety of methods including genetic algorithms and evolutionary programming. Visser et al. have used a large-scale lin-log kinetic model to determine the optimal enzyme modulations by solving a NLP (40). Similarly, Schmid et al. used a large-scale mechanistic model to address the same problem (41). In their approach they partitioned the manipulated variables (i.e., enzyme levels) into subsets and
solved a NLP for each subset while keeping the enzyme levels of all other subsets constant. In the pioneering works of Hatzimanikatis et al. (30) and Dean and Dervakos (42, 43) a number of novel questions regarding the redesign of the metabolic systems were raised, such as which enzymes and at what levels should be modulated to optimize a desired flux if only a given number of manipulations are allowed? To answer this question, Dean and Dervakos formulated the problem as a mixed-integer nonlinear programming (MINLP) problem based on a nonlinear kinetic model. Alternatively, Hatzimanikatis et al. used linear in logarithms functions to approximate the kinetic description of a relatively small metabolic model (i.e., six reactions and metabolites) and formulated the problem as a MILP. In both cases the employed models were relatively small with at most 32 reactions and 13 metabolites. In this paper, we determine the genes/enzymes that should be manipulated (i.e., deleted, repressed or overexpressed) to optimize the flow toward a target metabolite given a constrained number of total genetic manipulations for a general nonlinear kinetic model of a relatively large size. As in previous efforts, we assume that the enzyme levels can be manipulated independently of each other and that the levels of the enzymes not manipulated remain constant. Existing NLP-based approaches do not allow for only a prespecified number of manipulations. Hatzimanikatis et al. (30) and Dean and Dervakos (42, 43) laid the foundation toward answering some of these challenges. However, Hatzimanikatis et al. did not consider knockouts of genes, as the adopted linear in logarithms model (similar to second row in Table 1) becomes ill-defined when the enzyme levels approach zero. In the other case, the MINLP formulation proposed by Dean and Dervakos becomes hard to solve for problems involving a large number of enzymatic reactions (i.e., hundreds of reactions). The approach introduced here overcomes these limitations by first automatically deriving linearizations according to basis function approximations for arbitrary kinetic representations. Then, the modeling of knockouts of genes/ enzymes is implemented through the introduction of binary variables that “remove” the corresponding reactions from the system. By combining these approaches, the problem can be formulated as a MILP that can be solved for large metabolic systems. It should be mentioned that although linearization of the kinetic models confers mathematical and computational tractability to the problem, generally only moderate enzyme levels changes can be imparted and still maintain agreement with the nonlinear model. For large enzyme level changes, a MINLP-based modification of the procedure is described. In the next section we briefly describe the adopted mathematical description of metabolic networks followed by the proposed optimization procedure. Subsequently, we provide computational results, and the work is summarized.
Mathematical Description Metabolic Kinetic Models. Briefly, a metabolic system consists of a set of processes (enzymatic reactions and transport processes) that transform organic substrates into metabolic precursors and energy metabolites. The rate at which these processes take place depends on the concentration of the reactants/ products, the amount of inhibitors or activators, and the activity and level of the participating enzymes. Mathematically, the reaction rate of an enzymatic reaction can be expressed as
rj ) rmax j (ej)fj(cj,pj)
(1)
where rj represents the rate of reaction catalyzed by enzyme j,
Biotechnol. Prog., 2006, Vol. 22, No. 6
1509
rmax j (ej) is the maximum reaction rate, and ej is the corresponding enzyme level. fj(cj,pj) is a nonlinear function of the concentration of metabolites cj and kinetic parameters pj that affect this reaction. Typical examples for fj(cj,pj) are MichaelisMenten, Hill equation, GMA kinetics, and S-system (31-34), lin-log (30, 35, 36, 38, 40) and allosteric enzymes type kinetics as discussed in the previous section. For a metabolic system of m reactions, n metabolites, and k kinetic parameters, the reaction rates are related through the mass balances of the metabolites. These mass balances can be described by a set of ordinary differential equations:
dc ) S‚r(e,c,p) dt
(2)
Here c is the n-dimensional vector of metabolite concentrations, r is the m-dimensional vector of reaction rates, e is the m-dimensional vector of enzyme levels, p is the k-dimensional vector of parameters, and S is the n × m stoichiometric matrix. It should be noted that a dilution accounting term due to cellular growth can be incorporated in eq 2 as in ref 24. Equations 1 and 2 capture the general structure of general kinetic models addressed in this work. Optimization. Given the model description outlined above, we use mathematical optimization tools to answer the following questions: (1) Which genes should be deleted? (2) Which genes should be repressed or overexpressed or combinations thereof in order to maximize the flow through a prespecified flux? This optimization task involves both discrete 0-1 variables (e.g., whether a gene is targeted for deletion or modulation of expression) as well as continuous variables (e.g., metabolic fluxes and concentrations). The mathematical formulation of this task gives rise to mixed-integer nonlinear programming (MINLP) problems with a nonconvex continuous part (42, 43). Although there exist algorithms (44) for globally solving this class of problems, the solution procedure is highly dependent on the type of nonlinearities and typically cannot handle problems of the targeted size and complexity. Local MINLP solvers (45, 46) may provide satisfactory solutions for mediumscale metabolic systems (i.e., tens of enzymatic reactions); however, computational burden hinders the application of these solvers as the size of the system increases. This is incompatible with our objective to introduce a procedure that would be applicable for kinetic models involving arbitrary nonlinear expressions with as many as hundreds of reactions. By allowing for perturbations of limited size around the steady-state values, the same questions can be addressed using a MILP representation using customized linearizations that can be obtained adopting different basis functions. These linearizations according to different basis functions are next described in detail. Generalized Linearization. Instead of using the standard Taylor expansion and retaining only up to linear terms, we employ a Lagrange expansion according to an arbitrary basis function to enable the best possible approximation of the nonlinear kinetics (47). This generalized linearization is accomplished for any arbitrary kinetic model, represented by eqs 1 and 2, as a function of the enzyme levels and metabolite concentrations, while keeping the kinetic parameters p constant: Let xj ) gj(ej) for j ) 1, ..., m and yi ) hi(ci) for i ) 1, ..., n such that g′j(e0,j) * 0 and h′i(c0,i) * 0, then the linearization of eq 1 based on the variables xj and yi is given by
rj ) r0,j +
(
n ∂rj 1 | ∂rj 1 | | (x - x ) + | (y - y ) j 0,j i 0,i | | ∂ej g′j|e i)1 ∂ci h′i|c 0, j 0, i
∑
)
(3)
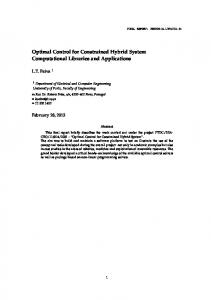
Figure 1. Hierarchical procedure for identifying optimal gene manipulation strategies. At each iteration of the outer loop q manipulations are enforced and qmax is the maximum number of manipulations. At each iteration of the inner loop a cut is added to exclude the current solution in the next iteration. zq is the objective function of interventions / of q manipulations and zq-1 is the best objective function value of the best intervention strategy of q-1 manipulations.
where r0,j, e0,j, x0,j, c0,i and y0,i are the values of rj, ej, xj, ci and yi at the reference value, respectively. It should be noted that the region where the linearization satisfactorily approximates the nonlinear model depends on the form of the reaction rates expressions. For instance, this region may be relatively large for Michaelis-Menten kinetics, whereas it could be considerably smaller for sigmoidal kinetics. Many standardized models conform to the formalism described above such as the approach introduced in ref 30 and the S-systems evaluated at steady state (31, 34). For example, the log-linear description introduced in ref 30 is a special case of the generalized linearization described above by setting gj(ej) ) ln ej and hi(ci) ) ln ci. Other basis functions can be used depending on the nonlinearities in the original kinetic model with the objective to improve on the expected approximation error. Incorporating the linearized reaction rates in the mass balances, eq 2 yields
dy ) Yc‚S‚(r0 + G0‚∆x + H0‚∆y) dt
(4)
where ∆x ) x - x0 and ∆y ) y - y0, Yc is a n × n diagonal matrix with elements Yc,ii ) dyi/dci, G0 is a m × m diagonal matrix with elements Gjj ) (∂rj/∂ej)(1/g′j ), and H0 is a m × n matrix with elements Hji ) (∂rj/∂ci)(1/h′j ), both evaluated at the reference steady state. Equation 4 approximates the nonlinear model as linear function of ∆x and ∆y in the neighborhood of the reference state. At a steady state of eq 4, the time derivative of c vanishes, as long as ∂yi/∂ci * 0 and ∂yi/∂ci are finite for all i, since dci/dt ) (dci/dyi)(dyi/dt). The enzyme levels and the metabolite concentrations can be obtained from this linearized model by taking the inverse of the corresponding functions, i.e., ej ) g′j(xj) and ci ) h-1 i (yi). This generalized linearization enables the expression of the continuous parts of the problem formulation using linear expressions. Different basis functions
Biotechnol. Prog., 2006, Vol. 22, No. 6
1510
can be used depending on the nonlinearities in the original kinetic model. These linear expressions allow us to formulate the optimization problem using a MILP description. Hierarchical Complete Enumeration of Genetic Interventions. Figure 1 illustrates the sequence of hierarchical calculations needed to elucidate the complete set of genetic manipulations leading to an improved phenotype. Specifically, first we identify all single genetic interventions that improve upon the current phenotype by starting from the optimal and subsequently generating the second, third, etc. best by excluding the previous solution and rerunning the problem. Next we proceed to identify double interventions (either knock-outs or modulations) that are at least as effective as the best single intervention strategy. This additional requirement ensures that only genetic modifications that contribute directly to an improvement are generated. This iterative procedure is continued up to a prespecified number qmax of genetic interventions, which determine the number of iterations of the outer loop. The core of this scheme is the optimization problem that has to be solved at each inner iteration. This optimization problem is formulated as a MILP, which is described next. MILP Formulation. Figure 2 pictorially illustrates the geometric interpretation of the two types of genetic interventions considered. The presence of knock-outs partitions the feasible region into a union of disjoint subregions. These subregions are hyper-rectangles of dimensions that range from m - qw to m, where qw is the number of allowed knock-outs. In the absence of knock-outs a single hyper-rectangle of dimension m is present. Genetic interventions are modeled using the following two sets of binary variables:
{ {
Vj ) wj )
1 if enzyme j is modulated 0 otherwise
1 if enzyme j is knocked-out 0 otherwise
If enzyme j is knocked-out, then its corresponding reaction rate must be set equal to zero. A straightforward way to ensure this is to use the following constraints:
Figure 2. Disjoint feasible region corresponding to the MILP formulation. The diagram illustrates the disjoint feasible region of the enzyme levels for j, k, and l. If no knock-outs are allowed, the optimal solution lies on the cube enclosing the reference state. If one knock-out is allowed, the feasible region will also contain the projections of the cube on the planes formed by the two axes. Increasing the number of allowed knock-outs will expand the feasible region with the addition of more disjoint sets as shown in the figure by the lines on the axis (double knock-out) and the point at their intersection (triple knockout).
expression levels and metabolite concentrations as ∆xl,u j ) gj l,u l,u (el,u ) g (e ) and ∆y ) h (c ) h (c ), respectively. The j j 0,j i i i i 0,i bounds on rj and uj can be chosen to be conservative (e.g., very large values for the upper bounds). However, tighter bounds will speed up the solution of the MILP. The maximum lower bounds and minimum upper bounds for rj and uj can be coml,u puted by using ∆xl,u j , ∆yi and eq 5. Based on the analyses described above the optimization problem is posed as the following MILP formulation (I): m
max z )
n
rlj(1 - wj) e r0,j + G0,jj∆xj +
(H0,ji∆yi) e ruj (1 - wj) ∑ i)1
where rlj and ruj are lower and upper bounds for rj. However, these constraints would impose invalid restrictions on ∆xj and ∆yi when wj ) 1. This can be avoided by introducing two extra terms into eq 3:
∑ j)1
n
dj(r0,j(1 - wj) + G0,jj∆xj +
subject to m
Sij(r0,j(1 - wj) + G0,jj∆xj + ∑ j)1 n
(H0,ji∆yi) + uj) ) 0 ∑ i)1
n
rj ) r0,j(1 - wj) + G0,jj∆xj +
(H0,ji∆yi) + uj ∑ i)1
(H0,ji∆yi) + uj) ∑ i)1
∀ i (c.1)
(5)
and the following constraints:
rlj(1 - wj) e r0,j(1 - wj) + G0,jj∆xj +
∆x ljVj e ∆xj e ∆xuj Vj ∆yli e ∆yi e ∆yui
∀j ∀i
(c.2)
(c.3)
n
(H0,ji∆yi) + uj e ruj (1 - wj) ∑ i)1 uljwj e uj e uuj wj where uj is a continuous variable and ulj and uuj are lower and upper bounds for uj. The lower and upper bounds in ∆xj and ∆yi are computed directly from the bounds on the allowed changes on enzyme
rlj(1 - wj) e r0,j (1 - wj) + G0,jj∆xj + n
(H0,ji∆yi) + uj e ruj (1 - wj) ∑ i)1 uljwj e uj e uuj wj
∀j
∀ j (c.4)
(c.5)
Biotechnol. Prog., 2006, Vol. 22, No. 6
1511
m
(Vj + wj) ) q ∑ j)1
(c.6)
m
Vj ) qV ∑ j)1
(c.7)
m
wj ) qw ∑ j)1 Vj + wj e1 m
∑
j|wjt)1
∀j
(c.8) (c.9)
m
wj +
∑ Vj e q - 1
∀ t ) 1, 2, ..., T - 1 (c.10)
j|yjt)1
In formulation (I) a weighted combination of fluxes is, in general, being maximized where dj is the weight given to reaction rj in the objective function. The constraints (c.1) describe the mass balance at steady state for each metabolite concentration. Constraints (c.2) and (c.3) delimit the region where the linearized kinetic model reasonably describes the metabolic system. Constraints (c.2) allow a change in ∆xj only if the corresponding enzyme is to be modulated; otherwise ∆xj is set equal to zero. Constraints (c.3) provide lower and upper bounds on metabolite concentrations. Constraints (c.4) and (c.5) are included to model enzyme knock-outs. If enzyme j is knocked-out (i.e., wj ) 1), then constraints (c.4) set to zero its corresponding reaction rate, whereas constraints (c.5) allow uj to vary between its lower and upper limits. On the other hand, if enzyme j is not eliminated, constraints (c.5) set uj ) 0 while constraints (c.4) allow rj to vary within its lower and upper limits. The total number of manipulated enzymes (modulations plus eliminations) is set equal to q through constraint (c.6), while constraints (c.7) and (c.8) control the number of modulations and knock-outs, respectively. Simultaneous knock-out and modulation of the same enzyme is avoided through constraints (c.9). Finally, in order to determine the Tth optimal solution considering q manipulations, constraints (c.10) are used to exclude the solutions derived in previous iterations. These constraints are referred to as cuts in Figure 1 and one of such cuts is added at each iteration of the inner cycle. The accumulation of these cuts is restarted at the beginning of the outer cycle. By solving formulation (I), the desired values of enzyme expression levels and the concentrations are obtained from ej -1 ) g-1 j (x0,j + ∆xj) and ci ) hi (y0,i + ∆yi). Next we demonstrate the application of the computational framework by determining optimal genetic manipulation strategies through an example of a kinetic model of the central carbon metabolism of E. coli (24).
Computational Results and Discussion The proposed scheme was employed to determine optimal genetic manipulation strategies that maximize the flux of a prespecified reaction in a relatively large-scale metabolic kinetic model. Specifically, the objective is to maximize serine synthesis in E. coli. Current serine production methods include enzymatic and whole cell conversions from glycine and methanol, whereas processes of direct fermentation from glucose are not common (48). The model used, introduced by Chassagnole et al. (24), describes part of the central carbon metabolism of E. coli and is graphically presented in Figure 3. It includes the glycolysis and the pentose phosphate pathway (PPP) as well as drain fluxes
Figure 3. Overview of central carbon metabolism of E. coli. See Notation section for notation.
of metabolic precursors (e.g., pyruvate, phosphoenol-pyruvate, etc.) to the synthesis of cellular components. The model comprises 17 metabolites and 30 nonlinear reaction rates (e.g., reversible Michaelis-Menten, Hill equation, allosteric regulation, etc). An important limitation of this model is that it does not include mass balances for cofactors such as ATP, NADH and NADPH. Therefore in this work we assumed that the concentrations of the cofactors remain constant. This assumption may significantly affect the quality of the result obtained, but it does not affect the fundamentals of the proposed procedure. We investigate the maximization of serine synthesis by (i) enforcing only knock-outs, (ii) enforcing only modulations of enzyme levels and (iii) allowing for both modulations and knock-outs simultaneously. In order to select the basis functions for the generalized linearization, the log-linear description used by Hatzimanikatis et al. (30) and the option gj(ej) ) ej/e0,j and hj(cj) ) ln cj were tested. The test consists of comparing the steady-state reaction rates and concentrations predicted by the linearized models with those corresponding to the nonlinear model after perturbation of a number of enzyme levels. The perturbed enzymes and the perturbation levels were determined randomly using a uniform distribution. Figure 4 shows the average errors of the linearized models for different numbers of perturbed enzymes (100 data points were considered for each number of perturbed enzymes). As can be appreciated, both approximate models (squares represent log-linear description; circles represent gj(ej) ) ej/e0,j, hj(cj) ) ln cj) cause similar average errors in the predicted concentrations (white points) and fluxes (gray points). However, the average errors considering only the fluxes associated with perturbed enzyme levels (black points) are significantly smaller for the case gj(ej) ) ej/e0,j and hi(ci) ) ln ci. Therefore, we adopt this basis function set to perform the linearization. We allow enzyme levels to vary only by a factor of 2 (i.e., elj ) 0.5e0,j and euj ) 2e0,j) unless they are eliminated, whereas metabolite concentrations are allowed to deviate from the reference state by no more than 50% (i.e., cli ) 0.5c0,i and cui ) 1.5c0,i). These bounds correspond to ∆xlj ) -0.5, ∆xuj ) 1, ∆yli ) ln0.5, and ∆yui ) ln1.5. The linearization was performed
Biotechnol. Prog., 2006, Vol. 22, No. 6
1512
Table 2. Optimal Knock-Out Strategies to Maximize Serine Synthesisa knocked-out enzymesb
r*/r0*
Figure 4. Deviations of the linearized models with respect to a nonlinear kinetic model of E. coli (24). Squares correspond to gj(ej) ) ln ej, hj(cj) ) ln cj and circles correspond to gj(ej) ) ej/e0,j, hj(cj) ) ln cj. ci and rj are the predictions of the nonlinear model; the superscript l denotes the predictions of the linearized models using the indicated functions and the subscript 0 stands for the reference value. M and m′ define the set and number of perturbed enzymes respectively. The deviations of the linear models from the nonlinear predictions are the average for 100 data points. Each data point was obtained by determining the deviations of the steady-state reaction rates and metabolite concentrations after random perturbations of the enzyme levels within 0.5e0,j e ej e 2e0,j. The uniform distribution was used to choose the perturbed enzymes and the perturbations levels. Only points with 0.5c0,i e ci e 1.5c0,i were considered.
with the symbolic toolbox of MATLAB, and the MILPs were solved with CPLEX using the interface CPLEXINT (49). In the following subsections, we present the results for each policy. Subsequently, the effect of the upper limits on the metabolite concentrations is investigated, and finally we consider a variation of the proposed scheme to explore larger changes on the enzyme levels. I. Allowable Manipulations: Knock-Outs. Table 2 lists the identified optimal gene knock-out strategies for serine overproduction (only the top five results are presented for each case). Not surprisingly, most of the single and double knock-outs strategies involve only end-point reactions in the kinetic model. Knock-outs of non-terminal steps are not chosen because they tend to cause large concentration changes. Enzymes of the PPP (eG6PDH and ePGDH, see Notation) only appear in the triple knockouts, whereas glycolytic enzymes (ePGI and ePK) are selected in the best set with four knock-outs and in all the sets with five and six knock-outs, respectively. The best single manipulation is the knock-out of eDAHPS. This strategy is not intuitive since this reaction does not compete directly with the serine synthesis. It improves the serine production because it increases the concentration of cPEP, which in turn results in an increase of the concentration of the serine precursor (3-phospho-glycerate, c3pg). This knock-out also occurs in all of the best multiple knock-outs. In the best double strategy, the knock-out of eG1PAT increases the concentration of cg6p, resulting in a reduction of rPTS, which is the main consuming reaction of cPEP. The best strategies with four, five and six knock-outs involve eDAHPS, eG1PAT, ePGI and ePK. In these sets, the knock-out of ePGI is interesting since one would expect the overexpression of the enzymes upstream of the flux to be maximized in order to
1.004 1.010 1.037 1.043 1.055 1.055 1.056 1.059 1.061 1.073 1.076 1.077 1.077 1.083 1.087 1.088 1.092 1.095 1.097 1.097 1.098 1.100 1.116 1.117 1.118
G3PDH G1PAT RPPK SYN1 DAHPS DAHPS G1PAT DAHPS G3PDH G1PAT G6PDH G6PDH G6PDH RPPK SYN1 SYN1 SYN1 G3PDH PGI PGI PGI PGI PGI PGI PGI
METS SYN1 MURS DAHPS DAHPS PGDH PGDH PGDH SYN2 SYN2 SYN2 SYN2 SYN1 PK PK PK PK PK PK PK
TRPS TA TKA DAHPS DAHPS DAHPS DAHPS SYN2 G1PAT PGLM G1PAT G3PDH G1PAT G1PAT G1PAT
METS MURS DAHPS DAHPS G1PAT DAHPS DAHPS DAHPS G3PDH G3PDH
DAHPS METS MURS MURS DAHPS DAHPS
METS
a
r*/r0* is the ratio of the objective function respect to the reference value. The strategies are sorted in ascending order. Only the top five strategies are presented for each number of allowed knock-outs. b See Notation section for notation. Table 3. Optimal Modulations Strategies to Maximize Serine Synthesisa r*/r0* 1.043 1.058 1.061 1.063 1.949 2.001 2.010 2.012 2.012 2.016 2.073 2.074 2.084 2.129 2.129
modulated enzymes (ej/e0,j ) PFK (1.309) GAPDH (1.539) PK (0.5) PEPC (0.5) SERS (2) PDH (2) PK (0.5) PTS (1.328) PEPC (0.5) PFK (1.479) GAPDH (1.595) GAPDH (1.579) GAPDH (1.774) PTS (1.403) PFK (1.567)
SERS (2) SERS (2) SERS (2) SERS (2) SERS (2) PK (0.5) PEPC (0.5) PDH (2) GAPDH (1.964) GAPDH (1.944)
SERS (2) SERS (2) SERS (2) SERS (2) SERS (2)
a r*/r * is the ratio of the objective function with respect to the reference 0 value. The strategies are sorted in ascending order. Only the top five strategies are presented for each number of allowed manipulations. See Notation section for notation.
increase the carbon supply. Moreover, this knock-out redirects the carbon flux through the PPP, which is stoichiometrically less efficient because of the loss of one carbon as CO2 per each molecule of glucose processed through this pathway. This knock-out is selected however, because other knock-outs lead to larger changes in concentrations than allowed by the imposed bounds. An important observation of the results listed in Table 2 is that the best single knock-out produces only a 5.5% increment in the rate of serine production, whereas when allowing for as many as six knock-outs only up to an 11.8% increase is achieved. This suggests that serine production cannot be improved considerably by implementing only knock-outs without allowing for drastic concentration changes. This contrasts with the results obtained based on a purely stoichiometric model
Biotechnol. Prog., 2006, Vol. 22, No. 6
1513
Table 4. Optimal Modulations/Knock-Out Strategies to Maximize Serine Synthesisa r*/r0* 1.055 1.058 1.061 1.063 1.949 2.010 2.012 2.012 2.016 2.074 2.106 2.129 2.129 2.129 2.129
modulated + KO enzymes (ej/e0,j) DAHPS (0) GAPDH (1.539) PK (0.5) PEPC (0.5) SERS (2) PK (0.5) PTS (1.328) PEPC (0.5) PFK (1.479) PK (0) TIS (2) GAPDH (1.191) PTS (1.403) GAPDH (1.497) PFK (1.567)
SERS (2) SERS (2) SERS (2) SERS (2) SERS (2) PEPC (0) PEPC (0) GAPDH (1.964) PK (0) GAPDH (1.944)
SERS (2) SERS (2) SERS (2) SERS (2) SERS (2)
a r*/r * is the ratio of the objective function with respect to the reference 0 value. The strategies are sorted in ascending order. Only the top five strategies are presented for each number of allowed manipulations. See Notation section for notation.
by Pharkya et al. (50). In the cited work a triple knock-out of ENO, ATPase and serine deaminase (the last two enzymes are not considered in the kinetic model) yields a theoretical molar yield of 0.987 with respect to glucose, whereas the kinetic based prediction even after six knock-outs is only 0.122. This indicates, at least for this case, that the kinetics of the enzymatic reactions imposes significantly stronger restrictions than stoichiometry alone. In the following subsection we present the strategies found when only modulations are allowed. II. Allowable Manipulations: Modulations. Table 3 shows the optimal sets and enzyme levels leading to the maximization of serine synthesis when only modulations of the enzyme level are allowed. Not surprisingly, the increase of eSERS, corresponding to the flux that is being maximized, represents the best single modulation. Doubling the level of eSERS increases the serine synthesis rate by 94.9%. The remaining single modulations improve the serine synthesis indirectly by increasing the concentration of its precursor. Two of them increase the flux upstream of this metabolite by increasing the level of ePFK and
eGAPDH while the other two reduce fluxes downstream by diminishing the levels of ePK and ePEPC. In all cases, only modest improvements of less than 6.5% are achieved. This is also the case when two or three enzymes are modulated. All double and triple manipulation strategies include eSERS. Modulation of ePFK in the best double strategy improves rSERS by only an additional 6.7%, while modulation of ePFK and eGAPDH in the best triple strategy accounts for only 18% of the total improvement. The maximum value of the serine synthesis rate, an improvement of 112.9%, is achieved by two different sets of triple modulations. In both triplets eSERS is overexpressed at the maximum allowed level, while eGAPDH and ePTS or ePFK are up-modulated such that c3pg reaches its upper limit. Due to the constraints on the upper limits of eSERS and c3pg, further modulations do not improve the serine synthesis. This occurs in this case because the linear objective function depends only on eSERS and c3pg and three modulations are enough to make them reach their corresponding upper limits. If eGAPDH is not overexpressed together with eSERS the maximum value of the serine synthesis is not reached even after six modulations. This suggests that the overexpression of eGAPDH is important to maximize the serine synthesis according to the kinetic model. Another interesting result is that the enzymes that are modulated to a lower level, ePK and ePEPC, are not among the best single, double and triple knock-outs shown in Table 2. This is because the elimination of these enzymes induces changes in concentration that lie outside the allowable concentration ranges. III. Allowable Manipulations: Knock-Outs and Modulations. The strategies for simultaneous knock-outs and modulations produce improvements similar to those obtained when only modulations are allowed. The results are shown in Table 4. The single manipulations are the same as those for modulations, but in the first row overexpression of ePFK is replaced with the knock-out of eDAHPS. The most important single manipulation is again the overexpression of eSERS, while the other manipulations have only a minor effect on the serine synthesis. In the case of two manipulations, the best option is the overexpression of eSERS and knock-out of ePK, while the remaining manipulations are the best double modulations. The maximum value of this flux is still achieved with only three manipulations, but the
Table 5. Optimal Strategies To Maximize Serine Synthesis Using Large Upper Bounds for Concentrationsa ∆xuj ) ln(2); ∆yui ) ln(11)
r*/r0*
Knock-Outs 1.176 1.368 1.453 1.505 1.516 1.517
PEPC PK PK PK PK PK
PEPC PEPC PEPC PEPC PEPC
SYN1 G1PAT RPPK RPPK
SYN1 SYN1 SYN1
TRPS TRPS
METS
SERS (2) PEPC (0.5) PK (0.5)
SERS (2) PEPC (0.5)
SERS (2)
SERS (2) SERS (2)
DAHPS (0)
Modulations (ej/e0,j) 1.949 2.140 2.247 2.387 2.450 2.511
SERS (2) PTS (2) PTS (2) PTS (2) PTS (2) PTS (2)
SERS (2) GAPDH (2) PFK (2) PFK (2) PFK (2)
SERS (2) GAPDH (2) GAPDH (2) GAPDH (2)
Knock-Outs + Modulations, (ej/e0,j) 1.949 2.140 2.342 2.511 2.703 2.763 a
SERS (2) PTS (2) PTS (1.841) PTS (2) PTS (1.937) PTS (1.382)
SERS (2) PEPC (0) GAPDH (2) GAPDH (2) GAPDH (1.896)
SERS (2) PEPC (0) PK (0) PK (0)
SERS (2) PEPC (0) PEPC (0)
r*/r0* is the ratio of the objective function respect to the reference value. Only the best strategy is presented for each number of allowed manipulations. See Notation section for notation.
1514
Biotechnol. Prog., 2006, Vol. 22, No. 6
Figure 6. Procedure to determine optimal manipulation strategies for unrestricted changes in concentration and enzyme levels. The nonlinear model is linearized, and the local information is used to determine the enzyme to be manipulated by solving a MILP problem. The optimal enzyme levels are estimated by solving a NLP problem based on the nonlinear kinetic model through the SQP method. Counter i controls the number of iterations in the inner loop, and imax is the maximum number of iterations. q is the number of required manipulations, and qmax is the maximum number of manipulations. Figure 5. Comparison of predictions from MILP formulation and the nonlinear model. Plots illustrate the value of objective function predicted by the MILP formulation (lines) and the corresponding value calculated with the nonlinear model (points) for the optimal strategies. Circles and continuous lines correspond to narrow bounds (∆xuj ) 2, ∆yui ) ln1.5). Squares and dashed lines correspond to the wide upper bounds (∆xuj ) 2,∆yui ) ln11). (a) Strategies involving only knock-outs. Light gray, gray, and black indicate one, three and five knock-outs, respectively. (b) Strategies involving both knock-outs and modulations. Light gray, gray and black indicate two, four and six manipulations repectively.
combination of knock-outs and modulations produce two additional strategies, offering more options. As in the modulation cases, the serine synthesis flux can be increased by a maximum of 112.9%. The yield of the triple manipulations involving either the knock-out of ePK or ePEPC (0.19 mol serine/mol glucose) is somewhat larger than the yield of the strategies involving the overexpression of ePTS or ePFK (0.16 mol serine/mol glucose). These yields, however, are lower compared to the molar yields with respect to glucose of 0.55 and 0.64 achieved by engineered strains of B. flaVum in an industrial process (51) and C. glutamicum (48). In these strains, the enzymes of the serine synthesis pathway are overexpressed while the serine degrading pathways are deleted or repressed. These manipulations are equivalent to the strategy of the single modulation of eSERS since serine degrading pathways are not considered in the kinetic model used. The low yields predicted by the linearized kinetic model are due to the restriction on the maximum level of eSERS. The overexpression of eGAPDH appears again in all of the sets that achieve the maximum value. Effect of the Upper Limit on Concentrations. In the previous subsections, we identified optimal strategies that comply
with the constraints on the allowable concentration deviations (i.e., (50%). Clearly, the obtained results and accuracy depend on the imposed concentration bound ranges. For relatively small allowed concentration changes the accuracy of the linearized kinetic model is high at the expense of perhaps omitting engineering interventions due to the overly conservative concentration bounds. On the other hand, when allowing for larger concentration deviations, more strategies are sampled at the expense of moving outside of physiologically relevant ranges. The effect of the upper limit on concentrations on the calculated strategies is examined by solving the previous case study after allowing the concentrations to change up to 10-fold (i.e., ∆yui ) ln(1 + 10). The estimated optimal strategies are presented in Table 5 (only the best set for each case is shown). In general, relaxing the concentration bounds leads to higher serine overproductions. Six manipulations allow a serine synthesis rate of 99.9% of its maximum value. The second part of Table 5 shows the best strategies when only modulations are allowed. The results suggest that after eSERS, the next best candidates to be modulated are ePTS and eGAPDH. The strategies obtained when both knock-outs and modulations are allowed are shown in the third part of Table 5. We next estimated the value of the serine synthesis rate (rSERS) using the nonlinear model based on the enzyme levels predicted by the linearized model to compare the quality of the predictions using narrow (i.e., 50% fold changes) and wide (i.e., 10-fold changes) bounds in concentrations. Figure 5 shows that when only knock-outs are allowed, the linearized model, in general, offers reasonable accuracy for narrow concentration bounds, but the error is considerable for the wide concentration bounds.
Biotechnol. Prog., 2006, Vol. 22, No. 6 Table 6. Iteration Number of the Best Ten Identified Sets using the MILP-SQP N.M.a
iteration numberb
1 1 4 5 7 6 15 3 10 2 12 2 2 4 7 11 3 6 14 10 8 5 3 4 10 2 34 5 69 8 41 68 7 4 4 5 26 6 15 95 31 30 13 36 5 2 4 12 26 88 8 25 95 34 24 6 85 65 86 50 13 53 1 59 3 9 a N. M.: number of manipulations. For each number of manipulations 100 iterations were performed. Bounds used in MILP: 0.9e0 < e < 1.1e0, 0.5c0 < c < 11c0. NLP: 0 < e < 5e0, 0.001c0 < c < 10c0. b Solutions ordered according to decreasing objective function value.
Modified Algorithmic Procedure for Large Concentration Ranges. As described above using local information to identify optimal strategies, allowing large changes in concentration and enzyme levels (results not included) can lead to large approximation errors. To remedy this, we propose a variant of the algorithmic procedure illustrated in Figure 6. This modified procedure uses information at the reference state to predict which enzymes have to be manipulated by solving a MILP. Then the enzyme levels that maximize the serine synthesis rate and the corresponding metabolite concentrations are determined by solving a NLP formulated using the original nonlinear kinetic model. The NLP was solved using a SQP method. In Table 6 we present the iteration number at which the best 10 identified sets were obtained from the procedure (only strategies involving up to six manipulations are considered). In the cases of one and two manipulations, the best 10 sets were determined in the first 10 and 15 iterations, respectively. However, for the cases of three or more manipulations the best solutions are found in late iterations.
Summary In this work we presented a computational procedure to determine the gene/enzymes manipulations that maximize the production of a metabolite of interest based on a kinetic model. The procedure is based on iteratively solving MILPs resulting from the linearization of arbitrary kinetic models of metabolism and the use of binary variables to describe the knock-out or modulation of enzymes. Its implementation was illustrated by identifying intervention strategies that maximize the serine synthesis rate according to a kinetic model of a part of the central carbon metabolism of E. coli. Through the application of the proposed scheme, optimal strategies involving only knock-outs, only modulations, or both were determined. We found that the obtained engineering strategies and robustness depended heavily on the width of bounds on metabolite and enzyme levels. We concluded that, at least for the case study used in this work, relatively narrow bounds on concentrations generated relatively accurate predictions while for wider concentration ranges there was significant divergence between nonlinear and linearized model predictions. This implies that local information alone is not sufficient to identify optimal strategies of three or more manipulations when large changes in enzyme levels are allowed. The proposed computational procedure can be a useful tool to aid in the identification of various types of engineering interventions in the redesign of metabolic production systems. Moreover, the generality of the procedure ensures its applicability for any metabolic system for which a kinetic description is provided. This work is a step toward the development of a framework that permits the accurate prediction and selection of the effects of genetic manipulations through the integration of the metabolic knowledge available and/or accessible to such stoichiometry, kinetics, regulatory information, etc. All relevant
1515
MATLAB files are available as Supporting Information; however, a license from ILOG for CPLEX and Matlab 7 are required to execute the scripts.
Notation Enzymes PT PGI PFK ALDO TIS GAPDH PGK PGM ENO PK PDH PEPC PGLM G1PAT RPPK G3PDH SERS SYN1 SYN2 DAHPS G6PDH PGDH RU5P R5PI TKA TKB TA MURS TRPS METS
a phospho-transferase system glucose-6-phosphate isomerase phosphofructo-kinase aldolase triosephosphate iso-merase glyceraldehyde-3-phosphate dehydro-genase phosphoglycerate kinase phospho-glycerate mutase enolase pyruvate kinase pyruvate dehydro-genase PEP carboxylase phosphoglucomutase glucose-1-phosphate adenyltransferase ribose-phosphate pyrophosphokinase glycerol-3-phosphate dehydrogenase serine synthesis synthesis1 synthesis2 DAHP synthases glucose-6-phosphate dehy-drogenase 6-phosphogluconate dehydrogenase ribulose-phosphate epi-merase ribose-phosphate isomerase transketolase A transketolase B transaldolase mureine synthesis tryptophan synthesis methionine synthesis
Metabolites g6p f6p fdp gap dhap pgp 3pg 2pg pep pyr 6pg ribu5p xyl5p sed7p rib5p e4p g1p accoa glc
glucose-6-phosphate fructose-6-phosphate fructose-1,6-bisphosphate glyceraldehydes-3-phosphate dihydroxyacetonephosphate 1,3-diphosphoglycerate 3-phospho-glycerate 2-phospho-glycerate phosphoenolpyruvate pyruvate 6-phosphogluconate ribulose-5-phosphate xylulose-5-phosphate sedoheptulose-7-phosphate ribose-5-phosphate erythrose-4-phosphate glucose-1-phosphate aaloacetate glucose
Acknowledgment The authors gratefully acknowledge funding source DOE (DE-FG02-05ER25684).
Biotechnol. Prog., 2006, Vol. 22, No. 6
1516 Supporting Information Available: All relevant MATLAB files. This material is available free of charge via the Internet at http://pubs.acs.org.
References and Notes (1) Gombert, A. K.; Nielsen, J. Mathematical modelling of metabolism. Curr. Opin. Biotechnol. 2000, 11 (2), 180-186. (2) Schilling, C. H.; Covert, M. W.; Famili, I.; Church, G. M.; Edwards, J. S.; Palsson, B. O. Genome-scale metabolic model of Helicobacter pylori 26695. J. Bacteriol. 2002, 184 (16), 4582-4593. (3) Reed, J. L.; Vo, T. D.; Schilling, C. H.; Palsson, B. O. An expanded genome-scale model of Escherichia coli K-12 (iJR904 GSM/GPR). Genome Biol. 2003, 4 (9), R54. (4) Duarte, N. C.; Herrgard, M. J.; Palsson, B. O. Reconstruction and validation of Saccharomyces cereVisiae iND750, a fully compartmentalized genome-scale metabolic model. Genome Res. 2004, 14 (7), 1298-1309. (5) Forster, J.; Famili, I.; Fu, P.; Palsson, B. O.; Nielsen, J. Genomescale reconstruction of the Saccharomyces cereVisiae metabolic network. Genome Res. 2003, 13 (2), 244-253. (6) Van Dien, S. J.; Lidstrom, M. E. Stoichiometric model for evaluating the metabolic capabilities of the facultative methylotroph Methylobacterium extorquens AM1, with application to reconstruction of C(3) and C(4) metabolism. Biotechnol. Bioeng. 2002, 78 (3), 296-312. (7) Schilling, C. H.; Edwards, J. S.; Palsson, B. O. Toward metabolic phenomics: Analysis of genomic data using flux balances. Biotechnol. Prog. 1999, 15 (3), 288-295. (8) Segre, D.; Vitkup, D.; Church, G. M. Analysis of optimality in natural and perturbed metabolic networks. Proc. Natl. Acad. Sci. U.S.A. 2002, 99 (23), 15112-15117. (9) Shlomi, T.; Berkman, O.; Ruppin, E.; Regulatory on/off minimization of metabolic flux changes after genetic perturbations. Proc. Natl. Acad. Sci. U.S.A. 2005, 102 (21), 7695-7700. (10) Pharkya, P.; Dasika, M.; Kumar, V. S.; Veeraghavan, N.; Suthers, P.; Burgard, A.; Maranas, C. D. Development of Computational tools for Analyzing and Redesigning Biological Networks. In Proc. of Genomics: GTL Contractor-Grantee Workshop IV 2006, 125-126. (11) Alper, H.; Jin, Y. S.; Moxley, J. F.; Stephanopoulos, G. Identifying gene targets for the metabolic engineering of lycopene biosynthesis in Escherichia coli. Metab. Eng. 2005, 7 (3), 155-164. (12) Cox, S. J.; Levanon, S. S.; Sanchez, A.; Lin, H.; Peercy, B.; Bennett, G. N.; San, K. Y. Development of a metabolic network design and optimization framework incorporating implementation constraints: A succinate production case study. Metab. Eng. 2006, 8 (1), 46-57. (13) Pramanik, J.; Keasling, J. D. Stoichiometric model of Escherichia coli metabolism: Incorporation of growth-rate dependent biomass composition and mechanistic energy requirements. Biotechnol. Bioeng. 1997, 56 (4), 398-421. (14) Fong, S. S.; Burgard, A. P.; Herring, C. D.; Knight, E. M.; Blattner, F. R.; Maranas, C. D.; Palsson, B. O. In silico design and adaptative evolution of E. coli for production of lactic acid. Biotechnol. Bioeng. 2005, 91 (5), 643-648. (15) Beard, D. A.; Liang, S. D.; Qian, H. Energy balance for analysis of complex metabolic networks. Biophys. J. 2002, 83 (1), 7986. (16) Qian, H.; Beard, D. A. Thermodynamics of stoichiometric biochemical networks in living systems far from equilibrium. Biophys. Chem. 2005, 114 (2-3), 213-20. (17) Covert, M. W.; Palsson, B. O. Transcriptional regulation in constraints-based metabolic models of Escherichia coli. J. Biol. Chem. 2002, 277 (31), 28058-28064. (18) Covert, M. W.; Palsson, B. O. Constraints-based models: Regulation of gene expression reduces the steady-state solution space. J. Theor. Biol. 2003, 221 (3), 309-325. (19) Mahadevan, R.; Edwards, J. S.; Doyle, F. J., III, Dynamic flux balance analysis of diauxic growth in Escherichia coli. Biophys. J. 2002, 83 (3), 1331-1340. (20) Gadkar, K. G.; Doyle, F. J., III; Edwards, J. S.; Mahadevan, R. Estimating optimal profiles of genetic alterations using constraintbased models. Biotechnol. Bioeng. 2005, 89 (2), 243-251.
(21) Burgard, A. P.; Pharkya, P.; Maranas, C. D. Optknock: A bilevel programming framework for identifying gene knockout strategies for microbial strain optimization. Biotechnol. Bioeng. 2003, 84 (6), 647-657. (22) Pharkya, P.; Maranas, C. D. An optimization framework for identifying reaction activation/inhibition or elimination candidates for overproduction in microbial systems. Metab. Eng. 2006, 8 (1), 1-13. (23) Hynne, F.; Dano, S.; Sorensen, P. G. Full-scale model of glycolysis in Saccharomyces cereVisiae. Biophys. Chem. 2001, 94 (1-2.), 121163. (24) Chassagnole, C.; Noisommit-Rizzi, N.; Schmid, J. W.; Mauch, K.; Reuss, M. Dynamic modeling of the central carbon metabolism of Escherichia coli. Biotechnol. Bioeng. 2002, 79 (1), 53-73. (25) Hoefnagel, M. H.; Starrenburg, M. J.; Martens, D. E.; Hugenholtz, J.; Kleerebezem, M.; Van Swam, I. I.; Bongers, R.; Westerhoff, H. V.; Snoep, J. L. Metabolic engineering of lactic acid bacteria, the combined approach: Kinetic modelling, metabolic control and experimental analysis. Microbiol. 2002, 148 (Pt 4), 1003-13. (26) Bruggeman, F. J.; Boogerd, F. C.; Westerhoff, H. V. The multifarious short-term regulation of ammonium assimilation of Escherichia coli: dissection using an in silico replica. FEBS J. 2005, 272 (8), 1965-1985. (27) Heijnen, J. J. Approximative kinetic formats used in metabolic network modeling. Biotechnol. Bioeng. 2005, 91 (5), 534-545. (28) Kacser, H.; Burns, J. A. The control of flux. Symp. Soc. Exp. Biol. 1973, 27, 65-104. (29) Heinrich, R.; Rapoport, S. M.; Rapoport, T. A. Metabolicregulation and mathematical-models. Prog. Biophys. Mol. Biol. 1977, 32 (1), 1-82. (30) Hatzimanikatis, V.; Floudas, C. A.; Bailey, J. E. Analysis and design of metabolic reaction networks via mixed-integer linear optimization. AIChE J. 1996, 42 (5), 1277-1292. (31) Savageau, M. A. Biochemical System Analysis; AddisonWesley: Reading, MA, 1976. (32) Hernandez-Bermejo, B.; Fairen, V.; Sorribas, A. Power-law modeling based on least-squares minimization criteria. Math. Biosci. 1999, 161 (1-2), 83-94. (33) Voit, E. O. Computational Analysis of Biochemical Systems: A Practical Guide for Biochemists and Molecular Biologists; Cambridge University Press: Cambridge, 2000. (34) Voit, E. O.; Savageau, M. A. Accuracy of alternative representations for integrated biochemical systems. Biochemistry 1987, 26 (21), 6869-6880. (35) Nielsen, J. Metabolic control analysis of biochemical pathways based on a thermokinetic description of reaction rates. Biochem. J. 1997, 321 (Pt 1), 133-138. (36) Visser, D.; Heijnen, J. J. Dynamic simulation and metabolic redesign of a branched pathway using linlog kinetics. Metab. Eng. 2003, 5 (3), 164-176. (37) Varner, J. D. Large-scale prediction of phenotype: Concept. Biotechnol. Bioeng. 2000, 69 (6), 664-678. (38) Hatzimanikatis, V.; Bailey, J. E. Effects of spatiotemporal variations on metabolic control: Approximate analysis using (log)linear kinetic models. Biotechnol. Bioeng. 1997, 54 (2), 91-104. (39) Mendes, P.; Kell, D. Non-linear optimization of biochemical pathways: Applications to metabolic engineering and parameter estimation. Bioinformatics 1998, 14 (10), 869-883. (40) Visser, D.; Schmid, J. W.; Mauch, K.; Reuss, M.; Heijnen, J. J. Optimal re-design of primary metabolism in Escherichia coli using linlog kinetics. Metab. Eng. 2004, 6 (4), 378-390. (41) Schmid, J. W.; Mauch, K.; Reuss, M.; Gilles, E. D.; Kremling, A. Metabolic design based on a coupled gene expression-metabolic network model of tryptophan production in Escherichia coli. Metab. Eng. 2004, 6 (4), 364-377. (42) Dean, J. P.; Dervakos, G. A. Design of process-compatible biological agents. Comput. Chem. Eng. 1996, 20, S67-S72. (43) Dean, J. P.; Dervakos, G. A. Redesigning metabolic networks using mathematical programming. Biotechnol. Bioeng. 1998, 58 (23), 267-271. (44) Sahinidis, N. V. BARON: A general purpose global optimization software package. J. Global Optim. 1996, 8 (2), 201-205. (45) Viswanathan, J.; Grossmann, I. E. A Combined penalty-function and outer-approximation method for Minlp optimization. Comput. Chem. Eng. 1990, 14 (7), 769-782.
Biotechnol. Prog., 2006, Vol. 22, No. 6 (46) Brooke, A.; Kendrick, D.; Meeraus, A.; Raman, R. GAMS-A user’s guide; 1998; www.gams.com. (47) Weisstein, E. W. Lagrange Expansion. MathWorld-A Wolfram Web Resource; http://mathworld.wolfram.com/LagrangeExpansion. html. (48) Peters-Wendisch, P.; Stolz, M.; Etterich, H.; Kennerknecht, N.; Sahm, H.; Eggeling, L. Metabolic Engineering of Corynebacterium glutamicum for L-serine production. Appl. EnViron. Microbiol. 2005, 71 (11), 7139-7144.
1517 (49) The Hybrid Systems Group; http://control.ee.ethz.ch/∼hybrid/ cplexint.php. (50) Pharkya, P.; Burgard, A. P.; Maranas, C. D. Exploring the overproduction of amino acids using the bilevel optimization framework OptKnock. Biotechnol. Bioeng. 2003, 84 (7), 887-899. (51) Ikeda, M. Amino acid production processes. AdV Biochem. Eng. Biotechnol. 2003, 79, 1-35. Received May 23, 2006. Accepted September 18, 2006. BP060156O