ods. We begin by briefly reviewing the branch and bound algorithm for solving a mixed integer program using linear programming relaxations. In Section 2, we ...
A Computational Study of Search Strategies for Mixed Integer Programming J. T. Linderoth M.W.P. Savelsbergh
School of Industrial and Systems Engineering Georgia Institute of Technology Atlanta, GA 30332-0205, U.S.A.
Abstract
The branch and bound procedure for solving mixed integer programming (MIP) problems using linear programming relaxations has been used with great success for decades. Over the years, a variety of researchers have studied ways of making the basic algorithm more e�ective. Breakthroughs in the �elds of computer hardware, computer software, and mathematics have led to increasing success at solving larger and larger MIP instances. The goal of this paper is to survey many of the results regarding branch and bound search strategies and evaluate them again in light of the other advances that have taken place over the years. In addition, novel search strategies are presented and shown to often perform better than those currently used in practice.
October 1997 The e�ectiveness of the branch and bound procedure for solving mixed integer programming (MIP) problems using linear programming relaxations is well documented. After the introduction of this procedure in the 1960's 26] 10] 4], researchers in the 1970's examined strategies for searching the branch and bound tree in an e�cient manner 5] 16] 28] 7] 14] 15]. With a few exceptions, (notably 30] and 19]) research in past decades has strayed from developing and examining e�ective search techniques and instead focused on improving the bound obtained by the linear programming relaxation 9] 33] 34]. The goal of this paper is to reexamine search techniques in light of the many advances made in the �eld over the years. One major change over the past decades is in the hardware on which MIPs are solved. Computers of today are orders of magnitudes faster than their counterparts of yesteryear, allowing us to expend more computational e�ort in the solution of a MIP instance. Furthermore, computers of today are equipped with a great deal more memory than in the past, so a search strategy designed to limit memory size may not be of much use today. A second change since the 1970's is in the theory behind solving MIPs. In the 1980's, the usefulness of combining cutting planes and branch and bound was demonstrated. All industrial strength MIP codes now contain some sort of cut generation in addition to branch and bound. Dramatic improvements in the simplex algorithm have also been made which allow for fast reoptimization of an LP, regardless of the change 1
in LP-relaxation from one node to the next. Also, most MIP codes now use a heuristic method to attempt to �nd feasible solutions. Each of these practical and theoretical improvements impacts the e�ectiveness of a particular strategy for searching the branch and bound tree. What advances in the future will allow researchers to solve larger MIP instances? Undoubtedly, theoretical advancements will continue to have a major impact. Another major impact will come from implementing the current branch and bound algorithms on parallel computers. In a wide range of �elds, the introduction of parallel computers consisting of many microprocessors has made possible the solutions of problems impossible to consider solving on a single processor. Many researchers have studied the e�ects, both good and bad, of dividing the search space for an optimization problem among many processors 24] 23] 37]. Key to achieving an e�ective algorithm on parallel computers is an e�ective means for exploring the search space. Further, in a parallel environment, information found on one processor may be useful in guiding the search on a di�erent processor. Sharing information on a distributed memory architecture requires that a message be passed, for which some overhead is incurred. It therefore is useful to know what types of information are especially useful for guiding the search and how much of this information must be gathered and shared. This is yet another motivation for restudying search strategies for MIP. The purpose of this paper is two-fold { to survey existing ideas for searching the branch and bound tree and to o�er some new techniques for performing the search. Extensive computational experiments will be presented comparing the old and new methods. We begin by brie�y reviewing the branch and bound algorithm for solving a mixed integer program using linear programming relaxations. In Section 2, we discuss and compare various \branching rules", or methods of subdividing the search space. In Section 3 di�erent \node selection schemes", or search-ordering methods, are presented and compared. Finally, in Section 4 we draw some conclusions from our work and give some directions for future research.
1 LP-Based Branch and Bound. A mixed integer program (MIP) can be stated mathematically as follows: Maximize z
M IP
subject to
X j
2I
=
X j
2I
a x + ij
cx + j
X
j
j
X
j
j
2C
j
j
a x � b i = 1� : : :m ij
2C
j
l �x �u x 2Z x 2< j
cx
j
j
j
j
i
j2N j2I j 2 C�
where I is the set of integer variables, C is the set of continuous variables, and N = I � C . The lower and upper bounds l and u may take on the values of plus or minus in�nity. The term \branch and bound" was originally coined by Little et al. 27] in their study of such an algorithm to solve the traveling salesman problem. However, the idea of j
j
2
using a branch and bound algorithm for integer programming using linear programming relaxations was proposed somewhat earlier by Land and Doig 26]. The process involves keeping a list of linear programming problems obtained by relaxing some or all of the integer requirements on the variables x , j 2 I . To precisely de�ne the algorithm, let us make a few de�nitions. We use the term node or subproblem to denote the problem associated with a certain portion of the feasible region of MIP. De�ne z to be a lower bound on the value of z . For a node N , let z be an upper bound on the value that z can have in N . The list L of problems that must still be solved is called the active set. Denote the optimal solution by x� . Algorithm 1 is an LP-based branch and bound algorithm for solving MIP. j
L
i
M IP
i U
i
M IP
Algorithm 1 The Branch and Bound Algorithm 0. Initialize. L = MIP. z = ;1. x� = �. 1. Terminate? Is L = �? If so, the solution x� is optimal. 2. Select. Choose and delete a problem N from L. 3. Evaluate. L
i
Solve the LP relaxation of N . If the problem is infeasible, go to step 1, else let z be its objective function value and x be its solution. i
i
i
4. Prune. If z � z , go to step 1. If x is fractional, go to step 5, else let z = z , x� = x , and delete from L all problems with z � z . Go to step 1. 5. Divide. Divide the feasible region of N into a number of smaller feasible regions N 1� N 2� : : :� N such that � =1 N = N . For each j = 1� 2� : : :� k, let z = z and add the problem N to L. Go to 1. LP
i LP
i
L
L
j
i
U
i LP
L
i
i
ij
U
i
ik
i LP
k j
ij
i
ij
The description makes it clear that there are various choices to be made during the course of the algorithm. Namely, how do we select which subproblem to evaluate, and how do we divide the feasible region. A partial answer to these two questions will be provided in the next two sections. When answering these questions, our main focus will be to build robust strategies that work well on a wide variety of problems.
2 Problem Division Since our algorithm is based on linear programming relaxations, we need to enforce linear constraints to divide the current feasible region as required in step (5) of Algorithm 1. However, adding constraints to the linear programming formulation leads to the undesirable result of increasing the size of the linear program that must be solved as we progress. A more e�cient way to divide the region is to change the bounds on variables. In the following sections, we present the two most common (and obvious) schemes for partitioning the feasible region by changing variables' bounds. 3
2.1 Variable Dichotomy
For MIP, the obvious way to divide the feasible region of N is to choose a variable j that has fractional value x in the solution to the LP relaxation of N and impose the new bounds of x � bx c to de�ne one subregion and x � dx e to de�ne another subregion. We call this branching on a variable dichotomy, or simply branching on a variable. If there are many fractional variables in the solution to the LP relaxation of N , we must choose one variable to de�ne the division. Because the e�ectiveness of the branch and bound method strongly depends on how quickly the upper and lower bounds converge, we would like to branch on a variable that will improve these bounds. It seems di�cult to select a branching variable that will a�ect the lower bound. Doing this amounts to heuristically �nding feasible solutions to MIP and is very problem speci�c. However, there are ways to attempt to predict which fractional variables will most improve the upper bound when required to be integral. These prediction methods fall into two general categories. The �rst category includes methods that attempt to estimate the change (or degradation) of the objective function value and the second category includes those that provide a lower bound on the degradation of the objective function value. i
i j
i
i j
j
i j
j
i
2.1.1 Estimation Methods
Estimation methods work as follows: with each integer variable x , we associate two quantities P ; and P + that attempt to measure the per unit decrease in objective function value if we �x x to its rounded down value and rounded up value, respectively. Suppose that x = bx c + f , with f > 0. Then by branching on x , we will estimate a decrease of D ; = P ; f on the down branch of node i and a decrease of D + = P + (1 ; f ) on the up branch of node i. B�enichou et al. 5] call the values P ; and P + down and up pseudocosts. One way to obtain values for P ; and P + is to simply use the observed degradation in objective function value. Let N ; and N + denote the nodes for the down and up branches of node N , then compute the pseudocosts as j
j
j
j
i j
i j
i
j
j
i j
i j
j
i
i j
j
j
j
j
i j
j
j
i
i
i
; P ; = z f; z i
LP
j
i j
i LP
and
+ P + = z 1 ;;fz : i
LP
j
i LP
i j
Two more questions need to be answered before we can implement a branching scheme based on pseudocosts: To what value should the pseudocosts be initialized? How should the pseudocosts be updated from one branch to the next? The question of initialization is an important one. By the very nature of the branch and bound process, the branching decisions made at the top of the tree are the most crucial. As pointed out by Forrest et al. 14], if at the root node we branch on a variable that has little or no e�ect on the LP solution at subsequent nodes, we have essentially doubled the total amount of work required. An obvious method for initialization is to simply let the pseudocosts for a variable be the value of its objective function coe�cient, since if a variable were unrelated to the 4
other variables in the problem, its pseudocost would be precisely its objective function coe�cient. B�enichou et al. 5] and Gauthier and Ribi�ere 15] experimented with explicitly computing the pseudocosts of each variable. They report that doing so can be e�ective in reducing the number of nodes evaluated, but that the time spent computing these values explicitly is signi�cant. In fact, Gauthier and Ribi�ere conclude that the computational e�ort is too signi�cant compared to the bene�t obtained. Even though today's situation may be slightly di�erent, due to faster computers and better LP solvers, it clearly indicates that care has to be taken when pseudocosts are explicitly computed for each variable. In doing our experiments, we noted that often only a small percentage of the integer variables are ever fractional in the solution to the linear programming relaxation and an even smaller percentage of integer variables are ever branched on. Therefore, if pseudocosts are going to be explicitly computed, then they should be computed only for the fractional variables as needed. Yet another alternative, suggested by Eckstein 13], keeps track of the average value of the pseudocost on the up and down branches. For each variable that has yet to be arbitrated, the pseudocosts are set to these average values. This method has the disadvantage that variables not yet branched on are ranked in importance only by how fractional they are. In the course of the solution process, the variable x may be branched on many times. How should the pseudocosts be updated from one branch to the next? B�enichou et al. 5] state that the pseudocosts vary little throughout the branch and bound tree, and suggest �xing P ; and P + to the values observed the �rst time when variable x is branched on. Alternatively, as suggested in Forrest et al. 14], one could also �x the pseudocosts to the values obtained from the last time when x was branched on. Forrest et al. 14] and Eckstein 13] suggest averaging the values from all x branches. We performed an experiment to verify the observations of B�enichou et al. 5], i.e., that the pseudocosts are relatively constant throughout the branch and bound tree. Suppose the (either up or down) pseudocost P is some linear function of the number of times N variable x is branched on. We can express this relationship as j
j
j
j
j
j
j
j
j
P = �0 + �1N : j
j
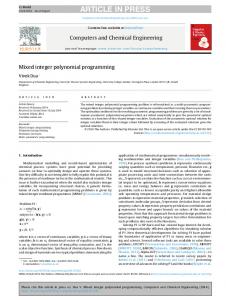
For our suite of 14 problems from MIPLIB, we explicitly computed the regression coe�cients �0 and �1 for each variable and direction on which we chose to branch more than seven times. This gave us 693 variable-direction pairs. For these 693, zero was in the 95% con�dence interval of the regression coe�cient �1 673 times, which would imply there was statistical reason to believe that the pseudocosts are constant throughout the branch and bound tree for these variable-direction pairs. However, we also observed that from node to node, pseudocosts can vary signi�cantly. In Figure 2.1, we plot the observed pseudocosts as a function of the number of times we branch on a speci�c variable. Therefore, we believe that updating the pseudocosts by averaging the observations should be the most e�ective. The issues of initialization of pseudocosts and updating of pseudocosts are unrelated. Generally once a variable is branched on the initial pseudocost value is discarded and 5
220
200
Calculated Pseudocost
180
160
140
120
100
80
60 0
100
200
300
400 500 600 Number of Branches
700
800
900
1000
Figure 2.1: Observed Pseudocosts as a Function of Number of Branches. Problem pp08a. Variable 219. replaced by the true (observed) pseudocost. Therefore, we will deal with the initialization and update issues separately. Throughout the course of the paper, we will be introducing experiments aimed at establishing the e�ectiveness of di�erent search strategy techniques for mixed integer programming. The techniques under investigation were incorporated into the mixed integer optimizer MINTO (v2.0) 29]. Since one of the main focuses of the paper is to establish how search strategies interact with new, sophisticated, integer programming techniques, we have used the advanced features MINTO has to o�er in performing the experiments. These features include preprocessing and probing, automatic cut generation, reduced cost �xing, and row management. We have chosen to perform a majority of the testing on a suite of 14 problems from the newest version of MIPLIB 6]. The instances were chosen more or less at random, but exhibit a wide range of problem characteristics. Unless otherwise noted, all experiments were run with the settings shown in Table 2.1. Other characteristics about the experiments will be mentioned as needed.
Code compiled with the IBM XLC compiler, optimization level -O2. Code run on an RS/6000 Model 590. CPU time limited to one hour. Memory limited to 100mb. Table 2.1: Characteristics of All Computational Experiments We now describe an experiment that aims at establishing the best pseudocost ini6
tialization method. Since determining the best initialization method is our goal here, we have �xed the updating method in these runs to be the averaging suggestion. We branch on the variable x for which D ; + D + is the largest. This choice will be discussed in more detail in Section 2.1.4. As previously stated, the main focus of choosing a branching variable is to choose one that will most improve the upper bound of the child nodes from the parent. By setting z to the value of the optimal solution to the problem in our computational experiments, we minimize factors other than branching that determine the size of the branch and bound tree. For example, the node selection rule has no e�ect on the size of the branch and bound tree. Just for completeness, we mention that we use the \best bound" node selection rule, where at the Select portion of the branch and bound algorithm, we choose to evaluate the active node with the largest value of z . In our tables of computational results, the \Final Gap" is computed as Final Gap max 2L z ; z � j
i
i
j
j
L
i U
i
z
i U
L
L
and a \XXX" in the solution time column signi�es that the memory limit was reached. For many experiments, we will be including summary tables that rank the performance of the techniques under investigation. We rank techniques related to branching methods as follows: A method that proves the optimality of the solution is ranked higher than one that does not. If two methods prove the optimality of the solution, the one with shorter computation time is ranked higher. If two methods do not prove the optimality of the solution, the one with smaller �nal gap is ranked higher. Ties are allowed. Table A.1 in Appendix A shows the results of solving various problems using four pseudocost initialization methods. A summary of the experiment is given in Table 2.2. The pseudocosts were initialized with objective function coe�cients, by averaging observations, by explicitly computing them for all variables at the root node, and explicitly computing them for the fractional variables only as needed. Initalization Method Avg. Ranking Obj. Coef. 2.93 Averaged 3.07 Computed All 2.50 Computed Fractional 1.50 Table 2.2: Summary of Pseudocost Initialization Experiment. Examination of the results shows that explicitly computing initial pseudocosts for fractional variables as needed is clearly the best method. This result is di�erent than 7
the conclusion reached by Gauthier and Ribi�ere 15]. The faster simplex algorithm and computers of today now make it possible to invest more e�ort into the (often very important) initial branching decisions. We conclude that a good pseudocost initialization strategy should allow for initially explicitly computing pseudocosts, take care not to expend too much computation time accomplishing this task, and allow for spending more time computing explicit pseudocosts at the top of the branch and bound tree where branching decisions are more crucial. After further experimentation, we adopted the following pseudocost initialization strategy. Let T be the maximum amount of time per node we would like to spend to initialize pseudocosts for variables on which we have yet to branch. In this time, we wish to gain useful branching information on all fractional variables. We therefore impose a limit L on the number of simplex iterations used in solving the linear program necessary to compute one particular pseudocost. Let � be an estimate of the number of simplex iterations performed per unit time, obtained by needed to solve the initial LP : � Number of iterations Time to solve the initial LP Let � be the number of fractional variables in initial LP solution. Then we compute L as L = T� 2� :
As we develop the branch and bound tree, if there is a fractional variable x upon which we have never branched, we perform L simplex pivots after �xing the bounds of this variable to bx c and dx e in order to explicitly determine the pseudocosts. Gauthier and Ribi�ere 15] also proposed a pseudocost initialization strategy that uses a limited number of simplex iterations, but our approach is fundamentally di�erent. They purposely limit the number of simplex iterations to a small number, while we set T to a large number hoping to be able to compute a \true" pseudocost. T is two minutes in the current implementation. We now turn our attention to the question of how to update the pseudocosts from one branch to the next. As mentioned above, our initial experiments lead us to believe that updating the pseudocosts by averaging the observations would be the most computationally e�ective. We empirically veri�ed this conjecture by solving instances of MIPLIB where the pseudocosts were updated in each of the three ways suggested. For these runs we have initialized the pseudocosts by our strategy that explicitly computes them, with a limit on the number of iterations used. As in our previous experiment, we branch on the variable x for which D ; + D + is the largest, set z to be the known optimal solution to the problem, and we use the best bound node selection rule. Table A.2 shows the full results of this experiment. For the pseudocost update experiment, Table 2.3 shows the average ranking over all the instances of each method. From the results of the experiment we see that our intuition is correct. For the most part, it seems to be best to average the degradations when branching on a variable to determine its pseudocosts, and the overhead necessary to perform the averaging does not outweigh its bene�ts. j
j
j
j
i
i
j
j
L
8
Update Method Avg. Ranking First 2.43 Last 1.64 Average 1.43 Table 2.3: Summary of Pseudocost Update Experiment. In distributed memory parallel computer architectures, the overhead necessary to perform true averaging of pseudocosts increases dramatically, since di�erent processors calculate di�erent nodes (and hence di�erent pseudocosts). The fact that the \Last" updating technique is not signi�cantly outperformed by the \Average" updating technique leads us to believe that true averaging may not be necessary for computational e�ectiveness on parallel architectures. For the remainder of this paper, when we refer to pseudocost branching, this will imply that we have used our strategy of explicitly computing the initial pseudocosts with a simplex iteration limit, and we update the pseudocosts by averaging the observations.
2.1.2 Lower Bounding Methods Branching strategies that provide a lower bound on the objective function degradation work much the same way as estimation strategies. For each variable, we �nd quantities L; and L+ that provide lower bounds on the decrease in objective function value if we branch down and up on variable x . This idea originated with the work of Dakin 10], Healy 21], and Davis et al. 11]. Driebeek 12] shows how to compute values for L; and L+ by implicitly performing one dual simplex pivot. Breu and Burdet provide computational evidence that lower bounding methods can be bene�cial 7], however branching methods based on simple lower bound calculations have fallen out of favor in recent years 2] 14]. As Beale states in 2], \the fact remains that practical problems tend to have several nonbasic variables with zero reduced costs, when these methods are largely useless." Over the years since Beale made this statement, much work has been done in the area of generating strong valid inequalities for MIP and incorporating these inequalities into a branch and cut scheme 9] 17] 31] 33]. With the advent of these sophisticated cutting planes, one may suspect to have fewer nonbasic variables with zero reduced cost. The rationale for this statement is as follows. Non-basic variables with zero reduced cost correspond to alternative optimal solutions to the linear programming relaxation. Cutting planes meant to separate a fractional LP solution from the convex hull of integer points may also separate alternative LP-optimal solutions. Figure 2.2 graphically depicts this phenomenon in two dimensions. We also empirically veri�ed this observation by determining the percentage of nodes where a non-zero lower bound on the degradation is found when cuts are added or not added to the formulation. Table A.3 shows the percentage of the �rst 250 nodes of the branch and bound tree that have useful dual estimates when both cuts are added and not added to the formulation. This experiment was run on all the problems of MIPLIB, but only the instances where the di�erence in percentage is greater than 4% are reported. For this experiment, we used the lower j
j
j
j
j
9
bound obtained from implicitly performing one dual simplex pivot. The results indicate that somewhat more non-zero estimates are obtained with cutting planes, but there are no dramatic improvements.
Objective Function Countour Cutting plane
Figure 2.2: A Valid Inequality That Cuts O� Alternative Optimal Solutions One may make the argument that since rows are being added to the linear programming formulation, it is likely that a greater number of dual simplex pivots are required for the child node to satisfy the bound we have imposed. Hence, the lower bound obtained by implicitly performing one dual simplex pivot bears less relation to the true degradation. However, we will show that the lower bounds obtained in this fashion can be useful in determining a branching variable. Instead of implicitly performing one dual simplex pivot, a number of actual dual simplex pivots can be performed for each variable. The change in objective function again provides a lower bound on the true degradation. A strategy similar to this is what Applegate et al. 1] call strong branching. Strong branching selects a set of \good" variables on which one may choose to branch and performs a number of dual simplex pivots on each variable in this set. Strong branching has been shown to be an e�ective branching rule for large set partitioning problems, traveling salesman problems, and some general integer programs 1] 8]. The idea of performing multiple dual simplex pivots is closely related to the pseudocost initialization idea we propose. However, there are two main di�erences. For pseudocost initialization, the dual simplex pivots are performed only once for each variable, regardless of how many times the variable was branched on. Further, for pseudocost initialization, a large number of pivots are performed in the hope of completely resolving the problem. Tomlin 36] has shown that Driebeek's lower bounding method, i.e., implicitly performing one dual simplex pivot, can be improved by taking into account the integrality 10
of the nonbasic variables. In that case, the quantities L; and L+ no longer provide lower bounds on the degradation of the objective function with respect to the optimal value of the LP relaxation at the child node, but on the degradation of the objective function with respect to the optimal value of the IP at the child node. Tomlin has also observed that these lower bounds are dominated by bounds derived from Gomory cuts. Recently, G"unl"uk 18] has proposed another extension of the Driebeek's lower bounding, which he calls knapsack branching. Knapsack branching is similar to the penalty improvement idea of Tomlin 36], since both methods take into account the integrality of the non-basic variables. However, knapsack branching takes the integrality into account in a more involved way. In order to determine the value L; or L+ , a knapsack problem must be solved. G"unl"uk also suggests a method for solving the knapsack problems e�ciently. We solved some MIPLIB instances using the various lower bounding methods in order to compare performance. The lower bounding branching methods we chose to compare were to perform one dual simplex pivot on all fractional variables, 10 dual simplex pivots on all fractional variables, 25 dual simplex pivots on a subset of the fractional variables (i.e. strong branching), and knapsack branching. To determine the subset I 0 � I of variables on which to perform 25 dual simplex pivots, we used the following strategy. Given a fractional LP solution, let L = maxff : f � 0:5� j 2 I g and U = minff : f � 0:5� j 2 I g. We chose j
j
j
j
j
j
j
j
I 0 fj 2 I : 0:8L � f � U + 0:2(1 ; U )g:
(2.1)
j
For each of the lower bounding methods, we branched on the variable x for which L+ + L; was the largest. If L+ + L; = 0 8x 2 I , then we chose to branch on the fractional variable x 2 I 0 with largest objective function coe�cient. We used the best bound node selection rule. Table 2.4 shows a summary and Table A.4 shows the full results of our experiment. j
j
j
j
j
j
j
Branching Rule Avg. Ranking 1 pivot (all) 1.64 10 pivots (all) 2.79 Strong 3.14 Knapsack 2.36 Table 2.4: Summary of Computational Results Using Lower Bound Based Branching Rules. From the tables we make the following observations: It is in general too costly to perform 10 dual simplex pivots on all fractional variables. Strong branching can be highly e�ective on some problems, but the e�ectiveness is impacted greatly by the ability to select a suitable subset of variables on which to perform a number of dual simplex pivots. 11
Performing one dual simplex pivots seems to be the best, which is a somewhat surprising result.
2.1.3 Combining Estimates and Lower Bounds Getting lower bounding estimates on the degradation by performing one or more dual simplex pivots can be an expensive operation, but it gives us insight as to how the objective function value will change when branching on a variable given the current formulation at a node. We consider this \local" branching information. In contrast, pseudocost information is more \global" since these values are averages of observations taken throughout the branch and bound tree. We want to consider combining this local and global branching information in some way. Speci�cally, we wish to estimate the true (up or down) degradation when branching on a variable x as D^ = �0 + �1D + �2L � (2.2) D is the degradation measure taken from pseudocosts, and L is a lower bound on the degradation. Since we only use these estimates D^ to rank the variables, the parameter �0 is of no importance to us. The weights �1 and �2 could be chosen a priori, but de�ning the estimate in this way gives us the opportunity to create a dynamic branching scheme by altering these parameters as the search progresses. Given that we have evaluated n nodes, we do a regression to �nd the parameters �1 and �2 that give the best linear �t of the degradation D^ as a function of the pseudocost degradation D and lower bound on the degradation L . Doing a full regression at every node of the branch and bound tree may be too computationally expensive, but updating a regression from one observation to the next is relatively easy. The parameters �1 and �2 can be obtained from the solution to the linear system 2 32 3 2 P^ 3 P P n D L � 0 P D^ 7 64 P D P(D )2 P D L 7 6 7 6 � = (2.3) P D 5� 5 4 5 4 1 P P P 2 P ^ L DL (L ) �2 LD j
j
j
j
j
j
j
j
j
i
i
i
i
i
i
i
i
i
i
i
i
i
i
i
where the superscript on D, L, or D^ is meant to denote the value of this quantity at node i, regardless of which variable was branched on. This system has a closed form solution involving only a few arithmetic operations, so computing the regression parameters is not too costly. If the lower bound on the degradation or the pseudocost is zero, we do not update the regression coe�cients, because this would have the e�ect of \biasing" the coe�cients so that the importance of the lower bound L in the calculation was weighted too heavily. i
j
2.1.4 Using Degradation Estimates Once we have computed estimates or bounds on the degradation of the objective function given that we branch on a speci�c variable, we still must decide how to use this information to make our branching choice. Our goal is to maximize the di�erence in LP value of the relaxation from a parent to its children, but since there are two children of 12
each parent, there are di�erent measures of change. Gauthier et al. 15] suggest trying to maximize the sum of the degradation on both branches, i.e. branch on the variable x � with j � = arg maxfD+ + D;g or j � = arg maxfL+ + L; g: j
j
j
j
j
j
j
B�enichou et al. 5] and Beale 2] suggest instead to branch on the variable for which the smaller of the two estimated degradations is as large as possible. That is,
j � = arg maxfminfD+ � D;gg j
j
or
j
j � = arg maxfminfL+� L;gg: j
j
j
Eckstein 13] suggests combining these ideas by branching on the variable
j � = arg maxf�1 minfD+ � D;g + �2 maxfD+� D;gg j
or
j
j
(2.4)
j
j � = arg maxf�1 minfL+ � L;g + �2 maxfL+ � L; gg:
(2.5) Note that we can maximize the sum of the degradation on both branches by letting �1 = �2 = 1 in equation (2.4) or (2.5), and we can maximize the minimum degradation on both branches by letting �1 = 1, �2 = 0. Table 2.5 shows a summary of the e�ect of varying the parameters �1 and �2 for our MIPLIB test instances. The full results can be found in Table A.5. For these runs, we have computed an estimated degradation as suggested by equation (2.2) with �1 = �2 = 1. We have set z to be the known optimal solution to the problem and used the best bound node selection rule. From this experiment we draw the following conclusions about using the degradation estimates or lower bounds to choose a branching variable: j
j
j
j
L
Both the up and down degradations should be considered. The importance of a variable is more related to the smaller of the two degradations. Using (�1� �2) = (2� 1) in equation (2.4) or (2.5) appears to be a good choice.
2.1.5 Non-estimate Based Branching Rules One further branching rule of note is suggested by Padberg and Rinaldi 32] and modi�ed slightly by J"unger, Reinelt, and Thienel 22]. We call this method enhanced branching. Recall from (2.1) the set I 0 of variables on which we chose to make dual simplex pivots for strong branching. Enhanced branching chooses to branch on the variable x 2 I 0 for which the objective function coe�cient is the largest. A variation of this method is the default branching rule invoked by MINTO (v2.0) 29]. j
13
(�1� �2) Avg. Ranking (1,0) 4.71 (10,1) 2.86 (2,1) 1.86 (1,1) 2.86 (1,2) 3.64 (1,10) 4.29 Table 2.5: Summary of Computational Results On Using Degradations to Compute Branching Variables
2.1.6 Computational Results This subsection describes a comprehensive experiment to compare the e�ectiveness of various branching rules. Table 2.6 describes the branching rules we studied. We solved each instance of MIPLIB using each of these branching rules. To minimize the e�ects of factors other than branching in proving optimality of the solution, we have �xed z to be the known optimal solution to the problem. We evaluate nodes in \best bound" order. When estimates or lower bounds of the degradation are used in the branching decision, we use them by taking (�1 , �2 ) = (2,1) in the formula (2.4) or (2.5). L
Branching Method B1 B2 B3 B4 B5 B6 B7
Description Branch on variable closest to 1/2. Enhanced Branching. Determine penalties by implicitly performing one dual simplex pivot. Strengthen penalties for integer variables as suggested by Tomlin 36]. Pseudocost based branching. Use the estimates of degradation as in equation (2.2), with �1 = 1, �2 = 1. Use the estimates of degradation as in equation (2.2), and dynamically update the coe�cients �1 and �2 by solving the system (2.3). Knapsack branching.
Table 2.6: Branching Rules Investigated The instance nwo4 of MIPLIB was excluded from the runs, since it required too much memory for our machines. The instance dano3mip was also excluded from the runs since the linear program is extremely di�cult to solve { only 3 or 4 nodes can be evaluated in an hour. This left us with a test suite of 57 problem. Table A.6 shows the results of all the runs. We call a problem instance hard if not all branching methods could prove the optimality of the solution in less than two minutes. In this experiment, there were 34 \hard" instances. A summary of the experiment for the hard instances is given in 14
Table 2.7. Method B1 B2 B3 B4 B5 B6 B7
Ranking Problems Computation (Min, Avg, Max) Solved Time (sec.) ( 1, 5.77, 7 ) 8 97327 ( 1, 5.32, 7 ) 11 91323 ( 2, 4.29, 7 ) 14 78467 ( 1, 2.26, 7 ) 19 65061 ( 1, 2.41, 6 ) 19 65743 ( 1, 2.32, 5 ) 19 65625 ( 4, 4.97, 7 ) 14 79372
Table 2.7: Summary of Branching Results for all MIPLIB Instances. Based on these experiments, we make the following observations: The use of pseudocosts in an intelligent manner is essential to solve many of the problems. Combining pseudocosts with lower bounding information seems to improve the robustness of the branching method at a relatively small computational price. There is no branching method which clearly dominates the others (note that almost all methods came in last at least once), so a sophisticated MIP solver should allow many di�erent options for selecting the branching variable.
2.2 GUB Dichotomy
P
WhenPthe problem has generalized upper bound (GUB) constraints of the form 2 x = 1 (or 2 x � 1) for some T � I , another problem subdivision scheme used in practice is called branching on a GUB Dichotomy. Here,Pa subset T 0 � T for which the solution of is chosen. The constraint P the LP relaxation x at node i satis�es 0 < 2 0 x < 1 P x = 0 is enforced in one subregion, and the constraint 0 2 2 n 0 x = 0 is enforced in the other subregion. Note that these constraints can again be enforced by �xing variables' bounds. When there exists a logical ordering of the variables in the set T , this set is sometimes called a special ordered set (SOS) and hence this division method is sometimes called SOS branching. One advantage of branching on a GUB constraint instead of a variableP is that the branch and bound tree is more \balanced". Suppose we have some GUB 2 x = 1, and we choose to branch on a single variable j �. If x � is not an \important" variable, then it is likely that the set of feasible solutions for the node with x � = 0 is very nearly the same as the set of feasible solutions for the original node. In this case, we have made little progress in our search. A second advantage of branching on a GUB constraint occurs when the GUB is actually a SOS. In this case, the fractional LP solution may suggest which variable will be one in the optimal solution, and thereby demonstrate a good set T 0 on which to base the branching dichotomy. An example will make this point clear. Suppose we are j
j
T
i
j
j
T
T
j
i j
T
j
j
T
T
j
j
j
j
15
T
j
j
modeling a facility location problem in which we must decide on the size of a warehouse to build. The choices of sizes and their associated cost are shown in Table 2.8. Size Cost 10 100 20 180 40 320 60 450 80 600 Table 2.8: Warehouse sizes and costs Using binary decision variables x1� x2� : : :� x5, we can model the cost of building the warehouse as COST 100x1 + 180x2 + 320x3 + 450x4 + 600x5: The warehouse will have size SIZE 10x1 + 20x2 + 40x3 + 60x4 + 80x5� and we have the SOS constraint
x1 + x2 + x3 + x4 + x5 = 1: If a linear programming solution has x1 = 0:2 and x5 = 0:8, then it might be trying to suggest building a warehouse of size SIZE = 0:15(10) + 0:85(80) = 69:5� in which case a sensible set on which to base the branching dichotomy would be T 0 = f1� 2� 3� 4g. This means that our dichotomy is based on whether or not to build a warehouse of size 80, which the LP solution suggests might be a pro�table warehouse size. In our example, we assigned an order to the variables based on their coe�cients in the \size" constraint. In general SOS branching, constraints like the \size" constraint are termed reference rows. If the coe�cients a1� a2� : : :aj j in the reference row are ordered such that a1 � a2 � : : : � aj j, then a sensible set on which to base the branching dichotomy is X T 0 = fj : a � a x� g: T
T
j
j
The index
2T
j
j 0 arg 2minn 0fa g j
T
T
j
j
is usually called the branch point of the SOS. Generalizing pseudocosts to help determine on which GUB to branch is not entirely straightforward. One simple idea is to extend the de�nition of down and up pseudocosts
16
to apply to a GUB. Given we have chosen an appropriate subset T 0 � T on which to base our dichotomy, we can de�ne the down and up pseudocosts for this GUB to be ; P ; = zP ; zf 2 0 i
i
LP
LP
j
j
T
+ P + = 1z; P; z f : 2 0 i
i j
i LP
LP
j
j
T
i j
This pseudocost de�nition does not take into account how the dichotomy was formed. Gauthier et al. 15] suggest assigning pseudocosts for each branch point in a SOS. Beale 2] gives a \row-based" method for determining both lower bounds and an estimate on the degradation if a GUB is branched on. Tomlin 35] extends the idea of performing one implicit dual simplex pivot to a set of variables. When a problem has GUB constraints, we are faced with the question of whether to branch on a GUB or on a variable. This question has received little attention in the literature. As suggested by Beale and Forrest 3], if one uses a \row-based" method for determining estimates or lower bounds on the degradation of objective function value, then comparing the usefulness of branching on a GUB or a variable is straightforward.
2.2.1 Computational Results
If there is no logical order to the variables in a GUB and an \important enough" variable is chosen to be branched on, then the value of branching on a GUB as opposed to a variable is lessened. In Table 2.9 we show a comparison of GUB branching versus plain variable branching on the instances of MIPLIB where there is a signi�cant number of GUB constraints. In this experiment, we adopt the following GUB branching strategy. We choose to branch on the GUB containing the greatest number of fractional variables in the current LP solution x� . If there is no GUB containing at least 3 fractional variables, then we branch instead on a variable, using the adaptive combined estimate and lower bound strategy (B6). If we choose to branch on aPGUB, the set T 0 on which the dichotomy is based is chosen in such a way so as to make 2 0 x� close to 0.5. j
T
j
Table 2.9: GUB Versus Variable Branching Problem Branching Type Nodes Final Gap (%) Sol. Time(sec.) 10teams B4 641 0% 409 10teams B6 113 0% 299 10teams GUB 12813 0.758% 3600 air03 B4 3 0% 61 air03 B6 3 0% 62 air03 GUB 15 0% 66 air04 B4 155 0% 2453 air04 B6 203 0% 2674 air04 GUB 920 0.672% 3600 air05 B4 721 0% 1444 air05 B6 631 0% 1780 air05 GUB 1874 1.06% 3600 cap6000 B4 1862 7.01e-04% 3600 17
Problem Branching Type Nodes Final Gap (%) Sol. Time(sec.) cap6000 B6 1703 6.21e-04% 3600 cap6000 GUB 1864 4.44e-04% 3600 harp2 B4 12058 7.55e-06% 3600 harp2 B6 4778 1.93e-02% 3600 harp2 GUB 4120 1.85e-01% 3600 l152lav B4 469 0% 71 l152lav B6 259 0% 67 l152lav GUB 2955 0% 285 mitre B4 23 0% 162 mitre B6 23 0% 210 mitre GUB 23 0% 131 mod010 B4 19 0% 11 mod010 B6 39 0% 14 mod010 GUB 41 0% 15 p0201 B4 77 0% 6 p0201 B6 63 0% 6 p0201 GUB 73 0% 7 p0282 B4 37 0% 3 p0282 B6 37 0% 3 p0282 GUB 39 0% 4 p0548 B4 9 0% 2 p0548 B6 9 0% 2 p0548 GUB 9 0% 2 p2756 B4 13 0% 7 p2756 B6 13 0% 7 p2756 GUB 13 0% 7 The results here seem to indicate that branching on a GUB may not be as important as choosing an important variable on which to base the branching dichotomy.
3 Node Selection We now deal with the \select" portion of the branch and bound algorithm. When we make a decision to branch, we are solely concerned about maximizing the change in z between a node N and its children. In selecting a node, our purpose is twofold: to �nd good integer feasible solutions or to prove that no solution better than our current one with value z exists. Therefore, the quality of the current solution value z is an important factor in determining which node to select for evaluation. Hence also the decision of whether or not a heuristic procedure is used in order to obtain good integer feasible solutions is a factor that must be considered when choosing a node selection rule. If a heuristic procedure is used, then node selection rules that emphasize proving that no better solution exist rather than �nding improved integer feasible solutions may be preferred. Since many of the early branch and bound codes for solving MIP did not contain a heuristic as part of their solution procedure, existing ideas for node selection i LP
i
L
L
18
deserve more exploration. Here, we provide a brief survey of node selection methods. We categorize the node selection methods as static methods, estimate-based methods, twophase methods, and backtracking methods. In addition, we introduce a new calculation on which to base estimation methods, and we perform experiments to test the e�ectiveness of the various methods.
3.1 Static Methods
A popular way to choose which subproblem to explore is to choose the one with the largest value of z . There are theoretical reasons for making this choice, since for a �xed branching rule, selecting problems in this way minimizes the number evaluated nodes before completing the search. This node selection rule is usually called best-�rst or best-bound search. At the other extreme is a selection rule called depth-�rst search. As the name suggests, the solution space is searched in a depth �rst manner. Both these methods have inherent strengths and weaknesses. Best-�rst search will tend to minimize the number of nodes evaluated and at any point during the search is attempting to improve the global upper bound on the problem. Therefore best-�rst search concentrates on proving that no solution better than the current one exists. Memory requirements for searching the tree in a best-�rst manner may become prohibitive if good lower bounds are not found early, leading to relatively little pruning of the tree. Also, the search tree tends to be explored in a breadth-�rst fashion, so one linear program to solve has little relation to the next { leading to higher computation times. Depth-�rst search overcomes both these shortcomings of best-�rst search. In fact, searching the tree in a depth �rst manner will tend to minimize the memory requirements, and the changes in the linear program from one node to the next are minimal { usually just changing one variable's bound. Depth-�rst search has another advantage over best�rst search in �nding feasible solutions since feasible solutions tend to be found deep in the search tree. Depth-�rst search was the strategy proposed by Dakin 10] and Little et al. 27], primarily due to the small memory capabilities of computers at that time. Despite its advantages, depth �rst search can lead to extremely large search trees. This stems from the fact that we may evaluate a good many nodes that would have been fathomed had a better value of z been known. For larger problems, depth �rst search has been shown to be impractical 14]. However, this conclusion was made in the days before primal heuristics were incorporated into most MIP codes, so depth �rst search deserves to be reexamined. i U
L
3.2 Estimate-based Methods
Neither best �rst search nor depth �rst search make any intelligent attempt to select nodes that may lead to improved integer feasible solutions. What would be useful is some estimate of the value of the best feasible integer solution obtainable from a given node of the branch and bound tree. The best projection criterion, introduced by Hirst 20] and Mitra 28] and the best estimate criterion found in B�enichou et al. 5] and Forrest et al. 14], are ways to incorporate this idea into a node selection scheme. 19
The best projection method and the best estimate method di�er in how they determine an estimate of the best solution obtainable from a node. Given an estimate E , they both select the node in the active set for which this value is largest. For any node N , let s P 2 min(f � 1 ; f ) denote the sum total of its integer infeasibilities. Also, let the root node of the branch and bound tree be denoted by N 0 . The best projection criterion for node selection is to choose the node with the highest value of i
i
i
j
j
I
j
!
�
0 E = z + z s; z s : 0 L
i
i
(3.6)
i
U
U
The value = (z ; z 0 )=s0 can be thought of as the change in objective function value per unit decrease in infeasibility. Note that this method requires that there be a value of z . The estimate obtained by the best projection method does not take into account which variables are fractional or the individual costs for satisfying each variable. A natural extension of the best projection idea would be to use pseudocosts in obtaining an estimate of the value of the best solution obtainable from a node. This extension is what is known as the best estimate criterion. Here, the estimate of the best solution obtainable from a node is L
U
L
E =z + i
i U
X j
2I
min(P ; f � P + (1 ; f )): j
j
(3.7)
j
j
This estimate has the advantage that it does not require a value of z . The estimate of the best solution obtainable from a node given by (3.7) assumes that we will always be able to round a fractional variable to the closest integer and obtain a feasible integer solution, which is somewhat optimistic. A more realistic estimate would be the following: L
E =z i
i U
X
+ j
+ j
(f P ; q + (1 ; f )P + (1 ; q ))
2I :fj �0:5
X
2I :fj >0:5
j
j
j
j
j
j
(f P ; (1 ; q ) + (1 ; f )P + q )� j
j
j
j
j
j
(3.8)
where q is the \probability" that we will be able to round a fractional solution to the closest integer and obtain a feasible integer solution. Note that if q = 1 8j 2 I , then (3.8) reduces to (3.7). An obvious question is how to calculate q for a variable. Since we are using a primal heuristic to generate feasible solutions, we can get an estimate of the percentage of variables that are able to be rounded to the nearest integer. We do this by comparing a feasible integer solution x^ obtained by a primal heuristic to the fractional solution x at that node. De�ne the �ip-percentage � as � jfj 2 I : jx^ ; x j > 0:5gj : (3.9) j
j
j
j
jI j
j
Regression studies showed that � calculated as in (3.9) is approximately constant for a given problem instance over a wide range of feasible solutions. To obtain a less optimistic 20
1
1
;�
q
0 0
1 f
Figure 3.3: A graph of q . j
estimate E , we could use equation (3.8), where q = 1 ; � . A graph of q is shown in Figure 3.3. We make two modi�cations to the graph of q in order to more accurately re�ect the probability. Intuitively, fractional variables close to integer values are more likely to be able to be rounded to this value in a feasible solution. To incorporate this idea into our calculation of q , we bias the graph of q to look as in Figure 3.4. i
j
j
j
j
j
HHH HHH HHH
1
q
1
;
2�
��� � � � � � � � �
HHH � H�
0 0
1 f
Figure 3.4: A graph of q taking into account x j
j
Suppose we have found a number of feasible solutions, and in each of these solutions
x = 1. We might conjecture that there is something inherent in the problem structure which will force x = 1 in a feasible solution. Our second adjustment of the graph of q j
j
j
is to try to capture this simple notion. For each variable, we keep track of the average feasible solution value x$ and construct a graph shown in Figure 3.5. For example, if x$ = 1, and f = 0:2, Figure 3.5 states that the probability that x = 0 in a feasible integer solution is zero. The �nal graph of q is a weighted combination of the graphs j
j
j
j
j
21
1
x � q
1
;x �
0 0
0.5
1
f
Figure 3.5: A graph of q taking into account x j
j
shown in Figures 3.4 and 3.5. The weight given to q in the graph in Figure 3.5 gets larger as more feasible solutions are found. We performed a study to compare the various estimation methods. At certain nodes of the branch and bound tree, we computed estimates of the best solution obtainable from that node using the estimate from the Best Projection method (3.6), the pseudocost estimate (3.7), and the \adjusted pseudocost" estimate (3.8). We then solved the problem with the formulation at that node to optimality for comparison purposes. Table B.1 shows the results. The experiments show that the best projection estimate often underestimates the true solution, and the pseudocost estimate usually overestimates the true solution. The adjusted pseudocost estimate also usually overestimates the solution, but not by as much as the regular pseudocost estimate. These characteristics are not that important by themselves, but have an impact on the performance of the backtracking methods that use them. j
3.3 Two-Phase Methods
Since we have two goals in node selection: �nding good feasible solutions and proving that no better feasible solutions exist, it is natural to develop node selection strategies that switch from one goal to the other in the course of the algorithm. In the �rst phase, we are interested in determining good feasible solutions, while in the second phase, we are interested in proving that the solutions we obtained in the �rst phase are good or optimal. Perhaps the simplest \two-phase" algorithm is to perform depth �rst search until a feasible solution is found, then switch to best �rst search. A slight variation of this strategy is used by Eckstein 13]. Forrest et al. 14] and Beale 2] propose a two-phase method that �rst chooses nodes according to the best-estimate criterion. Once a feasible solution is found, they state that it is better to select nodes that maximize a di�erent criterion, known as the percentage error. The percentage error can be thought of as the amount by which the estimate of 22
the solution obtainable from a node must be in error for the current solution x� to not be optimal. The percentage error of a node i is
PE = 100 zz ;; Ez : i
L
i
i U
L
3.4 Backtracking Methods
De�ne a super�uous node as a node N that has z < z � . Searching the tree in a best �rst manner will ensure that no super�uous nodes are evaluated. If, however, one can be assured that all (or most) of the super�uous nodes will be fathomed, (which is the case if z = z � ), the memory and speed advantages of depth �rst search make this method the most preferable. Various authors have proposed strategies that attempt to go depth �rst as much as possible while minimizing the number of super�uous nodes evaluated 5] 7] 15] 8]. Given some estimate E0 of the optimal objective function value z � , the tree is searched in a depth �rst fashion as long as z > E0 . If z � E0, then a node is selected by a di�erent criterion such as best-�rst or best-estimate. The methods di�er in the manner in which they obtain E0 and in which criterion they use when deciding to backtrack. There is a tradeo� in how \aggressive" one wants to be when calculating an estimate. If the estimate is too large, then the tree will be searched in a best-�rst or best-estimate fashion and none of the advantages of going depth �rst is obtained. If the estimate is too small, then the tree is searched in a more depth �rst fashion and many super�uous nodes may be evaluated. This point must be kept in mind when selecting an estimation method on which to base a backtracking node selection rule. i
i LP
L
i LP
i LP
3.5 Branch Selection
Typical branching is based on a dichotomy that creates two new nodes for evaluation. The node selection scheme must also answer the question of how to rank the order of evaluation for these nodes. Schemes that prioritize the nodes based on an estimate of the optimal solution obtainable from that node have a built-in answer to this question, since distinct estimates are assigned to the newly created nodes. For schemes that do not distinguish between the importance of the two newly created nodes, such as depth�rst, researchers have made the following suggestion. Suppose that we have based the branching dichotomy on the variable x � , then we select the down node �rst if f � > 1;f � and the up node �rst otherwise 25]. If estimates are not available, we will use this rule for selecting whether to evaluate the down or up child of a node. i j
j
3.6 Computational Results
i j
We performed an experiment to compare many of the node selection rules we have discussed. Each of the problems in MIPLIB was solved using the node selection methods detailed in Table 3.10. For a branching method, we use the adaptive regression method B6 in Table 2.6. All advanced features of MINTO were used, which includes a diving heuristic that is invoked every ten nodes of the branch and bound tree. 23
Node Selection Method N1 N2 N3 N4 N5 N6 N7 N8 N9 N10 N11 N12 N13
Description Best Bound. Depth First. Depth First until a solution is obtained, then Best Bound. Best Estimate (normal pseudocost) until a solution is obtained, then Percentage Error. Best Projection. Best Estimate (normal pseudocost). Best Estimate (adjusted pseudocost). Backtrack. Best Projection Estimate. When backtracking, select node by best bound criterion. Backtrack. Best Estimate (normal pseudocost). When backtracking, select node by best bound criterion. Backtrack. Best Estimate (adjusted pseudocost). When backtracking, select node by best bound criterion. Backtrack. Best Projection Estimate. When backtracking, select node by best estimate criterion. Backtrack. Best Estimate (normal pseudocost). When backtracking, select node by best estimate criterion. Backtrack. Best Estimate (adjusted pseudocost). When backtracking, select node by best estimate criterion. Table 3.10: Node Selection Rules Investigated
24
As in branching methods experiment the instances nwo4 and dano3mip were excluded from this experiment. In addition, the instance arki001 was also excluded, since during the heuristic phase, we encounter a linear program which takes more than one hour of CPU time to solve. This left us with 56 problems in the test suite. Table B.2 shows the full results of this experiment, and Table 3.11 shows a summary of the results. When ranking the performance of a node selection method on a given instance, we used the following criteria: Methods are ranked �rst by the value of the best solution obtained. If two methods �nd the same solution, the method with the lower provable optimality gap is ranked higher. If both methods �nd the same solution and optimality gap, they are ranked according to computation time. Ties are allowed. In computing the rankings, instances where each node selection method was able to prove the optimality of the solution and the di�erence between best and worst methods' computation times was less than 30 seconds were excluded. This left us with 33 instances. Method N1 N2 N3 N4 N5 N6 N7 N8 N9 N10 N11 N12 N13
Ranking Times No Times Optimal Computation (Min, Avg, Max) Sol'n Found Sol'n Found Time (sec.) (1, 6.67, 13) 2 8 68189 (1, 8.42, 13) 1 3 80005 (1, 7.12, 13) 1 7 72207 (1, 6.12, 13) 2 10 72324 (1, 7.03, 13) 0 7 79082 (1, 5.67, 12) 2 11 66147 (1, 5.94, 13) 1 8 67823 (1, 7.00, 13) 1 7 74375 (1, 6.85, 12) 1 8 66475 (1, 6.94, 13) 1 8 68106 (1, 7.42, 13) 1 2 78568 (1, 5.70, 13) 1 10 65861 (1, 5.42, 11) 1 11 67944
Table 3.11: Summary of Node Selection Method Experiment. From the tables it is di�cult to determine a clear winner among the node selection methods, but we can make the following observations: Pseudocost-based node estimate methods or combining a pseudocost based estimate method in backtracking seems to be the best idea for node selection. 25
Backtracking methods that select the node with the best estimate when back-
tracking generally outperform those methods that choose the best bound node when backtracking. There is no node selection method which clearly dominates the others (note that almost all methods came in last at least once), so a sophisticated MIP solver should allow many di�erent options for selecting the next node to evaluate. Even in the presence of a primal heuristic, depth �rst search performs poorly in practice.
4 Conclusions We have examined a wide variety of branching methods and node selection rules for mixed integer programming. The strategies were examined in conjunction with many of the advanced features found in today's sophisticated MIP solvers to see if strategies developed decades ago are still practical today. In general, we conclude that the early methods are indeed still practical today. Especially pseudocost-based-methods, when used intelligently, seem to be very bene�cial. Some important topics for further investigation are Can the \local" and \global" branching information from simplex pivots and pseudocosts be combined in a more intelligent way than by simple linear regression. Can we develop intelligent ways to choose a \good" subset of variables for strong branching? Can we get better estimates of the optimal solution obtainable from a node? Can we develop search strategies that adapt themselves based on the observed behavior for a given problem instance?
5 Acknowledgment The authors would like to acknowledge Alper Atamt"urk for many useful discussions.
References 1] D. Applegate, R. Bixby, W. Cook, and V. Chv�atal, 1996. Personal communication. 2] E. M. L. Beale. Branch and bound methods for mathematical programming systems. In P. L. Hammer, E. L. Johnson, and B. H. Korte, editors, Discrete Optimization II, pages 201{219. North Holland Publishing Co., 1979. 3] E. M. L. Beale and J. J. H. Forrest. Global optimization using special ordered sets. Mathematical Programming, 10:52{69, 1976. 26
4] E. M. L. Beale and R. E. Small. Mixed integer programming by a branch and bound method. In W. H. Kalenich, editor, Proceedings IFIP Congress 65, volume 2, pages 450{451, 1966. 5] M. B�enichou, J. M. Gauthier, P. Girodet, G. Hentges, G. Ribi�ere, and O. Vincent. Experiments in mixed-integer linear programming. Mathematical Programming, 1:76{94, 1971. 6] R. E. Bixby, S. Ceria, C. M. McZeal, and M. W. P. Savelsbergh. An updated mixed integer programming library: MIPLIB 3.0. SIAM News, 1996. Submitted. 7] R. Breu and C. A. Burdet. Branch and bound experiments in zero-one programming. Mathematical Programming, 2:1{50, 1974. 8] CPLEX Optimization, Inc. Using the CPLEX Callable Library, 1995. 9] H. Crowder, E. L. Johnson, and M. W. Padberg. Solving large scale zero-one linear programming problems. Operations Research, 31:803{834, 1983. 10] R. J. Dakin. A tree search algorithm for mixed programming problems. Computer Journal, 8(3):250{255, 1965. 11] R. E. Davis, D. A. Kendrick, and M. Weitzman. A branch and bound algorithm for zero-one mized integer programming problems. Technical Report Development Economic Report 69, Center for International A�airs, Harvard University, 1967. 12] N. J. Driebeek. An algorithm for the solution of mixed integer programming problems. Management Science, 12:576{587, 1966. 13] J. Eckstein. Parallel branch-and-bound algorithms for general mixed integer programming on the CM-5. SIAM Journal on Optimization, 4(4):794{814, 1994. 14] J. J. H. Forrest, J. P. H. Hirst, and J. A. Tomlin. Practical solution of large scale mixed integer programming problems with UMPIRE. Management Science, 20(5):736{773, 1974. 15] J. M. Gauthier and G. Ribi�ere. Experiments in mixed-integer linear programming using pseudocosts. Mathematical Programming, 12:26{47, 1977. 16] A. M. Geo�rion and R. E. Marsten. Integer programming algorithms: A framework and state-of-the-art survey. Management Science, 18(9):465{491, 1972. 17] Z. Gu, G. L. Nemhauser, and M. W. P. Savelsbergh. Cover inequalities for 0-1 linear programs: Computation. INFORMS Journal on Computing, 1994. Submitted. 18] O G"unl"uk. A branch-and-Cut algorithm for capacitated network design problems. Submitted, 1996. 19] M. T. Hajian and G. Mitra. Design and testing of an integrated branch and bound algorithm for piecewise linear and discrete programming problems. Technical Report TR/01/95, Brunel, the University of West London, London, 1995. 27
20] J. P. H. Hirst. Features required in branch and bound algorithms for (0-1) mixed integer linear programming. Privately circulated manuscript, December 1969. 21] W. C. Healy Jr. Multiple choice programming. Operations Research, 12:122{138, 1964. 22] M. J"unger, G. Reinelt, and S. Thienel. Provably good solutions for the traveling salesman problem. Zeitschrift f�ur Operations Research, 40:183{217, 1994. 23] T. H. Lai and A. Sprague. A note on anomolies in parallel branch and bound algorithms with one-to-one bounding functions. Information Processing Letters, 23:119{122, 1986. 24] T.H. Lai and S. Sahni. Anomalies in parallel branch and bound algorithms. In Proceedings of the 1983 International Conference on Parallel Processing, pages 183{ 190, 1983. 25] A. Land and S. Powell. Computer codes for problems of integer programming. In P. L. Hammer, E. L. Johnson, and B. H. Korte, editors, Discrete Optimization II, pages 221{269. North Holland Publishing Co., 1979. 26] A. H. Land and A. G. Doig. An automatic method for solving discrete programming problems. Econometrica, 28:497{520, 1960. 27] J. D. C. Little, K. G. Murty, D. W. Sweeney, and C. Karel. An algorithm for the traveling salesman problem. Operations Research, 21:972{989, 1963. 28] G. Mitra. Investigation of some branch and bound strategies for the solution of mixed integer linear programs. Mathematical Programming, 4:155{170, 1973. 29] G. L. Nemhauser, M. W. P. Savelsbergh, and G. C. Sigismondi. MINTO, a Mixed INTeger Optimizer. Operations Research Letters, 15:47{58, 1994. 30] B. Nygreen. Branch and bound with estimation based on pseudo shadow prices. Mathematical Programming, 52(1):59{69, 1991. 31] M. Padberg and T. J. Van Roy amd L. Wolsey. Valid linear inequalities for �xed charge problems. Operations Research, 33:842{861, 1985. 32] M. W. Padberg and G. Rinaldi. A branch and cut algorithm for the solution of large scale traveling salesman problems. SIAM Review, 33:60{100, 1991. 33] T. J. Van Roy and L. A. Wolsey. Solving mixed integer 0-1 programs by automatic reformulation. Operations Research, 35:45{57, 1987. 34] M. W. P. Savelsbergh. Preprocessing and probing techniques for mixed integer programming problems. ORSA Journal on Computing, 6(4):445{454, 1994. 35] J. A. Tomlin. Branch and bound methods for integer and non-convex progrmming. In J. Abadie, editor, Integer and Non-linear Programming. North Holland, Amsterdam, 1970. 28
36] J. A. Tomlin. An improved branch-and-bound method for integer programming. Operations Research, 19:1070{1075, 1971. 37] J. M. Troya and M. Ortega. Study of parallel branch-and-bound algorithms with best-bound-�rst search. Parallel Computing, 11:121{126, 1989.
Appendix A { Branching Tables Problem air04 air04 air04 air04 arki001 arki001 arki001 arki001 bell3a bell3a bell3a bell3a bell5 bell5 bell5 bell5 gesa2 gesa2 gesa2 gesa2 harp2 harp2 harp2 harp2 l152lav l152lav l152lav l152lav mod011 mod011 mod011 mod011
Table A.1: The E�ect of Pseudocost Initialization Initialization Method Nodes Final Gap Sol. Time(sec.) Obj. Coef. 2618 0.159% 3600 Computed 0 XXX 3600 Computed Fractional 195 0% 2351 Averaged 1588 0.950% 3600 Obj. Coef. 31915 0.0155% 3600 Computed 30739 0.00350% 3600 Computed Fractional 38583 0.00454% 3600 Averaged 36086 0.0101% 3600 Obj. Coef. 30926 0% 99 Computed 28627 0% 96 Computed Fractional 28319 0% 97 Averaged 30864 0% 98 Obj. Coef. 120000 0.387% XXX Computed 21365 0% 66 Computed Fractional 14013 0% 45 Averaged 64361 0% 240 Obj. Coef. 32815 0.0572% 3600 Computed 34681 0.0233% 3600 Computed Fractional 40885 0.00814% 3600 Averaged 32951 0.0226% 3600 Obj. Coef. 4900 0.185% 3600 Computed 11145 7.75e-06% 3600 Computed Fractional 10695 9.02e-06% 3600 Averaged 6476 0.148% 3600 Obj. Coef. 7481 0% 481 Computed 1573 0% 241 Computed Fractional 1511 0% 133 Averaged 9039 0% 533 Obj. Coef. 414 5.15% 3600 Computed 372 6.09% 3600 Computed Fractional 418 5.17% 3600 Averaged 432 5.37% 3600
29
Problem pp08a pp08a pp08a pp08a qiu qiu qiu qiu qnet1 qnet1 qnet1 qnet1 rgn rgn rgn rgn stein45 stein45 stein45 stein45 vpm2 vpm2 vpm2 vpm2
Initialization Method Obj. Coef. Computed Computed Fractional Averaged Obj. Coef. Computed Computed Fractional Averaged Obj. Coef. Computed Compute Fractional Averaged Obj. Coef. Computed Computed Fractional Averaged Obj. Coef. Computed Computed Fractional Averaged Obj. Coef. Computed Computed Fractional Averaged
Nodes Final Gap Sol. Time(sec.) 85000 5.47% XXX 85000 5.20% XXX 83000 5.10% XXX 85000 5.73% XXX 3614 112% 3600 4116 131% 3600 4310 113% 3600 3717 91.3% 3600 30000 3.60% XXX 73 0% 118 59 0% 20 4441 0% 511 1953 0% 20 3465 0% 40 2907 0% 30 3201 0% 37 54841 0% 2540 61283 0% 2553 60315 0% 2283 61933 0% 3008 14453 0% 435 9375 0% 215 9431 0% 210 16793 0% 486
30
Table A.2: The E�ect of Pseudocost Update Method on Various MIPLIB instances Problem Update Method Nodes Final Gap (%) Sol. Time(sec.) air04 Average 1986 0.104% 3600 air04 First 1523 0.458% 3600 air04 Last 1932 0.105% 3600 arki001 Average 37821 0.00456% 3600 arki001 First 49037 0.00366% 3600 arki001 Last 39512 0.00288% 3600 bell3a Average 28319 0% 100 bell3a First 29841 0% 108 bell3a Last 28293 0% 99 bell5 Average 14013 0% 45 bell5 First 15941 0% 51 bell5 Last 119421 0% 403 gesa2 Average 39190 0.00882% 3600 gesa2 First 37147 0.0155% 3600 gesa2 Last 35682 0.0181% 3600 harp2 Average 10110 9.51e-06% 3600 harp2 First 9734 8.35e-03% 3600 harp2 Last 9910 8.85e-06% 3600 l152lav Average 1511 0% 138 l152lav First 1639 0% 141 l152lav Last 1323 0% 125 mod011 Average 407 5.21% 3600 mod011 First 416 5.64% 3600 mod011 Last 403 5.11% 3600 pp08a Average 101574 4.76% 3600 pp08a First 103054 5.46% 3600 pp08a Last 97446 4.9% 3600 qiu Average 4172 114% 3600 qiu First 4844 181% 3600 qiu Last 4062 124% 3600 qnet1 Average 57 0% 20 qnet1 First 57 0% 20 qnet1 Last 57 0% 20 rgn Average 2907 0% 32 rgn First 3639 0% 41 rgn Last 2823 0% 32 stein45 Average 60315 0% 2286 stein45 First 66552 5% 3600 stein45 Last 64079 0% 2463 vpm2 Average 9431 0% 216
31
Problem Update Method Nodes Final Gap (%) Sol. Time(sec.) vpm2 First 12517 0% 270 vpm2 Last 10689 0% 258
32
Problem Cuts? danoint danoint enigma enigma lseu lseu misc03 misc03 misc07 misc07 mod010 mod010 p0201 p0201 p2756 p2756 pk1 pk1 rentacar rentacar rgn rgn rout rout vpm1 vpm1
Y N Y N Y N Y N Y N Y N Y N Y N Y N Y N Y N Y N Y N
Percent of Nodes With Useful Estimates 98.40% 94.00% 5.13% 23.00% 100.00% 92.00% 66.45% 90.69% 78.05% 92.62% 100.00% 65.79% 81.20% 66.00% 80.00% 66.25% 38.40% 44.40% 100.00% 0.00% 24.56% 0.85% 88.71% 71.08% 9.38% 100.00%
Table A.3: The E�ect of Valid Inequalities on Percentage of Useful Lower Bound Estimates
33
Table A.4: Computational Results Using Di�erent Lower Bound Based Branching Methods Problem Branching Method Nodes Final Gap (%) Sol. Time(sec.) air04 10 pivots (all) 29 0.94% 3600 air04 1 pivot (all) 884 0.305% 3600 air04 knapsack 572 0.511% 3600 air04 strong 131 0% 1516 arki001 10 pivots (all) 1939 0.0073% 3600 arki001 1 pivot (all) 20048 0.00288% 3600 arki001 knapsack 15269 0.00591% 3600 arki001 strong 8459 0.0135% 3600 bell3a 10 pivots (all) 28185 0% 284 bell3a 1 pivot (all) 28309 0% 216 bell3a knapsack 28465 0% 220 bell3a strong 30001 0% 307 bell5 10 pivots (all) 76817 0.053% 3600 bell5 1 pivot (all) 90758 0.0418% 3600 bell5 knapsack 89473 0.0546% 3600 bell5 strong 97745 3.67% 3600 gesa2 10 pivots (all) 7755 0.0257% 3600 gesa2 1 pivot (all) 27152 0.013% 3600 gesa2 knapsack 27982 0.00515% 3600 gesa2 strong 15638 0.305% 3600 harp2 10 pivots (all) 465 0.105% 3600 harp2 1 pivot (all) 3942 0.0888% 3600 harp2 knapsack 2800 0.124% 3600 harp2 strong 3377 0.132% 3600 l152lav 10 pivots (all) 269 0% 254 l152lav 1 pivot (all) 477 0% 85 l152lav knapsack 7327 0% 984 l152lav strong 699 0% 197 mod011 10 pivots (all) 122 6.28% 3600 mod011 1 pivot (all) 403 5.81% 3600 mod011 knapsack 410 6.08% 3600 mod011 strong 334 4.24% 3600 pp08a 10 pivots (all) 10626 8.4% 3600 pp08a 1 pivot (all) 44729 8.81% 3600 pp08a knapsack 43402 8.81% 3600 pp08a strong 33938 10.3% 3600 qiu 10 pivots (all) 354 183% 3600 qiu 1 pivot (all) 3765 194% 3600 qiu knapsack 3810 190% 3600
34
Problem Branching Method qiu strong qnet1 10 pivots (all) qnet1 1 pivot (all) qnet1 knapsack qnet1 strong rgn 10 pivots (all) rgn 1 pivot (all) rgn knapsack rgn strong stein45 10 pivots (all) stein45 1 pivot (all) stein45 knapsack stein45 strong vpm2 10 pivots (all) vpm2 1 pivot (all) vpm2 knapsack vpm2 strong
Nodes Final Gap (%) Sol. Time(sec.) 560 191% 3600 53 0% 61 295 0% 44 157 0% 27 14644 3.14% 3600 1885 0% 45 2039 0% 24 2127 0% 26 2097 0% 40 13644 5% 3600 51641 0% 3357 52365 0% 3400 24553 0% 3508 4611 0% 298 13081 0% 395 15397 0% 490 9957 0% 471
35
Table A.5: The E�ect of Combining Up and Down Pseudocost Information When Choosing a Branching Variable Problem (�1, �2 ) air04 (10, 1) air04 (2, 1) air04 (1, 1) air04 (1, 0) air04 (1, 2) air04 (1, 10) arki001 (10, 1) arki001 (2, 1) arki001 (1, 1) arki001 (1, 0) arki001 (1, 2) arki001 (1, 10) bell3a (10, 1) bell3a (2, 1) bell3a (1, 1) bell3a (1, 0) bell3a (1, 2) bell3a (1, 10) bell5 (10, 1) bell5 (2, 1) bell5 (1, 1) bell5 (1, 0) bell5 (1, 2) bell5 (1, 10) gesa2 (10, 1) gesa2 (2, 1) gesa2 (1, 1) gesa2 (1, 0) gesa2 (1, 2) gesa2 (1, 10) harp2 (10, 1) harp2 (2, 1) harp2 (1, 1) harp2 (1, 0) harp2 (1, 2) harp2 (1, 10) l152lav (10, 1) l152lav (2, 1) l152lav (1, 1)
Nodes Final Gap (%) Sol. Time(sec.) 147 0% 2722 167 0% 2604 189 0% 2598 203 0% 2857 221 0% 2691 257 0% 2727 25385 0.00327% 3600 21096 0.00238% 3600 22158 0.00264% 3600 15625 0.0049% 3600 22002 0.00313% 3600 20059 0.00501% 3600 28449 0% 110 28419 0% 109 28321 0% 109 28559 0% 111 28307 0% 109 28445 0% 109 202893 0% 771 33491 0% 121 17527 0% 63 281761 0% 1056 16599 0% 60 17153 0% 62 33999 0.00278% 3600 33646 0.00397% 3600 31788 0.00724% 3600 26629 0.189% 3600 29858 0.0116% 3600 29423 0.0116% 3600 12020 7.09e-06% 3600 9084 7.46e-06% 3600 5704 3.04e-02% 3600 3486 2.21e-02% 3600 5729 2.89e-02% 3600 5382 2.76e-02% 3600 209 0% 65 313 0% 74 475 0% 103
36
Problem (�1 , �2 ) l152lav (1, 0) l152lav (1, 2) l152lav (1, 10) mod011 (10, 1) mod011 (2, 1) mod011 (1, 1) mod011 (1, 0) mod011 (1, 2) mod011 (1, 10) pp08a (10, 1) pp08a (2, 1) pp08a (1, 1) pp08a (1, 0) pp08a (1, 2) pp08a (1, 10) qiu (10, 1) qiu (2, 1) qiu (1, 1) qiu (1, 0) qiu (1, 2) qiu (1, 10) qnet1 (10, 1) qnet1 (2, 1) qnet1 (1, 1) qnet1 (1, 0) qnet1 (1, 2) qnet1 (1, 10) rgn (10, 1) rgn (2, 1) rgn (1, 1) rgn (1, 0) rgn (1, 2) rgn (1, 10) stein45 (10, 1) stein45 (2, 1) stein45 (1, 1) stein45 (1, 0) stein45 (1, 2) stein45 (1, 10) vpm2 (10, 1) vpm2 (2, 1)
Nodes Final Gap (%) Sol. Time(sec.) 407 0% 93 1005 0% 167 1061 0% 172 382 4.09% 3600 394 4.39% 3600 373 5.17% 3600 375 4.39% 3600 397 5.56% 3600 396 5.65% 3600 65737 6.66% 3600 71116 5.54% 3600 69241 5.84% 3600 66081 7.81% 3600 69356 6.33% 3600 69515 6.92% 3600 3707 105% 3600 3775 110% 3600 3786 114% 3600 3534 117% 3600 3770 121% 3600 4000 127% 3600 147 0% 44 73 0% 25 57 0% 22 309 0% 71 57 0% 21 61 0% 21 2101 0% 25 2137 0% 25 2305 0% 27 2387 0% 29 2327 0% 27 2421 0% 28 50877 0% 2743 47241 0% 2386 46749 0% 2404 57411 0% 2991 48655 0% 2515 49269 0% 2547 7939 0% 206 7143 0% 183
37
Problem (�1 , �2 ) Nodes Final Gap (%) Sol. Time(sec.) vpm2 (1, 1) 8113 0% 206 vpm2 (1, 0) 10365 0% 301 vpm2 (1, 2) 9061 0% 233 vpm2 (1, 10) 9859 0% 266
38
Table A.6: Comparison of Branching Methods Problem Branch Method Nodes Final Gap Sol. Time(sec.) 10teams B1 16908 0.216% 3600 10teams B2 16849 0.758% 3600 10teams B3 8838 0.758% 3600 10teams B4 641 0% 409 10teams B5 113 0% 299 10teams B6 113 0% 299 10teams B7 8952 0.433% 3600 air03 B1 3 0% 61 air03 B2 5 0% 61 air03 B3 3 0% 61 air03 B4 3 0% 61 air03 B5 3 0% 62 air03 B6 3 0% 62 air03 B7 3 0% 62 air04 B1 1173 0.48% 3600 air04 B2 2755 0% 3275 air04 B3 956 0.24% 3600 air04 B4 155 0% 2453 air04 B5 167 0% 2600 air04 B6 203 0% 2674 air04 B7 771 0.219% 3600 air05 B1 2116 0.642% 3600 air05 B2 3346 0.0997% 3600 air05 B3 1552 0.37% 3600 air05 B4 721 0% 1444 air05 B5 691 0% 1876 air05 B6 631 0% 1780 air05 B7 931 0.78% 3600 arki001 B1 26404 0.0142% 3600 arki001 B2 29088 0.0157% 3600 arki001 B3 20333 0.00326% 3600 arki001 B4 40189 0.00294% 3600 arki001 B5 21345 0.00238% 3600 arki001 B6 21989 0.00243% 3600 arki001 B7 17230 0.00569% 3600 bell3a B1 81541 0% 1111 bell3a B2 39281 0% 345 bell3a B3 28319 0% 214 bell3a B4 28383 0% 100 bell3a B5 28419 0% 109
39
Problem Branch Method bell3a B6 bell3a B7 bell5 B1 bell5 B2 bell5 B3 bell5 B4 bell5 B5 bell5 B6 bell5 B7 blend2 B1 blend2 B2 blend2 B3 blend2 B4 blend2 B5 blend2 B6 blend2 B7 cap6000 B1 cap6000 B2 cap6000 B3 cap6000 B4 cap6000 B5 cap6000 B6 cap6000 B7 danoint B1 danoint B2 danoint B3 danoint B4 danoint B5 danoint B6 danoint B7 dcmulti B1 dcmulti B2 dcmulti B3 dcmulti B4 dcmulti B5 dcmulti B6 dcmulti B7 dsbmip B1 dsbmip B2 dsbmip B3 dsbmip B4
Nodes 28391 28443 78793 82805 92357 14341 33491 19187 90314 2735 1827 1908 1163 1263 1327 1607 1708 1301 1750 1862 1807 1703 1882 552 473 631 572 566 592 611 69380 29635 3989 897 943 973 3877 1 1 1 1
40
Final Gap Sol. Time(sec.) 0% 109 0% 217 3.81% 3600 3.77% 3600 0.0402% 3600 0% 45 0% 121 0% 69 0.0429% 3600 0% 252 0% 163 0% 178 0% 58 0% 76 0% 74 0% 124 9.56e-04% 3600 5.04e-03% 3600 5.09e-04% 3600 7.01e-04% 3600 4.52e-04% 3600 6.21e-04% 3600 7.00e-04% 3600 4.19% 3600 4.14% 3600 4.16% 3600 4.12% 3600 4.12% 3600 4.14% 3600 4.17% 3600 0.00841% 3600 0% 1155 0% 132 0% 28 0% 32 0% 33 0% 156 0% 2 0% 2 0% 2 0% 2
Problem Branch Method Nodes Final Gap Sol. Time(sec.) dsbmip B5 1 0% 2 dsbmip B6 1 0% 2 dsbmip B7 1 0% 2 egout B1 3 0% 0 egout B2 3 0% 0 egout B3 3 0% 0 egout B4 3 0% 0 egout B5 3 0% 0 egout B6 3 0% 0 egout B7 3 0% 0 enigma B1 1 0% 0 enigma B2 1 0% 0 enigma B3 1 0% 0 enigma B4 1 0% 0 enigma B5 1 0% 0 enigma B6 1 0% 0 enigma B7 1 0% 0 fast0507 B1 173 1.01% 3600 fast0507 B2 167 0.991% 3600 fast0507 B3 57 0.916% 3600 fast0507 B4 72 0.935% 3600 fast0507 B5 37 0.917% 3600 fast0507 B6 37 0.917% 3600 fast0507 B7 49 0.926% 3600 �ber B1 97 0% 10 �ber B2 213 0% 17 �ber B3 39 0% 7 �ber B4 27 0% 7 �ber B5 27 0% 8 �ber B6 27 0% 8 �ber B7 61 0% 10 �xnet6 B1 1005 0% 80 �xnet6 B2 411 0% 32 �xnet6 B3 79 0% 9 �xnet6 B4 65 0% 10 �xnet6 B5 63 0% 10 �xnet6 B6 63 0% 10 �xnet6 B7 77 0% 9 �ugpl B1 10829 0% 28 �ugpl B2 5331 0% 10 �ugpl B3 3745 0% 7
41
Problem Branch Method �ugpl B4 �ugpl B5 �ugpl B6 �ugpl B7 gen B1 gen B2 gen B3 gen B4 gen B5 gen B6 gen B7 gesa2 B1 gesa2 B2 gesa2 B3 gesa2 B4 gesa2 B5 gesa2 B6 gesa2 B7 gesa2 o B1 gesa2 o B2 gesa2 o B3 gesa2 o B4 gesa2 o B5 gesa2 o B6 gesa2 o B7 gesa3 B1 gesa3 B2 gesa3 B3 gesa3 B4 gesa3 B5 gesa3 B6 gesa3 B7 gesa3 o B1 gesa3 o B2 gesa3 o B3 gesa3 o B4 gesa3 o B5 gesa3 o B6 gesa3 o B7 gt2 B1 gt2 B2
Nodes 8587 4685 4485 3033 19 3 3 3 3 3 3 28843 28908 27398 41160 33960 33024 28324 28470 28458 26309 47870 33398 34126 22062 19974 22285 893 811 723 847 1053 22500 21699 825 987 889 981 1121 85091 86525
42
Final Gap Sol. Time(sec.) 0% 13 0% 8 0% 8 0% 6 0% 2 0% 1 0% 1 0% 1 0% 1 0% 1 0% 1 0.302% 3600 0.326% 3600 0.013% 3600 0.00726% 3600 0.00385% 3600 0.00505% 3600 0.00608% 3600 0.378% 3600 0.384% 3600 0.0145% 3600 0.00253% 3600 0.00334% 3600 0.00208% 3600 0.0172% 3600 0.0589% 3600 0% 3460 0% 148 0% 86 0% 99 0% 113 0% 186 0.0798% 3600 0.118% 3600 0% 115 0% 92 0% 127 0% 141 0% 166 34% 3600 34% 3600
Problem Branch Method gt2 B3 gt2 B4 gt2 B5 gt2 B6 gt2 B7 harp2 B1 harp2 B2 harp2 B3 harp2 B4 harp2 B5 harp2 B6 harp2 B7 khb05250 B1 khb05250 B2 khb05250 B3 khb05250 B4 khb05250 B5 khb05250 B6 khb05250 B7 l152lav B1 l152lav B2 l152lav B3 l152lav B4 l152lav B5 l152lav B6 l152lav B7 lseu B1 lseu B2 lseu B3 lseu B4 lseu B5 lseu B6 lseu B7 misc03 B1 misc03 B2 misc03 B3 misc03 B4 misc03 B5 misc03 B6 misc03 B7 misc06 B1
Nodes 132763 57 53 53 74618 7837 9814 3949 12058 9149 4778 2540 23 15 17 15 15 15 17 8337 4131 459 469 313 259 5203 59 99 85 91 83 89 109 439 363 547 483 405 395 491 423
43
Final Gap Sol. Time(sec.) 6.69% 3600 0% 0 0% 0 0% 0 35.6% 3600 2.96e-01% 3600 3.60e-01% 3600 6.63e-02% 3600 7.55e-06% 3600 7.45e-06% 3600 1.93e-02% 3600 1.44e-01% 3600 0% 2 0% 1 0% 2 0% 2 0% 2 0% 2 0% 2 0% 552 0% 286 0% 84 0% 71 0% 72 0% 67 0% 717 0% 1 0% 1 0% 2 0% 2 0% 2 0% 2 0% 2 0% 9 0% 8 0% 14 0% 12 0% 12 0% 12 0% 13 0% 22
Problem Branch Method misc06 B2 misc06 B3 misc06 B4 misc06 B5 misc06 B6 misc06 B7 misc07 B1 misc07 B2 misc07 B3 misc07 B4 misc07 B5 misc07 B6 misc07 B7 mitre B1 mitre B2 mitre B3 mitre B4 mitre B5 mitre B6 mitre B7 mod008 B1 mod008 B2 mod008 B3 mod008 B4 mod008 B5 mod008 B6 mod008 B7 mod010 B1 mod010 B2 mod010 B3 mod010 B4 mod010 B5 mod010 B6 mod010 B7 mod011 B1 mod011 B2 mod011 B3 mod011 B4 mod011 B5 mod011 B6 mod011 B7
Nodes Final Gap Sol. Time(sec.) 423 0% 22 165 0% 12 59 0% 5 59 0% 6 59 0% 6 165 0% 12 13321 0% 980 10249 0% 600 18321 0% 1427 51837 0% 3490 43697 0% 3376 38789 0% 3063 17127 0% 1441 23 0% 59 23 0% 59 23 0% 106 23 0% 162 23 0% 210 23 0% 210 23 0% 126 437 0% 32 579 0% 46 431 0% 25 91 0% 5 79 0% 5 79 0% 5 501 0% 30 31 0% 11 15 0% 9 131 0% 24 19 0% 11 39 0% 14 39 0% 14 1005 0% 97 466 4.3% 3600 448 5.19% 3600 395 6.16% 3600 414 4.73% 3600 398 4.38% 3600 413 4.24% 3601 407 6.07% 3600
44
Problem Branch Method Nodes Final Gap Sol. Time(sec.) modglob B1 275 0% 18 modglob B2 823 0% 54 modglob B3 1329 0% 162 modglob B4 477 0% 39 modglob B5 1015 0% 112 modglob B6 429 0% 38 modglob B7 1993 0% 135 noswot B1 1 0% 0 noswot B2 1 0% 0 noswot B3 1 0% 0 noswot B4 1 0% 0 noswot B5 1 0% 0 noswot B6 1 0% 0 noswot B7 1 0% 0 p0033 B1 7 0% 0 p0033 B2 11 0% 0 p0033 B3 11 0% 0 p0033 B4 7 0% 0 p0033 B5 7 0% 0 p0033 B6 7 0% 0 p0033 B7 11 0% 0 p0201 B1 545 0% 17 p0201 B2 689 0% 18 p0201 B3 469 0% 23 p0201 B4 77 0% 6 p0201 B5 63 0% 6 p0201 B6 63 0% 6 p0201 B7 333 0% 19 p0282 B1 497 0% 32 p0282 B2 25 0% 3 p0282 B3 61 0% 5 p0282 B4 37 0% 3 p0282 B5 37 0% 3 p0282 B6 37 0% 3 p0282 B7 73 0% 5 p0548 B1 5 0% 2 p0548 B2 5 0% 2 p0548 B3 5 0% 2 p0548 B4 9 0% 2 p0548 B5 9 0% 2 p0548 B6 9 0% 2
45
Problem Branch Method p0548 B7 p2756 B1 p2756 B2 p2756 B3 p2756 B4 p2756 B5 p2756 B6 p2756 B7 pk1 B1 pk1 B2 pk1 B3 pk1 B4 pk1 B5 pk1 B6 pk1 B7 pp08a B1 pp08a B2 pp08a B3 pp08a B4 pp08a B5 pp08a B6 pp08a B7 pp08aCUTS B1 pp08aCUTS B2 pp08aCUTS B3 pp08aCUTS B4 pp08aCUTS B5 pp08aCUTS B6 pp08aCUTS B7 qiu B1 qiu B2 qiu B3 qiu B4 qiu B5 qiu B6 qiu B7 qnet1 B1 qnet1 B2 qnet1 B3 qnet1 B4 qnet1 B5
Nodes Final Gap Sol. Time(sec.) 9 0% 2 3883 0% 2035 11 0% 5 11 0% 5 13 0% 7 13 0% 7 13 0% 7 11 0% 6 44838 50.3% 3600 44186 51.1% 3600 44021 49.3% 3600 70055 37.4% 3600 64587 34.4% 3600 65074 34.3% 3600 43309 49.2% 3600 50284 12.2% 3600 50882 10.1% 3600 44925 8.76% 3600 106531 4.51% 3600 71654 5.53% 3600 73753 5.07% 3600 43490 8.83% 3600 48143 12.3% 3600 48454 10.2% 3600 41498 8.82% 3600 89825 4.77% 3600 60842 5.74% 3600 62318 5.37% 3600 40205 8.79% 3600 3904 177% 3600 3550 139% 3600 3874 191% 3600 4102 109% 3600 3785 110% 3600 3706 94.4% 3600 3909 190% 3600 28679 7.55% 3600 34584 8.68% 3600 287 0% 41 81 0% 25 83 0% 28
46
Problem Branch Method qnet1 B6 qnet1 B7 qnet1 o B1 qnet1 o B2 qnet1 o B3 qnet1 o B4 qnet1 o B5 qnet1 o B6 qnet1 o B7 rentacar B1 rentacar B2 rentacar B3 rentacar B4 rentacar B5 rentacar B6 rentacar B7 rgn B1 rgn B2 rgn B3 rgn B4 rgn B5 rgn B6 rgn B7 rout B1 rout B2 rout B3 rout B4 rout B5 rout B6 rout B7 set1ch B1 set1ch B2 set1ch B3 set1ch B4 set1ch B5 set1ch B6 set1ch B7 seymour B1 seymour B2 seymour B3 seymour B4
Nodes Final Gap Sol. Time(sec.) 81 0% 28 219 0% 41 28299 0% 1768 37407 0% 2327 559 0% 59 249 0% 25 233 0% 24 237 0% 24 391 0% 40 17 0% 33 25 0% 39 16 0% 29 17 0% 38 17 0% 39 17 0% 39 16 0% 29 3085 0% 41 1855 0% 19 2039 0% 24 2745 0% 30 2137 0% 25 2107 0% 25 2053 0% 24 4190 6.16% 3600 3096 4.22% 3600 3770 5.4% 3600 3704 3.58% 3600 2993 3.48% 3600 2838 3.64% 3600 3344 5.42% 3600 18934 24.6% 3600 19335 24.4% 3600 18629 16.1% 3600 65750 13.5% 3600 21844 15.7% 3600 20035 15% 3600 14958 16.3% 3600 3023 3.96% 3600 2675 4.12% 3600 492 3.72% 3600 111 3.45% 3600
47
Problem Branch Method seymour B5 seymour B6 seymour B7 stein27 B1 stein27 B2 stein27 B3 stein27 B4 stein27 B5 stein27 B6 stein27 B7 stein45 B1 stein45 B2 stein45 B3 stein45 B4 stein45 B5 stein45 B6 stein45 B7 vpm1 B1 vpm1 B2 vpm1 B3 vpm1 B4 vpm1 B5 vpm1 B6 vpm1 B7 vpm2 B1 vpm2 B2 vpm2 B3 vpm2 B4 vpm2 B5 vpm2 B6 vpm2 B7
Nodes Final Gap Sol. Time(sec.) 71 3.53% 3600 71 3.54% 3600 524 3.78% 3600 4541 0% 46 4777 0% 40 3317 0% 41 4179 0% 34 3599 0% 39 3399 0% 40 3371 0% 40 57636 4.44% 3600 64273 5% 3600 52815 0% 3445 60871 0% 2326 47241 0% 2392 47809 0% 2701 53579 0% 3594 335 0% 4 541 0% 6 119 0% 2 41 0% 1 29 0% 1 29 0% 0 121 0% 2 16597 0% 552 12687 0% 394 11539 0% 351 8693 0% 201 7143 0% 183 7615 0% 194 13207 0% 423
48
Appendix B { Node Selection Tables Table B.1: Comparison of Estimation Methods Problem Node bell3a bell3a bell3a bell3a bell3a bell5 bell5 bell5 bell5 bell5 bell5 bell5 bell5 bell5 blend2 blend2 blend2 blend2 blend2 blend2 blend2 blend2 blend2 blend2 dcmulti dcmulti dcmulti dcmulti dcmulti dcmulti dcmulti dcmulti dcmulti dcmulti gesa2 gesa2 gesa2
Best Projection 100 -878719 200 -878440 300 -878179 400 -878225 600 -880424 100 -9238936 200 -9229115 300 -9267804 400 -9185050 500 -9100616 600 -9125318 700 -9097684 800 -9016859 900 -9112098 100 -7.325 200 -7.927 300 -7.885 400 -7.583 500 -8.062 600 -7.492 700 -8.240 800 -8.023 900 -7.869 1000 -8.086 100 -189562 200 -189495 300 -189784 400 -189380 500 -190134 600 -189315 700 -189527 800 -190214 900 -189987 1000 -190076 100 -26017524 200 -26022342 300 -25925099
Pseudocost
Adjusted Pseudocost -875922 -875931 -876149 -876203 -875398 -875416 -875407 -875466 -877676 -877828 -8964061 -8971500 -8960409 -8965001 -9012005 -9020515 -8955816 -8981035 -8957514 -8986731 -8959881 -8969655 -8956851 -8966321 -8958806 -8962628 -8979972 -8981002 -7.080 -7.089 -7.632 -7.670 -7.749 -7.777 -7.335 -7.378 -7.818 -7.945 -7.356 -7.434 -7.454 -7.565 -7.845 -7.904 -7.601 -7.681 -7.709 -7.785 -189376 -189378 -189380 -189381 -189355 -189362 -189342 -189343 -189315 -189356 -189315 -189315 -189371 -189373 -189488 -189504 -189439 -189447 -189455 -189510 -25675289 -25800413 -25730043 -25810203 -25764748 -25889132
49
True Optimum -880401 -878430 -879861 -880637 -881583 -8988042 -8994578 -9068313 -9004336 -8998422 -8999932 -9000459 -8968500 -8997895 -8.031 -8.613 -8.213 -7.938 -8.476 -7.938 -8.104 -7.971 -8.101 -8.431 -189376 -189439 -189356 -189460 -189306 -189566 -189368 -189500 -189434 -189461 -25789927 -25802346 -25800290
Problem Node
Best Projection gesa2 400 -25897281 gesa2 500 -25824644 gesa2 600 -25896747 gesa2 700 -25917635 gesa2 800 -25936207 gesa2 900 -25887163 gesa2 1000 -25882166 gesa3 o 100 -28001002 gesa3 o 200 -27996719 gesa3 o 300 -27994832 gesa3 o 400 -28001392 gesa3 o 500 -28034124 gesa3 o 600 -28022357 gesa3 o 800 -28104094 gesa3 o 900 -27998004 l152lav 200 -4734.942 l152lav 300 -4754.593 l152lav 400 -4772.125 l152lav 900 -4772.506 misc07 100 -3953.125 misc07 200 -3032.143 misc07 300 -3903.125 misc07 400 -3884.643 misc07 500 -3062.708 mod008 10 -309.056 mod008 20 -310.239 mod008 30 -310.972 mod008 40 -311.207 mod008 50 -313.889 mod008 60 -324.805 mod008 70 -313.181 mod008 80 -306.571 mod008 90 -314.995 mod008 100 -307.198 p0201 10 -7665.000 p0201 20 -7747.000 p0201 30 -7649.091 p0201 50 -7891.957 p0201 60 -7696.364 p0201 70 -7733.788
Pseudocost -25765513 -25775169 -25775996 -25796416 -25789201 -25773484 -25779565 -28021313 -28018387 -28029647 -28007818 -28070988 -28055442 -28196811 -28057821 -4767.509 -4753.697 -4755.607 -4741.417 -3140.982 -3032.143 -3037.010 -2692.007 -2079.030 -304.843 -297.691 -304.893 -308.091 -300.209 -307.317 -306.573 -306.571 -311.049 -306.568 -7665.000 -8239.938 -8018.188 -8049.682 -8068.026 -8256.728
50
Adjusted Pseudocost -25803062 -25783165 -25797620 -25840070 -25818264 -25797243 -25796477 -28025779 -28026756 -28063520 -28014242 -28125782 -28101118 -28436973 -28294219 -4869.609 -4845.671 -4841.122 -4804.221 -3821.228 -3032.143 -3539.726 -2918.734 -2475.589 -306.856 -298.763 -306.572 -309.827 -302.141 -308.776 -307.539 -306.571 -319.783 -306.671 -7665.000 -9213.731 -9761.640 -8847.175 -8788.989 -8760.803
True Optimum -25822553 -25785232 -25797985 -25801872 -25811843 -25798712 -25802292 -28009487 -28007721 -27996090 -28007895 -28018408 -28016848 -28097912 -27991042 -4722.000 -4768.000 -4743.000 -4751.000 -3085.000 -3250.000 -3245.000 -3475.000 -2865.000 -307.000 -307.000 -307.000 -307.000 -307.000 -307.000 -323.000 -346.000 -342.000 -332.000 -7735.000 -7735.000 -7615.000 -7805.000 -7615.000 -7675.000
Problem Node p0201 p0201 pk1 pk1 pk1 pk1 pk1 pk1 pk1 pk1 pk1 pk1 qiu qiu qiu qiu qiu qiu qiu qiu qiu qiu rgn rgn rgn rgn rgn stein45 stein45 stein45 stein45 stein45 stein45 stein45 stein45 stein45 stein45 vpm2 vpm2 vpm2
Best Pseudocost Adjusted True Projection Pseudocost Optimum 80 -7712.977 -7835.500 -8119.564 -7795.000 90 -7734.773 -8244.848 -8665.251 -7665.000 100 -23.110 -0.193 -0.632 -17.000 200 -22.840 -0.704 -2.206 -15.000 300 -20.300 -2.626 -3.086 -21.000 400 -21.491 -0.426 -2.026 -12.000 500 -16.000 -0.133 -0.737 -20.000 600 -18.781 -0.835 -2.778 -18.000 700 -24.142 -1.329 -2.105 -17.000 800 -19.684 -1.372 -1.984 -17.000 900 -15.107 -0.752 -3.064 -17.000 1000 -21.869 -7.265 -7.393 -23.000 100 -29.775 279.861 -17.040 128.467 200 101.816 130.479 121.296 32.058 300 47.681 111.033 91.419 27.652 400 127.145 127.145 127.145 27.652 500 98.405 116.255 116.255 110.842 600 108.652 108.652 108.652 -0.000 700 45.176 121.674 63.336 40.870 800 -21.472 76.131 42.422 14.433 900 30.811 113.749 76.508 36.464 1000 77.237 93.212 70.041 -63.335 100 -82.451 -70.823 -71.730 -82.200 200 -81.128 -74.470 -75.284 -82.200 300 -82.236 -79.232 -79.523 -82.200 400 -79.027 -75.394 -76.602 -82.200 500 -81.736 -77.903 -80.605 -82.200 100 -32.257 -23.278 -24.364 -30.000 200 -31.714 -24.000 -24.000 -31.000 300 -31.790 -24.601 -25.357 -31.000 400 -32.819 -24.856 -25.408 -31.000 500 -31.790 -24.333 -24.333 -31.000 600 -31.790 -24.333 -24.333 -31.000 700 -31.867 -24.667 -24.667 -31.000 800 -36.800 -26.976 -27.502 -31.000 900 -35.486 -27.000 -27.000 -31.000 1000 -33.448 -25.621 -26.905 -31.000 100 -14.082 -13.326 -13.364 -13.750 200 -14.024 -13.494 -13.599 -14.500 300 -14.081 -13.303 -13.412 -13.750
51
Problem Node vpm2 vpm2 vpm2 vpm2 vpm2 vpm2 vpm2
Best Pseudocost Adjusted True Projection Pseudocost Optimum 400 -14.016 -13.538 -13.622 -14.000 500 -13.990 -13.402 -13.569 -14.250 600 -13.986 -13.554 -13.727 -14.500 700 -14.085 -13.468 -13.677 -14.500 800 -14.548 -14.062 -14.216 -14.250 900 -14.528 -14.079 -14.173 -14.750 1000 -14.161 -13.637 -13.791 -14.000
52
Table B.2: Comparison of Node Selection Methods Problem Selection Method Nodes Time Best Sol. Final Gap 10teams N1 450 1071 0% 0% 10teams N2 3311 3600 (N/A) (N/A) 10teams N3 3315 3600 (N/A) (N/A) 10teams N4 240 612 0% 0% 10teams N5 7254 3600 0% 0.758% 10teams N6 240 611 0% 0% 10teams N7 4570 3600 0.649% 1.398% 10teams N8 4501 3600 (N/A) (N/A) 10teams N9 290 677 0% 0% 10teams N10 490 1011 0% 0% 10teams N11 6636 3600 (N/A) (N/A) 10teams N12 261 482 0% 0% 10teams N13 652 622 0% 0% air03 N1 3 62 0% 0% air03 N2 3 62 0% 0% air03 N3 3 62 0% 0% air03 N4 3 62 0% 0% air03 N5 3 62 0% 0% air03 N6 3 62 0% 0% air03 N7 3 62 0% 0% air03 N8 3 63 0% 0% air03 N9 3 62 0% 0% air03 N10 3 62 0% 0% air03 N11 3 62 0% 0% air03 N12 3 62 0% 0% air03 N13 3 62 0% 0% air04 N1 701 3475 0% 0% air04 N2 1505 3355 0% 0% air04 N3 854 3600 0.0196% 0.116% air04 N4 683 3600 0% 0.740% air04 N5 845 2915 0% 0% air04 N6 684 3600 0% 0.740% air04 N7 891 3601 0.00178% 0.742% air04 N8 1449 3601 0% 0.988% air04 N9 862 3600 0.00178% 0.232% air04 N10 499 3605 0.203% 0.554% air04 N11 1361 3033 0% 0% air04 N12 901 3600 0% 0.902% air04 N13 825 3158 0% 0% air05 N1 520 3600 3.58% 4.031%
53
Problem Selection Method air05 N2 air05 N3 air05 N4 air05 N5 air05 N6 air05 N7 air05 N8 air05 N9 air05 N10 air05 N11 air05 N12 air05 N13 bell3a N1 bell3a N2 bell3a N3 bell3a N4 bell3a N5 bell3a N6 bell3a N7 bell3a N8 bell3a N9 bell3a N10 bell3a N11 bell3a N12 bell3a N13 bell5 N1 bell5 N2 bell5 N3 bell5 N4 bell5 N5 bell5 N6 bell5 N7 bell5 N8 bell5 N9 bell5 N10 bell5 N11 bell5 N12 bell5 N13 blend2 N1 blend2 N2 blend2 N3
Nodes 2193 843 1154 2030 1284 1390 2461 1501 2193 2463 2337 2193 38421 23755 38421 173626 34677 173626 148294 20766 39292 38712 27673 42306 42297 23683 1098601 23683 149494 981577 635000 553000 1092553 40723 153075 1103324 27791 125064 2365 31424 2932
54
Time Best Sol. Final Gap 2778 0% 0% 3600 0% 0.227% 2728 0% 0% 3491 0% 0% 2689 0% 0% 2962 0% 0% 3002 0% 0% 2730 0% 0% 2780 0% 0% 2966 0% 0% 3040 0% 0% 2772 0% 0% 153 0% 0% 102 0% 0% 153 0% 0% 2675 0% 0% 142 0% 0% 742 0% 0% 641 0% 0% 107 0% 0% 360 0% 0% 288 0% 0% 126 0% 0% 356 0% 0% 336 0% 0% 90 0% 0% 3600 0.846% 1.502% 90 0% 0% 3600 0.109% 4.097% 3600 0.738% 1.396% XXX 0.109% 4.097% XXX 0.189% 0.856% 3600 0.283% 0.681% 339 0% 0% 3600 0% 0.019% 3600 0.846% 1.502% 122 0% 0% 3600 0.022% 0.691% 292 0% 0% 1674 0% 0% 324 0% 0%
Problem Selection Method blend2 N4 blend2 N5 blend2 N6 blend2 N7 blend2 N8 blend2 N9 blend2 N10 blend2 N11 blend2 N12 blend2 N13 cap6000 N1 cap6000 N2 cap6000 N3 cap6000 N4 cap6000 N5 cap6000 N6 cap6000 N7 cap6000 N8 cap6000 N9 cap6000 N10 cap6000 N11 cap6000 N12 cap6000 N13 danoint N1 danoint N2 danoint N3 danoint N4 danoint N5 danoint N6 danoint N7 danoint N8 danoint N9 danoint N10 danoint N11 danoint N12 danoint N13 dcmulti N1 dcmulti N2 dcmulti N3 dcmulti N4 dcmulti N5
Nodes 9788 4127 9788 3509 1788 4041 3872 2640 5732 3467 4099 21171 4099 8884 7423 8884 8758 16116 6860 11403 19485 15411 14751 561 4521 561 477 845 477 1058 2223 1656 1798 4964 1923 3704 967 5563 967 3906 2081
55
Time Best Sol. Final Gap 592 0% 0% 203 0% 0% 578 0% 0% 161 0% 0% 104 0% 0% 441 0% 0% 296 0% 0% 150 0% 0% 278 0% 0% 149 0% 0% 1851 0% 0% 3301 0% 0% 1851 0% 0% 2372 0% 0% 3600 0.000245% 0.004% 2328 0% 0% 2294 0% 0% 3600 0.00322% 0.004% 3284 0% 0% 3077 0% 0% 3600 0.00216% 0.009% 3600 0% 0.002% 3067 0% 0% 3600 1.264% 5.330% 3600 1.264% 5.784% 3600 1.264% 5.330% 3600 1.264% 5.729% 3600 1.264% 5.729% 3600 1.264% 5.729% 3600 1.264% 5.729% 3600 0% 4.323% 3600 0% 4.191% 3600 0.918% 5.123% 3600 1.264% 5.784% 3600 0% 4.407% 3600 0% 4.533% 38 0% 0% 120 0% 0% 38 0% 0% 97 0% 0% 51 0% 0%
Problem Selection Method Nodes Time Best Sol. Final Gap dcmulti N6 3906 96 0% 0% dcmulti N7 3659 85 0% 0% dcmulti N8 3259 77 0% 0% dcmulti N9 1176 36 0% 0% dcmulti N10 5283 117 0% 0% dcmulti N11 3365 79 0% 0% dcmulti N12 4364 102 0% 0% dcmulti N13 4397 103 0% 0% dsbmip N1 150 55 0% 0% dsbmip N2 1290 219 0% 0% dsbmip N3 579 156 0% 0% dsbmip N4 40 25 0% 0% dsbmip N5 151 50 0% 0% dsbmip N6 40 25 0% 0% dsbmip N7 129 55 0% 0% dsbmip N8 186 72 0% 0% dsbmip N9 150 69 0% 0% dsbmip N10 321 118 0% 0% dsbmip N11 220 76 0% 0% dsbmip N12 104 50 0% 0% dsbmip N13 293 95 0% 0% egout N1 3 0 0% 0% egout N2 3 0 0% 0% egout N3 3 0 0% 0% egout N4 3 0 0% 0% egout N5 3 0 0% 0% egout N6 3 0 0% 0% egout N7 3 0 0% 0% egout N8 3 0 0% 0% egout N9 3 0 0% 0% egout N10 3 0 0% 0% egout N11 3 0 0% 0% egout N12 3 0 0% 0% egout N13 3 0 0% 0% enigma N1 6887 112 0% 0% enigma N2 4657 33 0% 0% enigma N3 8432 65 0% 0% enigma N4 518 11 0% 0% enigma N5 4491 79 0% 0% enigma N6 518 11 0% 0% enigma N7 2480 42 0% 0%
56
Problem Selection Method Nodes Time Best Sol. Final Gap enigma N8 2256 39 0% 0% enigma N9 1080 23 0% 0% enigma N10 949 22 0% 0% enigma N11 2256 39 0% 0% enigma N12 15433 158 0% 0% enigma N13 3638 56 0% 0% fast0507 N1 32 3600 5.747% 6.313% fast0507 N2 54 3600 6.322% 6.948% fast0507 N3 32 3600 5.747% 6.313% fast0507 N4 33 3600 10.345% 10.220% fast0507 N5 32 3600 2.874% 3.733% fast0507 N6 33 3600 10.345% 10.220% fast0507 N7 33 3600 9.770% 9.750% fast0507 N8 55 3600 4.598% 5.415% fast0507 N9 40 3600 10.345% 10.214% fast0507 N10 37 3600 10.345% 10.219% fast0507 N11 54 3600 4.598% 5.415% fast0507 N12 39 3600 7.471% 7.887% fast0507 N13 40 3600 5.172% 5.887% �ber N1 35 13 0% 0% �ber N2 105 24 0% 0% �ber N3 35 13 0% 0% �ber N4 58 18 0% 0% �ber N5 45 13 0% 0% �ber N6 58 17 0% 0% �ber N7 79 20 0% 0% �ber N8 95 25 0% 0% �ber N9 105 24 0% 0% �ber N10 105 24 0% 0% �ber N11 95 25 0% 0% �ber N12 95 25 0% 0% �ber N13 95 26 0% 0% �xnet6 N1 79 15 0% 0% �xnet6 N2 71 10 0% 0% �xnet6 N3 79 15 0% 0% �xnet6 N4 71 13 0% 0% �xnet6 N5 91 14 0% 0% �xnet6 N6 71 13 0% 0% �xnet6 N7 70 13 0% 0% �xnet6 N8 79 16 0% 0% �xnet6 N9 86 15 0% 0%
57
Problem Selection Method �xnet6 N10 �xnet6 N11 �xnet6 N12 �xnet6 N13 �ugpl N1 �ugpl N2 �ugpl N3 �ugpl N4 �ugpl N5 �ugpl N6 �ugpl N7 �ugpl N8 �ugpl N9 �ugpl N10 �ugpl N11 �ugpl N12 �ugpl N13 gen N1 gen N2 gen N3 gen N4 gen N5 gen N6 gen N7 gen N8 gen N9 gen N10 gen N11 gen N12 gen N13 gesa2 N1 gesa2 N2 gesa2 N3 gesa2 N4 gesa2 N5 gesa2 N6 gesa2 N7 gesa2 N8 gesa2 N9 gesa2 N10 gesa2 N11
Nodes 71 76 75 75 4305 4091 4167 3551 2675 3551 3426 4112 3511 3665 6290 3846 3580 3 3 3 3 3 3 3 3 3 3 3 3 3 23169 50309 23146 38871 46188 40983 43730 46169 21116 23062 46842
58
Time Best Sol. Final Gap 13 0% 0% 13 0% 0% 11 0% 0% 12 0% 0% 8 0% 0% 5 0% 0% 7 0% 0% 6 0% 0% 4 0% 0% 5 0% 0% 5 0% 0% 7 0% 0% 7 0% 0% 7 0% 0% 10 0% 0% 6 0% 0% 6 0% 0% 2 0% 0% 2 0% 0% 2 0% 0% 2 0% 0% 2 0% 0% 2 0% 0% 2 0% 0% 2 0% 0% 2 0% 0% 2 0% 0% 2 0% 0% 2 0% 0% 2 0% 0% 3600 0.316% 0.329% 3600 0.489% 1.331% 3600 0.316% 0.329% 3600 0% 0.559% 3600 0% 0.538% 3600 0% 0.559% 3600 0.079% 0.927% 3600 0% 0.205% 3600 0.316% 0.331% 3600 0.306% 0.329% 3600 0.508% 1.351%
Problem Selection Method gesa2 N12 gesa2 N13 gesa2 o N1 gesa2 o N2 gesa2 o N3 gesa2 o N4 gesa2 o N5 gesa2 o N6 gesa2 o N7 gesa2 o N8 gesa2 o N9 gesa2 o N10 gesa2 o N11 gesa2 o N12 gesa2 o N13 gesa3 N1 gesa3 N2 gesa3 N3 gesa3 N4 gesa3 N5 gesa3 N6 gesa3 N7 gesa3 N8 gesa3 N9 gesa3 N10 gesa3 N11 gesa3 N12 gesa3 N13 gesa3 o N1 gesa3 o N2 gesa3 o N3 gesa3 o N4 gesa3 o N5 gesa3 o N6 gesa3 o N7 gesa3 o N8 gesa3 o N9 gesa3 o N10 gesa3 o N11 gesa3 o N12 gesa3 o N13
Nodes 45851 46343 22388 49978 22411 40565 40033 41847 45317 45660 21227 27676 46115 42973 45965 839 4205 839 928 869 928 1031 803 726 4205 747 682 1754 971 1041 971 973 937 973 895 985 1041 1041 993 1039 1039
59
Time Best Sol. Final Gap 3600 0.012% 0.548% 3600 0% 0.849% 3600 0.220% 0.229% 3600 0.002% 0.950% 3600 0.220% 0.229% 3600 0.009% 0.698% 3195 0% 0% 3600 0.009% 0.698% 3600 0.008% 0.956% 3600 0.089% 0.563% 3600 0.101% 0.115% 3600 0.014% 0.031% 3600 0.013% 0.961% 3600 0.011% 0.727% 3600 0.011% 0.958% 142 0% 0% 362 0% 0% 141 0% 0% 110 0% 0% 99 0% 0% 110 0% 0% 114 0% 0% 122 0% 0% 123 0% 0% 362 0% 0% 94 0% 0% 84 0% 0% 170 0% 0% 142 0% 0% 116 0% 0% 140 0% 0% 116 0% 0% 118 0% 0% 116 0% 0% 112 0% 0% 126 0% 0% 117 0% 0% 117 0% 0% 120 0% 0% 122 0% 0% 122 0% 0%
Problem Selection Method gt2 N1 gt2 N2 gt2 N3 gt2 N4 gt2 N5 gt2 N6 gt2 N7 gt2 N8 gt2 N9 gt2 N10 gt2 N11 gt2 N12 gt2 N13 harp2 N1 harp2 N2 harp2 N3 harp2 N4 harp2 N5 harp2 N6 harp2 N7 harp2 N8 harp2 N9 harp2 N10 harp2 N11 harp2 N12 harp2 N13 khb05250 N1 khb05250 N2 khb05250 N3 khb05250 N4 khb05250 N5 khb05250 N6 khb05250 N7 khb05250 N8 khb05250 N9 khb05250 N10 khb05250 N11 khb05250 N12 khb05250 N13 l152lav N1 l152lav N2
Nodes 318 776554 262800 413 667404 413 110 408 202 202 604882 79 71 2550 21397 3755 12935 17146 13455 14240 2264 4164 4277 18466 9414 18958 15 15 15 15 15 15 15 15 15 15 15 15 15 337 402
60
Time 3 3600 1281 4 3600 4 1 4 3 3 3600 1 1 3600 3600 3600 3600 3600 3600 3600 3600 3600 3600 3600 3600 3600 3 3 3 3 3 3 3 3 3 3 3 3 3 111 94
Best Sol. Final Gap 0% 0% 111.471% 69.928% 0% 0% 0% 0% 63.229% 46.793% 0% 0% 0% 0% 0% 0% 0% 0% 0% 0% 45.332% 40.584% 0% 0% 0% 0% 0.404% 0.453% 0.116% 0.549% 0.420% 0.424% 0% 0.432% 2.032% 2.386% 0% 0.432% 0.173% 0.606% 0.407% 0.486% 0.389% 0.458% 0.270% 0.349% 0.929% 1.317% 0.023% 0.456% 0% 0.432% 0% 0% 0% 0% 0% 0% 0% 0% 0% 0% 0% 0% 0% 0% 0% 0% 0% 0% 0% 0% 0% 0% 0% 0% 0% 0% 0% 0% 0% 0%
Problem Selection Method Nodes Time Best Sol. Final Gap l152lav N3 337 111 0% 0% l152lav N4 637 170 0% 0% l152lav N5 441 166 0% 0% l152lav N6 637 169 0% 0% l152lav N7 434 135 0% 0% l152lav N8 677 130 0% 0% l152lav N9 964 191 0% 0% l152lav N10 402 94 0% 0% l152lav N11 495 104 0% 0% l152lav N12 2836 423 0% 0% l152lav N13 810 146 0% 0% lseu N1 105 3 0% 0% lseu N2 105 2 0% 0% lseu N3 99 3 0% 0% lseu N4 115 3 0% 0% lseu N5 153 3 0% 0% lseu N6 115 2 0% 0% lseu N7 159 4 0% 0% lseu N8 139 3 0% 0% lseu N9 89 2 0% 0% lseu N10 105 2 0% 0% lseu N11 139 3 0% 0% lseu N12 79 2 0% 0% lseu N13 123 3 0% 0% misc03 N1 371 12 0% 0% misc03 N2 387 9 0% 0% misc03 N3 371 12 0% 0% misc03 N4 517 16 0% 0% misc03 N5 437 13 0% 0% misc03 N6 517 16 0% 0% misc03 N7 385 11 0% 0% misc03 N8 437 10 0% 0% misc03 N9 401 12 0% 0% misc03 N10 387 9 0% 0% misc03 N11 437 10 0% 0% misc03 N12 483 12 0% 0% misc03 N13 437 10 0% 0% misc06 N1 53 9 0% 0% misc06 N2 298 17 0% 0% misc06 N3 53 9 0% 0% misc06 N4 60 7 0% 0%
61
Problem Selection Method misc06 N5 misc06 N6 misc06 N7 misc06 N8 misc06 N9 misc06 N10 misc06 N11 misc06 N12 misc06 N13 misc07 N1 misc07 N2 misc07 N3 misc07 N4 misc07 N5 misc07 N6 misc07 N7 misc07 N8 misc07 N9 misc07 N10 misc07 N11 misc07 N12 misc07 N13 mitre N1 mitre N2 mitre N3 mitre N4 mitre N5 mitre N6 mitre N7 mitre N8 mitre N9 mitre N10 mitre N11 mitre N12 mitre N13 mod008 N1 mod008 N2 mod008 N3 mod008 N4 mod008 N5 mod008 N6
Nodes 61 60 61 96 56 73 85 58 57 39657 46249 39657 49055 40861 49055 44669 51593 41715 26613 49010 43749 52561 38 40 36 35 36 35 35 36 49 40 36 36 36 101 105 101 105 103 105
62
Time Best Sol. Final Gap 7 0% 0% 7 0% 0% 7 0% 0% 10 0% 0% 8 0% 0% 10 0% 0% 9 0% 0% 7 0% 0% 7 0% 0% 3449 0% 0% 1693 0% 0% 3448 0% 0% 3266 0% 0% 2226 0% 0% 2846 0% 0% 2270 0% 0% 1980 0% 0% 2598 0% 0% 1175 0% 0% 1826 0% 0% 1899 0% 0% 1934 0% 0% 221 0% 0% 214 0% 0% 209 0% 0% 209 0% 0% 207 0% 0% 209 0% 0% 209 0% 0% 209 0% 0% 224 0% 0% 215 0% 0% 208 0% 0% 207 0% 0% 209 0% 0% 9 0% 0% 8 0% 0% 9 0% 0% 8 0% 0% 9 0% 0% 8 0% 0%
Problem Selection Method Nodes Time Best Sol. Final Gap mod008 N7 105 8 0% 0% mod008 N8 99 9 0% 0% mod008 N9 105 8 0% 0% mod008 N10 105 8 0% 0% mod008 N11 99 9 0% 0% mod008 N12 99 9 0% 0% mod008 N13 99 9 0% 0% mod010 N1 17 26 0% 0% mod010 N2 37 25 0% 0% mod010 N3 17 26 0% 0% mod010 N4 45 46 0% 0% mod010 N5 15 25 0% 0% mod010 N6 45 46 0% 0% mod010 N7 43 36 0% 0% mod010 N8 27 23 0% 0% mod010 N9 37 25 0% 0% mod010 N10 37 25 0% 0% mod010 N11 27 23 0% 0% mod010 N12 27 23 0% 0% mod010 N13 27 23 0% 0% mod011 N1 347 3600 0.666% 5.339% mod011 N2 1594 3600 1.796% 14.880% mod011 N3 346 3600 0.666% 5.342% mod011 N4 337 3600 0.826% 8.226% mod011 N5 1040 3600 0.826% 12.587% mod011 N6 337 3600 0.826% 8.226% mod011 N7 474 3600 0.916% 9.029% mod011 N8 1426 3600 2.027% 15.152% mod011 N9 422 3600 1.603% 6.304% mod011 N10 651 3600 0.600% 6.867% mod011 N11 1441 3600 2.027% 15.152% mod011 N12 624 3600 1.181% 10.399% mod011 N13 764 3600 0.666% 10.201% modglob N1 569 96 0% 0% modglob N2 99287 3600 2.15% 3.131% modglob N3 569 95 0% 0% modglob N4 357 30 0% 0% modglob N5 36624 3600 2.7% 3.524% modglob N6 357 30 0% 0% modglob N7 1089 76 0% 0% modglob N8 9838 2157 0.0615% 0%
63
Problem Selection Method modglob N9 modglob N10 modglob N11 modglob N12 modglob N13 noswot N1 noswot N2 noswot N3 noswot N4 noswot N5 noswot N6 noswot N7 noswot N8 noswot N9 noswot N10 noswot N11 noswot N12 noswot N13 p0033 N1 p0033 N2 p0033 N3 p0033 N4 p0033 N5 p0033 N6 p0033 N7 p0033 N8 p0033 N9 p0033 N10 p0033 N11 p0033 N12 p0033 N13 p0201 N1 p0201 N2 p0201 N3 p0201 N4 p0201 N5 p0201 N6 p0201 N7 p0201 N8 p0201 N9 p0201 N10
Nodes 703 1174 67942 442 867 66336 287126 177425 116427 180312 189713 239744 60689 50852 54369 192088 63430 176142 7 14 7 7 12 7 7 16 14 14 16 16 16 87 127 87 95 112 95 89 105 87 127
64
Time Best Sol. Final Gap 138 0% 0% 204 0% 0% 3600 0.283% 1.324% 29 0% 0% 65 0% 0% 3600 4.651% 4.878% 3600 4.651% 4.878% 3600 4.651% 3.371% 3600 4.651% 4.878% 3600 6.977% 7.500% 3600 4.651% 4.878% 3600 4.651% 4.878% 3600 6.977% 7.500% 3600 4.651% 4.878% 3600 4.651% 4.878% 3600 4.651% 4.878% 3600 4.651% 4.878% 3600 4.651% 4.878% 0 0% 0% 0 0% 0% 0 0% 0% 0 0% 0% 0 0% 0% 0 0% 0% 0 0% 0% 0 0% 0% 0 0% 0% 0 0% 0% 0 0% 0% 0 0% 0% 0 0% 0% 8 0% 0% 8 0% 0% 8 0% 0% 8 0% 0% 9 0% 0% 8 0% 0% 6 0% 0% 7 0% 0% 6 0% 0% 8 0% 0%
Problem Selection Method Nodes Time Best Sol. Final Gap p0201 N11 105 7 0% 0% p0201 N12 105 7 0% 0% p0201 N13 119 7 0% 0% p0282 N1 33 5 0% 0% p0282 N2 35 4 0% 0% p0282 N3 33 5 0% 0% p0282 N4 33 4 0% 0% p0282 N5 51 5 0% 0% p0282 N6 33 4 0% 0% p0282 N7 31 5 0% 0% p0282 N8 37 4 0% 0% p0282 N9 35 4 0% 0% p0282 N10 35 4 0% 0% p0282 N11 37 5 0% 0% p0282 N12 37 5 0% 0% p0282 N13 37 5 0% 0% p0548 N1 5 1 0% 0% p0548 N2 50 4 0% 0% p0548 N3 5 1 0% 0% p0548 N4 9 1 0% 0% p0548 N5 5 1 0% 0% p0548 N6 9 1 0% 0% p0548 N7 9 2 0% 0% p0548 N8 50 4 0% 0% p0548 N9 12 2 0% 0% p0548 N10 16 2 0% 0% p0548 N11 50 4 0% 0% p0548 N12 12 2 0% 0% p0548 N13 16 3 0% 0% p2756 N1 39 34 0% 0% p2756 N2 431 103 0% 0% p2756 N3 39 34 0% 0% p2756 N4 66 44 0% 0% p2756 N5 369 106 0% 0% p2756 N6 66 44 0% 0% p2756 N7 146 49 0% 0% p2756 N8 1306 374 0% 0% p2756 N9 59 47 0% 0% p2756 N10 251 87 0% 0% p2756 N11 1297 343 0% 0% p2756 N12 56 34 0% 0%
65
Problem Selection Method p2756 N13 pk1 N1 pk1 N2 pk1 N3 pk1 N4 pk1 N5 pk1 N6 pk1 N7 pk1 N8 pk1 N9 pk1 N10 pk1 N11 pk1 N12 pk1 N13 pp08a N1 pp08a N2 pp08a N3 pp08a N4 pp08a N5 pp08a N6 pp08a N7 pp08a N8 pp08a N9 pp08a N10 pp08a N11 pp08a N12 pp08a N13 pp08aCUTS N1 pp08aCUTS N2 pp08aCUTS N3 pp08aCUTS N4 pp08aCUTS N5 pp08aCUTS N6 pp08aCUTS N7 pp08aCUTS N8 pp08aCUTS N9 pp08aCUTS N10 pp08aCUTS N11 pp08aCUTS N12 pp08aCUTS N13 qiu N1
Nodes 223 60336 99208 60344 40038 89867 52472 53292 67081 41121 45924 112867 118310 121653 64136 183600 64147 51687 143848 77151 115009 190906 64694 128733 189001 162219 178327 55400 144271 55407 50147 127428 73080 98183 150225 59422 70251 149317 130325 138787 3201
66
Time 58 3600 3600 3600 3600 3600 3600 3600 3600 3600 3600 3600 3600 3600 3600 3600 3600 3600 3600 3600 3600 3600 3600 3600 3600 3600 3600 3600 3600 3600 3600 3600 3600 3600 3600 3600 3600 3600 3600 3600 3600
Best Sol. Final Gap 0% 0% 0% 34.923% 36.364% 100% 0% 34.921% 0% 83.690% 18.182% 100% 0% 82.855% 18.182% 100% 0% 59.655% 9.091% 46.882% 0% 40.443% 36.364% 100% 0% 100% 9.091% 100% 3.265% 8.274% 0.408% 25.737% 3.265% 8.274% 0.408% 14.066% 1.361% 25.186% 0.408% 14.066% 0% 19.628% 0.272% 25.636% 1.224% 8.466% 1.361% 11.909% 0.272% 25.636% 1.497% 19.968% 0% 20.722% 3.129% 8.314% 2.177% 27.023% 3.129% 8.313% 0.408% 13.686% 1.633% 25.386% 0% 13.221% 0% 19.628% 0.408% 25.737% 0.136% 8.033% 1.497% 10.197% 0.408% 25.737% 1.361% 18.032% 0.272% 21.350% 0% 115.106%
Problem Selection Method qiu N2 qiu N3 qiu N4 qiu N5 qiu N6 qiu N7 qiu N8 qiu N9 qiu N10 qiu N11 qiu N12 qiu N13 qnet1 N1 qnet1 N2 qnet1 N3 qnet1 N4 qnet1 N5 qnet1 N6 qnet1 N7 qnet1 N8 qnet1 N9 qnet1 N10 qnet1 N11 qnet1 N12 qnet1 N13 qnet1 o N1 qnet1 o N2 qnet1 o N3 qnet1 o N4 qnet1 o N5 qnet1 o N6 qnet1 o N7 qnet1 o N8 qnet1 o N9 qnet1 o N10 qnet1 o N11 qnet1 o N12 qnet1 o N13 rentacar N1 rentacar N2 rentacar N3
Nodes 19331 3201 10163 11591 10177 11213 15339 4040 12235 19423 15221 17682 73 89 73 75 180 75 104 63 89 89 84 59 59 291 285 291 321 419 321 298 271 374 285 271 275 271 21 47 21
67
Time Best Sol. 3600 151.747% 3600 0% 3600 0% 3600 0% 3600 0% 3481 0% 3600 0% 3600 0% 2988 0% 3600 151.747% 3600 0% 3600 0% 35 0% 24 0% 35 0% 27 0% 47 0% 27 0% 27 0% 21 0% 24 0% 24 0% 21 0% 19 0% 19 0% 43 0% 24 0% 43 0% 43 0% 44 0% 42 0% 32 0% 23 0% 45 0% 24 0% 23 0% 26 0% 23 0% 102 0% 116 0% 102 0%
Final Gap 1123.264% 115.106% 379.090% 405.558% 379.090% 0% 258.406% 112.739% 0% 1123.264% 370.153% 379.090% 0% 0% 0% 0% 0% 0% 0% 0% 0% 0% 0% 0% 0% 0% 0% 0% 0% 0% 0% 0% 0% 0% 0% 0% 0% 0% 0% 0% 0%
Problem Selection Method rentacar N4 rentacar N5 rentacar N6 rentacar N7 rentacar N8 rentacar N9 rentacar N10 rentacar N11 rentacar N12 rentacar N13 rgn N1 rgn N2 rgn N3 rgn N4 rgn N5 rgn N6 rgn N7 rgn N8 rgn N9 rgn N10 rgn N11 rgn N12 rgn N13 rout N1 rout N2 rout N3 rout N4 rout N5 rout N6 rout N7 rout N8 rout N9 rout N10 rout N11 rout N12 rout N13 set1ch N1 set1ch N2 set1ch N3 set1ch N4 set1ch N5
Nodes 17 25 17 17 37 22 39 37 21 37 2189 2053 2189 2119 1987 2119 2051 2209 2143 2187 2085 2175 2141 2940 33620 3406 3502 14503 3504 4776 6338 4446 4652 36215 7248 10068 12311 64360 11997 11861 47331
68
Time 78 95 78 77 116 112 123 115 92 115 29 20 29 30 22 28 25 25 27 27 21 26 24 3600 3600 3600 3600 3600 3600 3600 3600 3600 3600 3600 3600 3600 3600 3600 3600 3600 3600
Best Sol. Final Gap 0% 0% 0% 0% 0% 0% 0% 0% 0% 0% 0% 0% 0% 0% 0% 0% 0% 0% 0% 0% 0% 0% 0% 0% 0% 0% 0% 0% 0% 0% 0% 0% 0% 0% 0% 0% 0% 0% 0% 0% 0% 0% 0% 0% 0% 0% 1.462% 5.555% 23.625% 26.294% 1.260% 5.851% 8.161% 14.751% 0% 8.852% 8.161% 14.751% 0% 7.794% 3.867% 8.383% 4.422% 8.420% 3.780% 7.695% 13.711% 19.867% 0.151% 7.153% 1.260% 8.116% (N/A) (N/A) 10.826% 32.728% 12.406% 24.865% (N/A) (N/A) 3.177% 21.117%
Problem Selection Method set1ch N6 set1ch N7 set1ch N8 set1ch N9 set1ch N10 set1ch N11 set1ch N12 set1ch N13 seymour N1 seymour N2 seymour N3 seymour N4 seymour N5 seymour N6 seymour N7 seymour N8 seymour N9 seymour N10 seymour N11 seymour N12 seymour N13 stein27 N1 stein27 N2 stein27 N3 stein27 N4 stein27 N5 stein27 N6 stein27 N7 stein27 N8 stein27 N9 stein27 N10 stein27 N11 stein27 N12 stein27 N13 stein45 N1 stein45 N2 stein45 N3 stein45 N4 stein45 N5 stein45 N6 stein45 N7
Nodes 11962 11964 54687 12181 12331 54682 12461 13186 342 2956 435 306 2613 307 271 2917 300 333 2914 302 328 3389 3361 3389 3341 3345 3341 3185 3269 3351 3325 3269 3519 3253 48569 51188 48569 57461 48317 57461 49401
69
Time Best Sol. Final Gap 3600 (N/A) (N/A) 3600 5.140% 25.390% 3600 7.606% 29.667% 3600 8.245% 24.968% 3600 7.130% 24.310% 3600 7.606% 29.667% 3600 7.065% 26.714% 3600 6.789% 26.582% 3600 (N/A) (N/A) 3600 1.418% 5.863% 3600 3.073% 6.698% 3600 (N/A) (N/A) 3600 3.546% 7.798% 3600 (N/A) (N/A) 3600 (N/A) (N/A) 3600 1.418% 5.863% 3600 (N/A) (N/A) 3600 (N/A) (N/A) 3600 1.418% 5.863% 3600 (N/A) (N/A) 3600 (N/A) (N/A) 42 0% 0% 21 0% 0% 42 0% 0% 36 0% 0% 29 0% 0% 34 0% 0% 29 0% 0% 21 0% 0% 25 0% 0% 21 0% 0% 20 0% 0% 25 0% 0% 21 0% 0% 2837 0% 0% 947 0% 0% 2840 0% 0% 1707 0% 0% 1312 0% 0% 1592 0% 0% 1068 0% 0%
Problem Selection Method stein45 N8 stein45 N9 stein45 N10 stein45 N11 stein45 N12 stein45 N13 vpm1 N1 vpm1 N2 vpm1 N3 vpm1 N4 vpm1 N5 vpm1 N6 vpm1 N7 vpm1 N8 vpm1 N9 vpm1 N10 vpm1 N11 vpm1 N12 vpm1 N13 vpm2 N1 vpm2 N2 vpm2 N3 vpm2 N4 vpm2 N5 vpm2 N6 vpm2 N7 vpm2 N8 vpm2 N9 vpm2 N10 vpm2 N11 vpm2 N12 vpm2 N13
Nodes Time Best Sol. Final Gap 49262 924 0% 0% 49609 1019 0% 0% 49663 1065 0% 0% 49262 921 0% 0% 48483 936 0% 0% 49777 941 0% 0% 59 1 0% 0% 61 1 0% 0% 59 1 0% 0% 57 1 0% 0% 77 2 0% 0% 57 1 0% 0% 91 2 0% 0% 61 1 0% 0% 61 1 0% 0% 61 1 0% 0% 61 1 0% 0% 77 2 0% 0% 61 1 0% 0% 9453 278 0% 0% 17199 308 0% 0% 9453 278 0% 0% 7460 203 0% 0% 6923 152 0% 0% 7460 194 0% 0% 11931 312 0% 0% 11956 367 0% 0% 9622 285 0% 0% 10279 296 0% 0% 15417 296 0% 0% 8210 175 0% 0% 7909 156 0% 0%
70