58, 270 –281 (2000) Copyright © 2000 by the Society of Toxicology
TOXICOLOGICAL SCIENCES
A Computationally Based Identification Algorithm for Estrogen Receptor Ligands: Part 2. Evaluation of a hER␣ Binding Affinity Model O. G. Mekenyan,* V. Kamenska,* P. K. Schmieder,† G. T. Ankley,† and S. P. Bradbury† ,1 *Bourgas University “Prof. As. Zlatarov,” Laboratory of Mathematical Chemistry, Department of Physical Chemistry, 118010 Bourgas, Bulgaria; and †U.S. Environmental Protection Agency, National Health and Environmental Effects Research Laboratory, Mid-Continent Ecology Division, 6201 Congdon Boulevard, Duluth, Minnesota 55804 Received April 17, 2000; accepted July 31, 2000
The objective of this study was to evaluate the capability of an expert system described in the previous paper (S. Bradbury et al., Toxicol. Sci. 58, 253–269) to identify the potential for chemicals to act as ligands of mammalian estrogen receptors (ERs). The basis of the expert system was a structure activity relationship (SAR) model, based on relative binding affinity (RBA) values for steroidal and nonsteroidal chemicals derived from human ER␣ (hER␣) competitive binding assays. The expert system enables categorization of chemicals into (RBA ranges of < 0.1, 0.1 to 1, 1 to 10, 10 to 100, and >150% relative to 17-estradiol. In the current analysis, the algorithm was evaluated with respect to predicting RBAs of chemicals assayed with ERs from MCF7 cells, and mouse and rat uterine preparations. The best correspondence between predicted and observed RBA ranges was obtained with MCF7 cells. The agreement between predictions from the expert system and data from binding assays with mouse and rat ER(s) were less reliable, especially for chemicals with RBAs less than 10%. Prediction errors often were false positives, i.e., predictions of greater than observed RBA values. While discrepancies were likely due, in part, to species-specific variations in ER structure and ligand binding affinity, a systematic bias in structural characteristics of chemicals in the hER␣ training set, compared to the rodent evaluation data sets, also contributed to prediction errors. False-positive predictions were typically associated with ligands that had shielded electronegative sites. Ligands with these structural characteristics were not well represented in the training set used to derive the expert system. Inclusion of a shielding criterion into the original expert system significantly increased the accuracy of RBA predictions. With this additional structural requirement, 38 of 46 compounds with measured RBA values greater than 10% in hER␣, MCF7, and rodent uterine preparations were correctly categorized. Of the remaining 129 compounds in the combined data sets, RBA values for 65 compounds were correctly predicted, with 47 of the incorrect predictions being false positives. Based upon this exploratory analysis, the modeling approach, combined with a high-quality training set of RBA values derived from a diverse set of chemical structures, could provide a credible tool for This article has been reviewed according to EPA guidelines. Mention of modeling or modeling approaches does not indicate endorsement by the EPA. 1 To whom correspondence should be addressed. Fax: (218) 529-5015. E-mail:
[email protected].
prioritizing chemicals with moderate to high ER binding affinity for subsequent in vitro or in vivo assessments. Key Words: structure activity relationships; expert systems; mammalian estrogen receptors; binding affinity; estrogen receptor ligands.
Structure activity relationships (SARs) for predicting ligand-hormone receptor binding affinity have been proposed as screening tools to help prioritize untested compounds for more intensive investigations to assess potential effects on steroid signaling pathways (Ankley et al., 1997; Bradbury et al., 1998). Mekenyan et al. (1997, 1999) recently described the COmmon REactivity PAttern (COREPA) algorithm, which was developed specifically for this purpose. The algorithm is a 3-dimensional (3-D) SAR technique that assesses conformational flexibility of ligands. It permits identification and quantification of specific global and local stereoelectronic characteristics associated with the biological activity of a chemical, without the need to specify a predetermined toxicophore or the alignment of conformers to a lead compound. In the companion paper, Bradbury et al. (2000) described a prototypical expert system for predicting human estrogen receptor alpha (hER␣) binding affinity based on the COREPA algorithm. In that study, they defined stereoelectronic requirements associated with binding affinity of 45 steroidal and nonsteroidal ligands to the receptor. Reactivity patterns for hER␣ relative binding affinity (RBA; 17estradiol ⫽ 100%) were established, based on global nucleophilicity, interatomic distances between electronegative atoms, charge on heteroatoms, and electron donor capability of heteroatoms. These reactivity patterns were used to establish descriptor profiles, within the context of an expert system, to identify ligands with RBAs of ⬎150%, 100 to 10%, 10 to 1%, and 1 to 0.1%. Using a “leave-one-out” evaluation, the reactivity patterns were determined to be stable and the resulting expert system correctly classified 30 of 45 compounds in this training set.
270
hER␣ BINDING AFFINITY MODEL EVALUATION
271
TABLE 1 Ligands, Observed Relative Binding Affinities (RBA) to hER from MCF7 Cells, Source of Data (Ref), Number of Conformers Generated (N), and Associated Ranges of Heat of Formation, and Root Mean Square (RMS) Differences No. 1 2 3 4 5 6 7 8 9 10 11 12 13 14 15 16 17 18 19 20 21 22 23 24 25 26 27 28 29 30 31 32 33 34 35 36
Ligand Estradiol Estradiol–16␣ Estratrien–3–ol Estrone Estradiol–17␣ 9–11 Ene–estradiol 2–Hydroxyestratrien–17–ol 6–Keto–estradiol–17–ol Estriol 4–Aminoestratriene–3,17–diol 4–Nitroestratriene–3,17–diol 2–Aminoestratriene–3,17–diol 4–Fluoroestratrien–17ol Estratrien–17–ol 4–Nitroestratrien–3–ol,17–one 2–Aminoestratrien–17–ol 2–Fluoroestratrien–17–ol 11–Hydroxy–estradiol 3–Methoxy estradiol–17 2–Nitroestratriene–3,17–diol 5–Androstene–3,17–diol 5␣–Androstane–3,17–diol 11␣–Hydroxy–estradiol 4–Aminoestratrien–17–ol 2–Nitroestratrien–3–ol,17–one 11–Keto–estradiol 4–Hydroxyestratrien–17–ol 9–Estradiol 4–Nitroestratrien–17–ol 2–Nitroestratrien–17–ol Estratrien–17–one Estratriene 11–Keto–9–estradiol 5␣–Androstane–3␣17–diol 4–Nonylphenol o,p⬘–DDT
RBA (%)
Ref.
100 80 40 22 22 19.6 18 18 17 16 13 12 8 8 6 4 2 1.68 1.4 1 0.7 0.5 0.31 0.17 0.1 0.09 0.08 0.07 ⬍0.05 ⬍0.05 ⬍0.05 ⬍0.05 ⬍0.05 ⬍0.05 0.021 0.0003
V Br V V P Br Br V Br Br Br Br Br Br Br Br P Br Br V V P Br Br P Br P Br Br Br Br P V B B
N 4 3 3 4 3 2 3 1 3 2 5 2 3 3 7 2 3 3 10 4 4 3 3 2 4 3 3 2 5 2 3 2 2 4 196 14
ddH[kcal/mol]
RMS
–107.6159 to –96.8975 –107.0931 to –96.6020 –62.8125 to –52.2316 –87.0704 to –77.0100 –107.8579 to –97.6046 –84.9278 to –83.0444 –107.6466 to –96.9750 –131.1277 –152.4492 to –141.5218 –107.3821 to –105.3871 –99.1052 to –88.3964 –108.0189 to –106.8755 –108.0670 to –97.4255 –63.4706 to –52.8675 –78.5453 to –68.2609 –64.7243 to –63.1693 –108.8062 to –98.2225 –147.4003 to –137.0706 –101.0557 to –89.4757 –106.0532 to –95.4390 –136.9920 to –132.5624 –162.4597 to –151.5775 –151.4568 to –148.7675 –63.7826 to –61.5664 –85.2338 to –78.9658 –130.3285 to –127.9250 –106.9196 to –96.1917 –101.0173 to –100.9720 –58.2424 to –47.6229 –60.7037 to –59.2212 –42.9864 to –32.9700 –18.5928 to –17.0508 –124.8020 to –124.5144 –160.7224 to –150.9430 –83.0323 to –78.3822 21.0963 to 32.7428
0.3343 to 0.8533 0.1832 to 0.4394 0.2786 to 0.5524 0.1520 to 0.5643 0.2646 to 0.5818 0.4436 0.3194 to 0.4266 0 0.3175 to 0.5773 0.3041 0.0972 to 0.3601 0.2912 0.2997 to 0.3872 0.2669 to 0.3452 0.0575 to 0.5598 0.2183 0.2952 to 0.3875 0.1703 to 0.9358 0.1174 to 0.7713 0.2188 to 0.5853 0.1938 to 0.4582 0.3646 to 0.5040 0.6266 to 0.8112 0.1552 to 0.2546 0.3211 0.2946 to 0.5596 0.4330 to 0.4785 0.077 0.1915 to 0.5190 0.22429 0.3066 to 0.3720 0.2234 0.1461 0.1372 to 0.5407 0.8358 to 1.7658 1.9169 to 7.3511
Note. V, VanderKuur et al. (1993); Br, Brooks et al. (1987); P, Palomino et al. (1994); B, Bolger et al. (1998).
To more completely evaluate the prototypical expert system, hER␣ ligand binding affinity for compounds not used in the original training set is required. Unfortunately, such data are not available in the open literature. However, a variety of ER binding affinity data sets for other experimental human and rodent models are available. While the use of RBA values from different experimental systems and species adds uncertainty to the evaluation of endpoint- and species-specific SARs, if the variability between experimental systems is within the desired precision of the predictions (i.e., variability across species and experimental systems is less than the variability across chemicals), such data can provide insights on the reliability of a model. In the current study, the 3-D SAR-based expert system derived from the hER␣ data set was assessed against RBA values for ER
binding affinity obtained from MCF7 cells, and mouse and rat uterine preparations.
MATERIALS AND METHODS ER Ligands and Receptor Binding Affinity Relative binding affinity values of steroidal and nonsteroidal compounds to hER from MCF7 cells and rodent uterine ERs were used to evaluate the model described by Bradbury et al. (2000), which was based on RBA values derived from the hER␣. Specifically, we assessed 3 data sets of 36, 35, and 58 chemicals, respectively, which were evaluated as to their affinity to MCF7 cells (Bolger et al., 1998; Brooks et al., 1987; Palomino et al., 1994; VanderKuur et al., 1993; Table 1), mouse uterine ER (Bolger et al., 1998; Connor et al., 1997; mER; Korach et al., 1988; Table 2), and rat uterine ER (rER; Anstead et al., 1989; Bolger et al., 1998; Connor et al., 1997; Gabbard
272
MEKENYAN ET AL.
TABLE 2 Ligands, Observed Relative Binding Affinities (RBA) to Mouse Uterine ER (mER), Source of Data (Ref), Number of Conformers Generated (N), and Associated Ranges of Heat of Formation and Root Mean Square (RMS) Differences No.
Ligand
RBA (%)
Ref.
N
ddH[kcal/mol]
RMS
1 2 3 4 5 6 7 8 9 10 11 12 13 14 15 16 17 18 19 20 21 22 23 24 25
Diethylstilbestrol (DES) Estradiol Estrone Tamoxifen HPTE 4 Hydroxy,2⬘,4⬘,6⬘–trichloro biphenyl 4,4⬘–Dihydroxy 2⬘–chloro biphenyl 4 Hydroxy,2⬘,3⬘,4⬘,5⬘–tetrachloro biphenyl 4–Nonylphenol 4–Hydroxyl 2⬘,6⬘dichloro biphenyl 4–t–Octylphenol 4–Hydroxyl 2⬘,5⬘–dichloro biphenyl o,p’ DDT 4 Hydroxy,3,5,4⬘–trichloro biphenyl 4,4⬘–Dihydroxy 3,5,3⬘,5⬘–tetrachloro biphenyl 2⬘,3,3⬘,4⬘,5⬘–PentaCB–4–ol 2,2⬘,3⬘,4⬘,6⬘–PentaCB–4–ol 4–Hydroxy 2–chloro biphenyl 2,2⬘,3⬘,4⬘,5⬘–PentaCB–4–ol 2⬘,3,3⬘,5⬘,6⬘–PentaCB–4–ol 5␣–Dihydrotestosterone 4–Hydroxy 4⬘–chloro biphenyl 4–Hydroxy biphenyl 4,4⬘–Dihydroxy biphenyl 4,4⬘–Dihydroxy 2⬘,3⬘,5⬘,6⬘–tetrachloro biphenyl Bisphenol A 2,2⬘,4⬘,6⬘–TetraCB–4–ol Kepone 2,2⬘,3⬘,5⬘,6⬘–PentaCB–4–ol 4–Nonylphenol Methoxychlor BBP p,p⬘ DDT 2⬘,3,4⬘,6⬘–TetraCB–4–ol 2⬘,3,3⬘,4⬘,6⬘–PentaCB–4–ol
250 100 60 6 3.25 2.4 1.1 1 0.313 0.26 0.2 0.2 0.17 0.1 0.074 0.072 0.044 0.04 0.033 0.031 0.026 0.026 0.02 ⬍0.02 ⬍0.02
Ko B B BA Ko Ko Ko B* Ko B Ko B Ko Ko C C Ko C C B Ko Ko Ko Ko
21 4 4 149 2 1 2 3 196 2 3 2 14 3 3 4 2 3 2 1 5 3 4 3 1
–47.5190 to –45.0619 –107.6159 to –96.8975 –87.0704 to –77.0100 48.6071 to 56.0690 –56.7081 to –56.7009 –12.8518 –45.8849 to –45.6890 –16.9179 to –16.8129 –83.0323 to –78.3822 –6.7187 to –6.6659 –54.1565 to –53.4612 –8.5800 to –8.3619 21.0963 to 32.7428 –13.6828 to –11.4750 –60.4322 to –58.0996 –20.9217 to –20.8391 –21.7134 to –21.7118 –1.5043 to –1.3164 –21.9928 to –21.9907 –20.4444 –143.5292 to –134.0742 –4.0743 to –1.9763 3.1336 to 5.2432 –41.1626 to –40.1363 –56.4487
0.4577 to 7.9498 0.3343 to 0.8533 0.1520 to 0.5643 0.9294 to 14.9980 3.0428 0 0.172 0.2006 to 2.2829 0.8358 to 11.7658 3.3605 3.3483 to 7.3376 0.187 1.9169 to 7.3511 0.3064 to 0.4256 0.3419 to 0.4411 0.6420 to 4.8808 4.8634 0.2039 to 2.1040 4.8319 0 0.2358 to 0.4780 0.2592 to 0.4097 1.4926 to 2.8044 0.3785 to 1.0316 0
0.018 0.018 0.0145 0.013 0.01 0.007 0.0034 0.0003 0 0
B C BA C B* BA B B C C
2 1 1 1 196 20 64 5 1 2
–48.3145 to –48.2939 –18.1477 18.3543 –21.7653 –83.0323 to –78.3822 –43.4469 to –39.5937 –127.9410 to –117.1117 18.8319 to 20.4237 –16.8369 –20.4800 to –20.4791
3.9247 0 0 0 0.8358 to 11.8658 2.2637 to 6.1257 2.0314 to 9.7750 1.3120 to 6.7854 0 4.8799
26 27 28 29 30 31 32 33 34 35
Note. Ko, Korach et al. (1988); B, Bolger et al. (1998); C, Connor et al. (1997); A, average of multiple values from indicated reference. *Chemical in more than one RBA range.
and Segaloff, 1983; Qian and Abul-Haji, 1990; Table 3). The RBA values of the ligands were calculated by dividing the concentration of test compound required to reduce the specific binding of radiolabeled 17-estradiol (E 2) by 50% by the concentration of unlabeled E 2 required to achieve the same reduction. Species-specific RBA values obtained across studies were typically within an order of magnitude. With the exception of mouse uterine RBA values for 4-nonylphenol, average values are listed in Tables 1–3. In the case of 4-nonylphenol, two RBA values (0.313 and 0.01%) were employed in the analyses (note “compounds” 9 and 30 in Table 2). The overlap of compounds between these data sets and those in the hER␣ knowledge base (Bradbury et al., 2000) is summarized in Table 4. The hER␣ and mouse uterine data sets were most similar, with 14 compounds in common, whereas the hER␣ and rat uterine data sets had 4 compounds in common. For RBA values ⬎1%, agreement between hER␣ values and those derived from the other biological models were within an order of magnitude; however, at lower RBA values, differences sometimes exceeded an order of magnitude.
ER Ligand Conformations and Molecular Descriptors The 3-D structures of ligand conformers were generated based on the method of Ivanov et al. (1994), using torsion resolution, distance between nonbonded atoms and ring closure, and related parameters, as described in our companion study (see Bradbury et al., 2000 and abbreviations given therein). Conformer geometry optimization was obtained with MOPAC 93 (Stewart, 1990, 1993), using the AM1 Hamiltonian with the key words ⬎PRECISE⫽ and ⬎NOMM⫽. For a given ligand, only conformers with a ⌬H f° within 20 kcal/mol of the ⌬H f° associated with the conformer with the absolute energy minimum were used (Tables 1–3). The conformers within this range of ⌬H f° were assumed to be energetically reasonable from a thermodynamic and kinetic perspective (Bradbury et al., 1998, 2000; Ivanov et al., 1998; Mekenyan et al., 1997, 1999). As in our previous study (Bradbury et al., 2000), it was assumed that conformers of each chemical could be considered as a statistical ensemble, based on the Boltzman’s statistics. Also included in Tables 1–3 are ligand-specific ranges of root mean square (RMS) differences between atoms
TABLE 3 Ligands, Observed Relative Binding Affinities (RBA) to Rat Uterine ER (rER), Source of Data (Ref), Number of Conformers Generated (N), and Associated Ranges of Heat of Formation, and Ranges of Root Mean Square (RMS) Differences No.
Ligand
1 2 3 4 5 6 7 8 9 10 11 12 13 14 15 16 17 18 19 20 21 22 23 24 25 26 27
Diethylstilbestrol 11–Methyl estradiol–17 D14 Estradiol–17 7␣–Methyl estradiol–17 Estradiol 1–Methyl; 3–ethyl; 6,4⬘–OH;2–phenylindene 1,3–Diethyl; 6,4⬘–OH; 2–phenylindene 7␣–Methyl–D14 estradiol–17 7␣–Methyl–estrone 6–OH; 2,3–diphenylindenone–1 7␣–Methyl–D14–estrone 11–Methyl–estrone 9␣–Methyl–D14 estradiol–17 9␣–Methyl estradiol–17 3–Ethyl; 6,4⬘–OH; 2–phenylindene 1–Methyl; 6–OH; 2,3–diphenylindene 1,3–Diethyl; 4–OH; 2–phenylindene D14–Estrone 3–Phenyl; 6–OH; 2–phenylindene Tamoxifen 9␣–Methyl–D14–estrone 7␣–Methyl E2–17 3–methyl ether 11–Methyl E2–17 3methy ether 9␣–Methyl–estrone 3–Ethyl 4⬘–OH 2–phenylindenone–1 7␣–Methyl–D14 E2–173–methyl ether 11–[3–N,N–Dimethylamino–propoxy] estra–1,3,5(10)triene–3,17–diol 3–Ethyl 4⬘–OH 2–phenylindene 1,3–Diethyl 6–OH 2–phenylindene 11–[2–N,N–Dimethylamino–ethoxy]estra– 1,3,5(10)triene–3,17–diol 11–Methyl D14 E2–17 3–methyl ether 3–Ethyl 6–OH 2–phenylindenone–1 D14 E2–173–Methyl ether 3–Ethyl 6–OH 2–phenylindene 4⬘–OH 2,3–Diphenylindenone–1 3–Phenyl 4⬘–OH 2–phenylindene 2,2⬘,3⬘,5⬘,6⬘–PentaCB–4–ol 2,2⬘,3⬘,4⬘,6⬘–PentaCB–4–ol 9␣–Methyl–D14 E2–17 3–methyl ether 2⬘,3,3⬘,4⬘,5⬘–PentaCB–4–ol 2⬘,3,3⬘,5⬘,6⬘–PentaCB–4–ol 2⬘,3,3⬘,4⬘,6⬘–PentaCB–4–ol 2,2⬘,3⬘,4⬘,5⬘–PentaCB–4–ol 3–(C6H4) 4“–OH 2–phenylindene o,p⬘–DDT 2,3–Diphenylindenone–1 2,2⬘,4⬘,6⬘–TetraCB–4–ol Dieldrin 2⬘,3,4⬘,6⬘–TetraCB–4–ol 11–Methyl–D14–estrone 3–methyl ether 9␣–Methyl–D14–estrone 3–methyl ether 7␣–Methyl–D14–estrone 3–methyl ether D14–Estrone 3–methyl ether 11–Methyl–estrone–3–methyl ether 9␣–Methyl–estrone–3–methyl ether 7␣–Methyl–estrone–3–methyl ether Estrone–3–methyl ether 9␣–Methyl E2–17 3–methyl ether
28 29 30 31 32 33 34 35 36 37 38 39 40 41 42 43 44 45 46 47 48 49 50 51 52 53 54 55 56 57 58
RBA (%)
Ref.
N
ddH[kcal/mol]
RMS
B G G G
–47.5190 to –45.0619 –96.6593 –83.2854 to –70.4633 –110.1453 to –99.8883 –107.6159 to –96.8975 –35.1787 to –31.5235 –40.9147 to –31.6182 –85.3135 to –70.5533 –89.6667 to –80.0253 35.2282 to 37.0052 –65.0343 to –48.5543 –76.6212 to –73.4133 –82.1867 to –74.4626 –105.4017 –31.8121 to –29.3166 49.5270 to 50.5972 3.3648 to 12.3888 –62.8227 to –47.0804 52.9254 to 54.0814 48.6071 to 56.0690 –61.7544 to –53.7873 –103.7087 to –93.3945 –97.2634 to –86.6012 –85.1291 –6.0252 to –2.1746 –79.0601 to –60.1298 –143.5618 to –123.7548
0.4577 to 7.9498 0 0.3367 to 1.2266 0.6168 to 0.7700 0.3343 to 0.8533 0.5139 to 3.1796 0.3425 to 4.6881 0.5325 to 2.2718 0.4258 to 0.8801 0.2739 to 2.8485 0.6721 to 2.3263 0.6978 0.5254 0 0.2953 to 3.7704 0.2555 to 3.6497 0.3067 to 5.1054 0.3437 to 1.4021 0.5724 to 4.8400 0.9294 to 14.9980 0.6163 0.0678 to 1.1556 0.5764 to 1.9878 0 1.4304 to 4.0225 0.0980 to 2.9973 0.6246 to 9.5053 1.1698 to 3.2483 0.4904 to 5.5741 0.2646 to 6.3353
470 124 107 104 100 81 79 74 68 59 52 47 41 35 16 12 9.3 9 8.9 6 6 5.3 5.1 5 4.6 3.1 2.6
An An G G An G G G G An An An G An Q G G G G An G Q
21 1 7 3 4 12 33 11 4 7 6 2 2 1 11 8 38 6 8 149 2 15 6 1 12 33 60
2.3 2.2 1.6
An An Q
11 43 20
12.4237 to 15.7764 3.4399 to 12.5355 –136.8826 to –118.1979
1.2 1.2 0.8 0.58 0.45 0.36 0.14 0.12 0.1 0.082 0.068 0.041 0.036 0.017 0.01 0.0095 0.0005 0.0005 0 0 0 0 0 0 0 0 0 0
G An G An An An C C G C C C C An B An C B C G G G G G G G G G
16 12 20 11 7 8 1 2 11 4 1 2 2 7 14 7 1 2 1 16 10 18 20 4 6 9 11 4
–77.3290 to –67.9761 –5.4638 to –1.8779 –76.9186 to –66.3275 12.5264 to 14.3330 34.6060 to 36.6043 52.5707 to 54.0216 –21.7653 –21.7134 to –21.7118 –75.7626 to –66.8124 –20.9217 to –20.8391 –20.4444 –20.4800 to –20.4791 –21.9928 to –21.9907 52.8334 to 53.9462 21.0963 to 32.7428 79.1399 to 80.6384 –18.1477 224.2979 to 224.5710 –16.8369 –56.9465 to –38.5028 –55.3152 to –46.3932 –58.6270 to –39.5063 –56.3380 to –43.4467 –70.3216 to –66.7593 –78.7993 to –77.2899 –83.1343 to –73.5141 –80.6124 to –70.5378 –99.0673 to –97.5325
0.1115 0.7238 0.1354 0.3423 0.1824 0.2870
to 2.5966 to 4.3294 to 1.3596 to 4.1639 to 2.7936 to 3.9166 0 4.8634 0.0830 to 1.1853 0.6420 to 4.8808 0 4.8799 4.8319 0.3024 to 4.8085 1.9169 to 7.3511 1.1089 to 5.2588 0 6.6002 0 0.1548 to 2.6509 0.1663 to 1.1154 0.0876 to 4.0087 0.0846 to 1.6183 0.5265 to 1.3343 0.1260 to 0.5736 0.5680 to 1.7791 0.0990 to 1.1738 0.1926 to 0.5440
Note. An, Anstead et al. (1989); B, Bolger et al. (1998); C, Connor et al. (1997); G, Gabbard and Segaloff (1983); Q, Qian and Abul–Hajj (1990).
274
MEKENYAN ET AL.
TABLE 4 Summary of RBA Values (from Tables 1–3) of Chemicals Tested for ER Binding Affinity in More than One Biological Model
a
Data Data c Data d Data b
Ligand
hER␣ a
MCF7 (hER) b
Diethylstilbestrol 17–Estradiol Estrone 17␣–Estradiol Estriol 5–Androstene–3,17–diol Tamoxifen HPTE o,p’–DDT 4–Nonylphenol 4–t–Octylphenol Kepone p,p⬘–DDT Bisphenol A 5␣–Dihydrotestosterone BBP Methoxychlor Dieldrin 2,2⬘,3⬘,5⬘,6⬘–PentaCB–4–ol 2,2⬘,3⬘,4⬘,6⬘–PentaCB–4–ol 2⬘,3,3⬘,4⬘,5⬘–PentaCB–4–ol 2⬘,3,3⬘,5⬘,6⬘–PentaCB–4–ol 2⬘,3,3⬘,4⬘,6⬘–PentaCB–4–ol 2,2⬘,3⬘,4⬘,5⬘–PentaCB–4–ol 2,2⬘,4⬘,6⬘–TetraCB–4–ol 2⬘,3,4⬘,6⬘–TetraCB–4–ol
294 100 60 58 14 6 5.1 1.7 0.4 0.3 0.2 0.2 0.06 0.045 0.03 0.015 0.012 0.003 – – – –
– 100 22 22 17 0.7 – – 0.0003 0.021 – – – – – – – – – – – – –
– –
– –
from from from from
rER c 470 100 – – – – 6 – 0.01 – – – – – – – – 0.0005 0.14 0.12 0.082 0.068 0.041 0.036 0.0005 0.0
mER d 250 100 60 – – – 6 3.25 0.13 0.313, 0.01, 0.2 0.0145 0.0003 0.018 0.026 0.0034 0.0038, 0.01 – 0.013 0.044 0.072 0.031 0.0 0.033 0.018 0.0
Kuiper et al. (1997) and Bolger et al. (1998). Brooks et al. (1987), VanderKuur et al. (1993), Palomino et al. (1994), and Bolger et al. (1998). Gabbard and Segaloff (1983), Anstead et al. (1989), Qian and Abul–Hajj (1990), Conner et al. (1997), and Bolger et al. (1998). Korach et al. (1988), Conner et al. (1997), and Bolger et al. (1998).
of each conformer with the corresponding atoms in the lowest-energy conformer. As in our preceding study (Bradbury et al., 2000), conformers of a given chemical within the specified 20 kcal/mol range of ⌬H f° often exhibited significant variation in potentially relevant electronic descriptors (data not shown). This observation is consistent with previous studies highlighting the necessity of including all energetically reasonable conformers when defining common reactivity patterns (Bradbury et al., 1998, 2000; Mekenyan et al., 1997, 1999). To generate common reactivity patterns, the same set of global and local molecular descriptors used in our previous study (Bradbury et al., 2000) were employed. These descriptors were associated with global nucleophilicity, heteroatom electronegativity and charge, and interatomic distances between heteroatoms. Evaluation of the COREPA-Based hER␣ Ligand Reactivity Patterns A summary of the COREPA method to assess hER␣ binding affinity was provided by Bradbury et al. (2000), while the conceptual basis and mathematical derivations for the method are reported elsewhere (Mekenyan et al., 1997, 1999). Using this technique, a decision tree was developed to predict RBA ranges for chemical binding to hER␣. The decision tree, based on the energy of the highest occupied molecular orbital (E HOMO), interatomic distances between heteroatoms (d(R_R)), charge of a heteroatom (Q(R)), and donor delocalizabilities of heteroatoms (S E(R)) was optimized to first minimize the probability of false negative identifications (i.e., underpredicted RBA values),
while secondarily minimizing the number of false positive identifications. In the current study the decision tree was modified, as summarized below, using additional screens described by Bradbury et al. (2000), to further minimize the probability of false negative identifications. These modifications were applied with the realization that an increase in false positive predictions likely would result. A “prescreen” reactivity pattern was used to eliminate those compounds whose RBA values were likely not to exceed 0.1%. Thus, conformers which had E HOMO values of less than –9.95 eV, electronegative sites not meeting a S E (R) range of 0.239 to 0.277 (a.u.) 2 /eV, or steroids not conforming to stereochemical requirements of the natural enantiomer were assigned a 0% probability of having an RBA value ⬎0.1%. A reactivity pattern, with E HOMO ⬎ – 8.99 eV combined with a d(R_R) range of 11.77 to 12.22 Å between heteroatoms and a Q(R) range of – 0.272 to – 0.233 a.u. (imposed on both electronegative sites forming the d(R_R)), was employed to identify chemicals with an RBA value ⬎150%. The reactivity pattern for the binding activity range 100 ⬎ RBA ⬎ 10% was based on an E HOMO pattern ⬎ –9.44 eV, combined with d(R_R) ranges of 10.62 to 10.95, 10.38 to 10.51, or 11.50 to 11.80 Å, and the requirement that at least one of the heteroatoms in the distance range meet the Q(R) screen of – 0.273 to – 0.236 a.u. For the activity range of 10 ⬎ RBA ⬎ 1% a pattern was derived based on a E HOMO ⬎ –9.87 eV, combined with distance screens of 9.38 to 9.93, 9.75 to 10.44, or 10.56 to 11.28 Å and a S E (R) pattern of 0.237 to 0.273 (a.u.) 2 /eV, imposed on at least one electronegative site. Finally, the
hER␣ BINDING AFFINITY MODEL EVALUATION
275
TABLE 5 The Predicted RBA Ranges Using the Decision Tree Based on the hER␣ Reactivity Pattern, for Ligands with Measured Binding Affinity to hER from MCF7 Cells Predicted RBA ranges (%) No.
Ligand
Measured RBA (%)
00 ⬎ RBA ⬎ 10
1 2 3 4 5 6 7 8 9 10 11 12 13 14 15 16 17 18 19 20 21 22 23 24 25 26 27 28 29 30 31 32 33 34 35 36
Estradiol Estradiol –16␣ Estratrien–3–ol Estrone Estradiol –17␣ 9–11 Ene–estradiol 2–Hydroxyestratrien–17–ol 6–Keto–estradiol–17–ol Estriol 4–Aminoestratriene–3,17–diol 4–Nitroestratriene–3,17–diol 2–Aminoestratriene–3,17–diol 4–Fluoroestratrien–17–ol Estratrien–17–ol 4–Nitroestratrien–3–ol,17–one 2–Aminoestratrien–17–ol 2–Fluoroestratrien–17–ol 11–Hydroxy–estradiol 3–Methoxy estradiol–17 2–Nitroestratriene–3,17–diol 5–Androstene–3, 17–diol 5 ␣–Androstane–3, 17–diol 11␣–Hydroxy–estradiol 4–Aminoestratrien–17–ol 2–Nitroestratrien–3–ol,17–one 11–Keto–estradiol 4–Hydroxyestratrien–17–ol 9–Estradiol 4–Nitroestratrien–17–ol 2–Nitroestratrien–17–ol Estratrien–17–one Estratriene 11–Keto–9–estradiol 5␣–Androstane–3␣,17–diol 4–Nonylphenol o,p⬘–DDT
100 ⬎ RBA ⬎ 10 100 ⬎ RBA ⬎ 10 100 ⬎ RBA ⬎ 10 100 ⬎ RBA ⬎ 10 100 ⬎ RBA ⬎ 10 100 ⬎ RBA ⬎ 10 100 ⬎ RBA ⬎ 10 100 ⬎ RBA ⬎ 10 100 ⬎ RBA ⬎ 10 100 ⬎ RBA ⬎ 10 100 ⬎ RBA ⬎ 10 100 ⬎ RBA ⬎ 10 10 ⬎ RBA ⬎ 1 10 ⬎ RBA ⬎ 1 10 ⬎ RBA ⬎ 1 10 ⬎ RBA ⬎ 1 10 ⬎ RBA ⬎ 1 10 ⬎ RBA ⬎ 1 10 ⬎ RBA ⬎ 1 1 ⬎ RBA ⬎ 0.1 1 ⬎ RBA ⬎ 0.1 1 ⬎ RBA ⬎ 0.1 1 ⬎ RBA ⬎ 0.1 1 ⬎ RBA ⬎ 0.1 0.1 ⬎ RBA ⬎ 0.01 0.1 ⬎ RBA ⬎ 0.01 0.1 ⬎ RBA ⬎ 0.01 0.1 ⬎ RBA ⬎ 0.01 0.1 ⬎ RBA ⬎ 0.01 0.1 ⬎ RBA ⬎ 0.01 0.1 ⬎ RBA ⬎ 0.01 0.1 ⬎ RBA ⬎ 0.01 0.1 ⬎ RBA ⬎ 0.01 0.1 ⬎ RBA ⬎ 0.01 0.1 ⬎ RBA ⬎ 0.01 0.01 ⬎ RBA
x x
10 ⬎ RBA ⬎ 1
1 ⬎ RBA ⬎ 0.1
RBA ⬍ 0.1
x x x x x x x x x x x x x x x x x x x x x x x x x x x x x x x x x x
Note. Chemicals are Assigned to the Highest Activity Range Predicted
reactivity pattern based on E HOMO ⬎ –9.93 eV and S E (R) of 0.239 to 0.269, 0.248 to 0.279, or 0.300 to 0.330 (a.u.) 2 /eV was associated with the low binding activity range of 1 ⬎RBA ⬎ 0.1%. These reactivity patterns were organized in a hierarchical decision tree that sequentially assessed the energetically reasonable conformers of a ligand in decreasing order of RBA ranges. Once identified as meeting a reactivity pattern for a particular binding activity range, a compound was assigned to that RBA range and not evaluated using patterns associated with lower RBA ranges. The ER ligands in Tables 1–3 were used to evaluate the ability of this decision tree, and associated reactivity patterns, to predict RBA ranges for chemicals not included in the original hER␣ training set (see Bradbury et al., 2000). Each energetically reasonable conformer of a chemical was processed through the decision tree by making use of an interpreter based on the SMILES algorithm, which permits the use of stereoelectronic structure-based rules. The decision tree provided a binary discrimination (i.e., a “yes” or “no” determination) of chemicals being within a specified
RBA range. Thus, a chemical would be predicted to have an hER␣ affinity within a specified RBA range if at least one of its conformers met the associated reactivity pattern.
RESULTS AND DISCUSSION
MCF7 Cell Data Set (Table 5) Nine of 12 chemicals with measured ER binding affinity within 10 ⬎ RBA ⬎ 100% were correctly categorized. Five out of these 9 compounds were not in the original hER␣ data set. Estratrien-3-ol (3; RBA ⫽ 107%) was incorrectly predicted to have 1 ⬎ RBA ⬎ 0.1%, while 2-hydroxyestratien17-ol (7; RBA ⫽ 79%) and 4-nitroestratriene-3,17-diol (11;
276
MEKENYAN ET AL.
RBA ⫽ 52%) were incorrectly predicted to have 10 ⬎ RBA ⬎ 1%. Explanations for these false-negative identifications include lack of a second electronegative site (3) or slightly lower global electron donor ability (–9.57 ⬍ E HOMO ⬍ –9.51 eV) and shorter than required distances between electronegative atoms (9.1–9.9 Å) for compounds 7 and 11. 11-Hydroxy-estradiol (18; RBA ⫽ 1.7%), 11␣-hydroxy-estradiol (23; RBA ⫽ 0.31%) and 11-keto-estradiol (26; RBA ⫽ 0.1%) were incorrectly predicted as having RBAs greater than 10% (i.e., false positive identifications). For compounds with observed RBA values between 1 and 10%, estratrien-17-ol (14; RBA ⫽ 8%) was incorrectly predicted to have an RBA between 0.1 and 1%, due to the lack of a second electronegative site. False positive identifications using the reactivity pattern for the RBA range between 1 and 10% included 2-nitroestratriene-3,17-diol (20), 5-androstene3, 17-diol (21), 4-aminoestratrien-17-ol (24), 2-nitroestratrien-3-ol,17-one (25), and 4-hydroxyestratien-17-ol (27), with measured RBA values of 1, 0.7, 0.17, 0.1, and 0.08%, respectively. One of the false-positives, 5-androstene-3, 17diol (21), was also in the hER␣ training set; however, in that biological model, the observed RBA was 6%. Thus, the discrepancy for this compound may reflect variability across receptor systems and/or laboratories. For compounds with observed RBA values between 0.1 and 1%, 5␣-androstane-3, 17-diol (22; RBA ⫽ 0.5%) was the only false negative identification, due to a very low global nucleophilicity (–10.35 ⬍ E HOMO ⬍ –10.31 eV). Four compounds were false positive identifications for binding affinity in this range, including 29 (measured RBA ⬍ 0.05%), 31 (RBA ⬍ 0.05%), 35 (RBA ⫽ 0.021%), and 36 (RBA ⫽ 0.0003%). It should be noted that compounds 35 and 36 were evaluated using the hER␣, with measured RBA values of 0.3 and 0.4%, respectively (Bradbury et al., 2000), hence discrepancies between observed and predicted values for these compounds are likely due to variability across receptor systems. In summary, of the 36 compounds in the MCF7 cell data set, 19 RBA ranges were correctly predicted, with RBA ranges for 5 compounds underpredicted (false negative identifications) and 12 overpredicted (false positives). Based on several compounds in common between the MCF7 cell data set and the hER␣ training set, it appears that the false positive identifications may be due, in part, to inherently higher binding affinity in the hER␣ system. For the false negative identifications with compounds having observed RBA values between 10 and 100%, the most notable discrepancy was observed for compound 3 and suggests that in some cases one, rather than two, electronegative sites may be required for ER binding in MCF7 cells. Mouse Uterine Data Set (Table 6) The common reactivity patterns for RBA ranges greater than 150% and for 10 to 100%, did not result in any false positive
identifications. Compounds with measured RBA values greater than 10%, which were also in the hER␣ training set, were correctly discriminated. For compounds with measured RBA values between 1 and 10%, 3 of 4 compounds were correctly categorized. Tamoxifen (4; RBA ⫽ 6%) was incorrectly predicted to have an RBA between 0.1 and 1%. This is consistent with the incorrect identification also observed for tamoxifen with the hER␣ data set (Bradbury et al., 2000); this is due to the fact that the maximum interatomic distance between electronegative atoms for tamoxifen is much less than that specified in the common reactivity pattern. Of the 3 compounds whose RBA values were correctly predicted, two (6, 4-hydroxy-2⬘,4⬘,6⬘-trichlorobiphenyl, RBA ⫽ 2.4%; and 7, 4,4⬘-dihydroxy-2⬘-chlorobiphenyl, RBA ⫽ 1.1%) were not in the original hER␣ training set. In terms of false positive classifications, the reactivity pattern for 10 ⬎ RBA ⬎ 1% incorrectly identified chemical 8 (4-hydroxy-2⬘,3⬘,4⬘,5⬘-tetrachlorobiphenyl; RBA ⫽ 1.0%) and several compounds with measured RBA values in the range of 0.01 to 0.1% (compounds 14 –17, 19, 22, 24, 25, and 27) and measured RBA values less than 0.01% (compounds 31, 34, and 35). An analysis of this set of structures suggests that RBA values can be significantly reduced if the electronegative site (i.e., a charge greater than – 0.3 a.u.) is shielded. With an additional rule added to the expert system in which ligands with atoms or fragments, either directly bonded to an electronegative heteroatom or in an ortho position to the heteroatom, were considered incapable of binding with an RBA ⬎0.1%, the number of false positive identifications decreased from 13 to 5. The remaining false positive identifications were compounds 17, 22, 24, 27, and 34. Compound 8, with a measured RBA of 1.0%, was a false negative with a predicted RBA of ⬍0.1%. This steric requirement was also observed in a recent application of the COREPA approach to the data set analyzed by Waller et al. (1996), which consisted of 9 steroidal and 49 nonsteroidal ligands (unpublished data). The reactivity pattern for the range of 0.1 to 1% correctly predicted 5 of the 6 compounds with observed RBA values within this range, with 2 of the chemicals (10, 12) not in the original hER␣ training set. The pattern also identified 8 false positive ligands whose measured RBA values were 1 ⬎ RBA ⬎ 0.1% (compounds 18, 20, 23, 26, 29, 30, 32, and 33). In this case, use of the shielding rule did not reduce the number of false positives. In summary, for the 35 compounds in the mER data set, 13 compounds were predicted to bind within the correct RBA ranges. Of the 22 incorrect classifications, one was a false negative and 21 were false positive predictions. Inclusion of the shielding rule in the expert system resulted in 20 correct classifications, with the number of false positive predictions reduced from 21 to 13 compounds, and with one additional false negative prediction. For the 7 compounds with measured RBA values between 150 and 1%, the one false negative prediction was associated with tamoxifen.
hER␣ BINDING AFFINITY MODEL EVALUATION
277
TABLE 6 The Predicted RBA Ranges Using the Decision Tree Based on the hER␣ Reactivity Pattern for Ligands with Measured Binding Affinity to Mouse Uterine Estrogen Receptors (mER) Predicted RBA ranges No.
Ligand
Measured RBA (%)
⬎ 150
1 2 3 4 5 6 7 8
Diethylstilbestrol Estradiol Estrone Tamoxifen HPTE 4 Hydroxy,2⬘,4⬘,6⬘–trichloro biphenyl 4,4⬘–Dihydroxy 2⬘–chloro biphenyl 4 Hydroxy,2⬘,3⬘,4⬘,5⬘– tetrachlorobiphenyl 4–Nonylphenol 4–Hydroxyl 2⬘,6⬘dichloro biphenyl 4–t–Octylphenol 4–Hydroxyl 2⬘,5⬘–dichloro biphenyl o,p’ DDT 4 Hydroxy,3,5,4⬘–trichlorobiphenyl 4,4⬘–Dihydroxy 3,5,3⬘,5⬘– tetrachlorobiphenyl 2⬘,3,3⬘,4⬘,5⬘–PentaCB–4–ol 2,2⬘,3⬘,4⬘,6⬘–PentaCB–4–ol 4–Hydroxy 2–chloro biphenyl 2,2⬘,3⬘,4⬘,5⬘–PentaCB–4–ol 2⬘,3,3⬘,5⬘,6⬘–PentaCB–4–ol 5a–Dihydrotestosterone 4–Hydroxy 4⬘–chloro biphenyl 4–Hydroxy biphenyl 4,4⬘–Dihydroxy biphenyl 4,4⬘–Dihydroxy 2⬘,3⬘,5⬘,6⬘– tetrachlorobiphenyl Bisphenol A 2,2⬘,4⬘,6⬘–TetraCB–4–ol Kepone 2,2⬘,3⬘,5⬘,6⬘–PentaCB–4–ol 4–Nonylphenol Methoxychlor BBP p,p’ DDT 2⬘,3,4⬘,6⬘–TetraCB–4–ol 2⬘,3,3⬘,4⬘,6⬘–PentaCB–4–ol
⬎ 150 100 ⬎ RBA ⬎ 10 100 ⬎ RBA ⬎ 10 10 ⬎ RBA ⬎ 1 10 ⬎ RBA ⬎ 1 10 ⬎ RBA ⬎ 1 10 ⬎ RBA ⬎ 1 1 ⬎ RBA ⬎ 0.1
x
9 10 11 12 13 14 15 16 17 18 19 20 21 22 23 24 25 26 27 28 29 30 31 32 33 34 35
1 ⬎ RBA ⬎ 0.1 1 ⬎ RBA ⬎ 0.1 1 ⬎ RBA ⬎ 0.1 1 ⬎ RBA ⬎ 0.1 1 ⬎ RBA ⬎ 0.1 0.1 ⬎ RBA ⬎ 0.01 0.1 ⬎ RBA ⬎ 0.01 0.1 0.1 0.1 0.1 0.1 0.1 0.1 0.1 0.1 0.1
⬎ ⬎ ⬎ ⬎ ⬎ ⬎ ⬎ ⬎ ⬎ ⬎
RBA RBA RBA RBA RBA RBA RBA RBA RBA RBA
⬎ ⬎ ⬎ ⬎ ⬎ ⬎ ⬎ ⬎ ⬎ ⬎
0.01 0.01 0.01 0.01 0.01 0.01 0.01 0.01 0.01 0.01
0.1 ⬎ RBA ⬎ 0.01 0.1 ⬎ RBA ⬎ 0.01 0.1 ⬎ RBA ⬎ 0.01 0.1 ⬎ RBA ⬎ 0.01 0.01 ⬎ RBA ⬎ 0.00 0.01 ⬎ RBA ⬎ 0.00 0.01 ⬎ RBA ⬎ 0.00 0.01 ⬎ RBA ⬎ 0.00 0.01 ⬎ RBA ⬎ 0.00 0.01 ⬎ RBA ⬎ 0.00
With the inclusion of the shielding rule, the 13 false positive predictions included 9 biphenyl compounds, with measured RBA values typically between 0.1 and 0.01%. These lowaffinity biphenyl compounds were not represented in the hER␣ training set, which may have led to a bias in the reactivity patterns for RBA values between 10 and 1% and 1 and 0.1%. Other remaining false positives were 30 (4nonylphenol; RBA ⫽ 0.01), which was measured to have a mER binding affinity of 0.313 (9), similar to that measured for hER␣ (0.3), and 26 (bisphenol A), 32 (BBP), and 33 (p,p⬘-DDT), all with lower observed affinity to mouse receptors than previously measured for hER␣ (Table 4).
100 ⬎ RBA ⬎ 10
10 ⬎ RBA ⬎ 1
1 ⬎ RBA ⬎ 0.1
RBA ⬍ 0.1
x x x x x x x x x x x x x x x x x x x x x x x x x x x x x x x x x x
Rat Uterine Data Set (Table 7) An evaluation of the RBA ⬎ 150% and 100 ⬎ RBA ⬎ 10% screening patterns against the rat RBA data set resulted in 5 false negative and 5 false positive predictions. The reactivity pattern derived for RBA ⬎ 150% correctly identified 1 (diethylstilbestrol; RBA ⫽ 470%), with no false positive identifications. The rER data set contained 3 compounds with observed RBA values between 100 and 150%, a range not available in the hER␣ training set. Although technically classified as false negatives, the hER␣-based pattern for 100 ⬎ RBA ⬎ 10% identified 3 (D14 estradiol-17; RBA ⫽ 107%) and 4 (7␣-
278
MEKENYAN ET AL.
TABLE 7 The RBA Ranges Predicted Using the Decision Tree Based on the hER␣ Reactivity Pattern for Ligands with Measured Affinity to Rat Uterine Estrogen Receptors (rER) Predicted RBA ranges (%) No.
Ligand
Measured RBA (%)
⬎150
1 2 3 4 5 6
Diethylstilbestrol 11-Methyl estradiol-17 D14 Estradiol-17 7␣-Methyl estradiol-17 Estradiol 1-Methyl; 3-ethyl; 6,4⬘-OH; 2phenylindene 1,3-Diethyl; 6,4⬘-OH; 2phenylindene 7␣-Methyl-D14 estradiol-17 7␣-Methyl-estrone 6-OH; 2,3-Diphenylindenone-1 7␣-Methyl-D14-estrone 11-Methyl-estrone 9␣-Methyl-D14 estradiol-17 9␣-Methyl estradiol-17 3-Ethyl; 6,4⬘-OH; 2-phenylindene 1-Methyl; 6-OH; 2,3diphenylindene 1,3-Diethyl; 4-OH; 2-phenylindene D14-Estrone 3-Phenyl; 6-OH; 2-phenylindene Tamoxifen 9␣-Methyl-D14-estrone 7␣-Methyl E2-17 3-methyl ether 11-Methyl E2-17 3-methyl ether 9␣-Methyl-estrone 3-Ethyl 4⬘-OH 2-phenylindenone-1 7␣-Methyl-D14 E2-173-methyl ether 11-[3-N,N-Dimethylaminopropoxy] estra1,3,5(10)triene-3,17-diol 3-Ethyl 4⬘-OH 2-phenylindene 1,3-Diethyl 6-OH 2-phenylindene 11-[2-N,N-Dimethylaminoethoxy] estra1,3,5(10)triene-3,17-diol 11-Methyl D14 E2-17 3-methyl ether 3-Ethyl 6-OH 2-phenylindenone-1 D14 E2-173-Methyl ether 3-Ethyl 6-OH 2-phenylindene 4⬘-OH 2,3-Diphenylindenone-1 3-Phenyl 4⬘-OH 2-phenylindene 2,2⬘,3⬘,5⬘,6⬘-PentaCB-4-ol 2,2⬘,3⬘,4⬘,6⬘-PentaCB-4-ol 9␣-Methyl-D14 E2-17 3-methyl ether 2⬘,3,3⬘,4⬘,5⬘-PentaCB-4-ol 2⬘,3,3⬘,5⬘,6⬘-PentaCB-4-ol 2⬘,3,3⬘,4⬘,6⬘-PentaCB-4-ol 2,2⬘,3⬘,4⬘,5⬘-PentaCB-4-ol 3-(C6H4) 4⬙-OH 2-Phenylindene o,p⬘-DDT 2,3-Diphenylindenone-1 2,2⬘,4⬘,6⬘-TetraCB-4-ol Dieldrin 2⬘,3,4⬘,6⬘-TetraCB-4-ol 11-Methyl-D14-estrone 3-methyl ether 9␣-Methyl-D14-estrone 3-methyl ether 7␣-Methyl-D14-estrone 3-methyl ether D14-Estrone 3-methyl ether 11-Methyl-estrone-3-methyl ether 9␣-Methyl-estrone-3-methyl ether 7␣-Methyl-estrone-3-methyl ether Estrone-3-methyl ether 9␣-Methyl E2-17 3-methyl ether
⬎150 150 ⬎ RBA ⬎ 100 150 ⬎ RBA ⬎ 100 150 ⬎ RBA ⬎ 100 100 ⬎ RBA ⬎ 10
x
7 8 9 10 11 12 13 14 15 16 17 18 19 20 21 22 23 24 25 26 27 28 29 30 31 32 33 34 35 36 37 38 39 40 41 42 43 44 45 46 47 48 49 50 51 52 53 54 55 56 57 58
100 ⬎ RBA ⬎ 10 100 100 100 100 100 100 100 100 100
⬎ ⬎ ⬎ ⬎ ⬎ ⬎ ⬎ ⬎ ⬎
RBA RBA RBA RBA RBA RBA RBA RBA RBA
⬎ ⬎ ⬎ ⬎ ⬎ ⬎ ⬎ ⬎ ⬎
10 10 10 10 10 10 10 10 10
100 10 10 10 10 10 10 10 10 10
⬎ ⬎ ⬎ ⬎ ⬎ ⬎ ⬎ ⬎ ⬎ ⬎
RBA RBA RBA RBA RBA RBA RBA RBA RBA RBA
⬎ ⬎ ⬎ ⬎ ⬎ ⬎ ⬎ ⬎ ⬎ ⬎
10 1 1 1 1 1 1 1 1 1
150 ⬎ RBA ⬎ 100
100 ⬎ RBA ⬎ 10
x x x x x x x x x x x x x x x x x x x x x x
10 ⬎ RBA ⬎ 1
x
x x
x x x x x x x x
⬎ RBA ⬎ 0.01 ⬎ RBA ⬎ 0.01 ⬎ RBA ⬎ 0.01 ⬎ RBA ⬎ 0.01 ⬎ RBA ⬎ 0.01 ⬎ RBA ⬎ 0.01 0.01 ⬎ RBA 0.01 ⬎ RBA 0.01 ⬎ RBA 0.01 ⬎ RBA 0.01 ⬎ RBA
x
0.01 ⬎ RBA
x
0.01 ⬎ RBA
x
⬎ ⬎ ⬎ ⬎ ⬎ ⬎ ⬎
x x x x x x x
0.01 0.01 0.01 0.01 0.01 0.01 0.01
RBA RBA RBA RBA RBA RBA RBA
RBA ⬍ 0.1
x
10 ⬎ RBA ⬎ 1 10 ⬎ RBA ⬎ 1 10 ⬎ RBA ⬎ 1
0.1 0.1 0.1 0.1 0.1 0.1
1 ⬎ RBA ⬎ 0.1
x x x
10 ⬎ RBA ⬎ 1
10 ⬎ RBA ⬎ 1 10 ⬎ RBA ⬎ 1 1 ⬎ RBA ⬎ 0.1 1 ⬎ RBA ⬎ 0.1 1 ⬎ RBA ⬎ 0.1 1 ⬎ RBA ⬎ 0.1 1 ⬎ RBA ⬎ 0.1 1 ⬎ RBA ⬎ 0.1
10 ⬎ RBA ⬎ 1
x x x x x x x x x x
hER␣ BINDING AFFINITY MODEL EVALUATION
methyl estradiol-17; RBA ⫽ 104%). The third chemical in this range (2; 11-methyl estradiol-17; RBA ⫽ 124%) was identified as having an RBA between 10 and 1%. For the 12 chemicals with observed RBA values between 10 and 100%, the reactivity pattern for 100 ⬎ RBA ⬎ 10% resulted in false negative predictions for 10 (6-hydroxy-2,3-diphenylindenone-1; RBA ⫽ 59%) and 16 (1-methyl-6-hydroxy; 2,3-diphenylindene; RBA ⫽ 12%), which were predicted to have RBAs between 0.1 and 1%. These incorrect predictions were due to short distances between electronegative sites and the lack of a second electronegative site, respectively. False positive identifications obtained with the 100 ⬎ RBA ⬎ 10% pattern included compounds 18 (RBA ⫽ 9%), 21 (RBA ⫽ 6%), 24 (RBA ⫽ 5%), 27 (RBA ⫽ 2.6%), and 30 (RBA ⫽ 1.6%). Using the additional filter for nonshielded electronegative sites (see Mouse Uterine Data Set), compounds 27 and 30 would not be predicted to have RBA values between 10 and 100%, but would be predicted to have RBA ⬍ 0.1, and therefore be identified as false negatives. Application of the reactivity pattern for 10 ⬎ RBA ⬎ 1% to compounds with observed RBA values between 1 and 10% resulted in false negative predictions for 17 (1,3-diethyl-4hydroxy-2-phenylindene; RBA ⫽ 9.3%), 19 (3-phenyl-6-hydroxy-2-phenylindene; RBA ⫽ 8.9%), 20 (tamoxifen; RBA ⫽ 6%), 25 (3-ethyl-4⬘-hydroxy-2-phenylindenone-1; RBA⫽ 4.6%), 28 (3-ethyl-4⬘-hydroxy-2-phenylindene; RBA ⫽ 2.3%), 29 (1,3-diethyl-6-hydroxy-2-phenylindene; RBA ⫽ 2.2%), and 32 (3-ethyl-6-hydroxy-2-phenylindenone-1; RBA ⫽ 1.2%). For all of these compounds, the predicted RBA ranges were between 0.1 and 1%. Reasons for these incorrect classifications included the lack of a second electronegative site (17, 19, 25, 28, 29, and 32) or a small distance between electronegative sites (20; 4 Å). As noted in Table 7, the 10 ⬎ RBA ⬎ 1% screen resulted in 17 false-positive identifications, including 2 chemicals in the RBA range of 0.1 to 1% (33 and 38), 4 chemicals in the RBA range of 0.01 to 0.1% (39, 40, 42, and 43), and 11 chemicals with RBA values of less than 0.01% (47, 49 –58). When the shielding screen for electronegative heteroatoms was employed, the number of false positive identifications decreased to 5 chemicals (33, 39, 47, 49, and 58), with one additional false negative, 38 (2,2⬘,3⬘,4⬘,6⬘-penta CB-4-ol; RBA ⫽ 0.12%), with a predicted RBA ⬍ 0.1. Using the screening rule for RBA values between 1 and 0.1%, false positive identifications were noted for 41 (RBA ⫽ 0.068%), 45 (RBA ⫽ 0.01%), and 48 (0.0005%). Of these, 45 and 48 had greater hER␣ measured affinities (Table 4), again suggesting interspecies or interlaboratory differences as a basis for the discrepancy. In summary, of the 58 compounds in the rat uterine data set, RBA ranges were correctly predicted for 21 ligands, with 12 false negative and 25 false positive classifications. Thirty-four compounds were, however, correctly classified with inclusion of the shielding rule, which decreased the number of falsepositive identifications to 11 ligands, while increasing the
279
number of false negatives to 15. For the 16 compounds with measured RBA values greater than 10%, there were 5 false negative identifications. For the 16 compounds with measured RBA values between 10 and 1%, 3 false positive identifications and two additional false negatives were noted (after inclusion of the shielding rule). Of the 7 ligands in this range incorrectly predicted to have an RBA value between 1 and 0.1%, the 4 most notable false negative predictions were associated with compounds whose measured RBA values ranged from 9.3 to 4.6%. The remaining 3 ligands had measured RBA values that ranged from 2.3 to 1.2%. Finally, for the 26 ligands with measured RBA values less than 1%, there was one false negative prediction generated upon inclusion of the shielding rule, and 8 false positive predictions. Summary and Conclusions Development and evaluation of similarity relationships to predict a specific type of biological activity based upon chemical structure requires the establishment of a knowledge base that contains training and evaluation sets of chemicals whose modes of action and potency are well defined. Minimizing the introduction of biological variability in the model development and evaluation process is critical to assessing the performance of SARs. It is also important that the training set of chemicals represents a range of structures, and associated properties, representative of the “chemical universe” of interest. Structure similarity relationships based on well-defined endpoints, and developed across a diverse set of chemicals, provide transparent models whose uncertainties can be better defined. It is also essential to define the required precision of a model to determine the data quality in the training and evaluation knowledge bases. In the present study, the model predicts RBA values within a factor of 10 ranges across 6 orders of magnitude. Consequently, variability of less than 10-fold in the training and evaluation data sets is not problematic. Of course, other applications of these training and evaluation data sets may require greater levels of precision and accuracy. To develop a model to predict potential ER binding affinity from chemical structure, Bradbury et al. (2000) used a data set of 45 compounds that had been assayed with the hER␣. Although a “leave-one-out” statistical approach was used to evaluate common reactivity patterns for 4 RBA ranges between 150 to 0.1%, it was not possible to independently assess the model with compounds not used in the training set. To more completely evaluate the model, an optimum approach would be to compare hER␣ RBA predictions to measured hER␣ values for chemicals not used in the training set. Unfortunately, such a data set did not exist in the open literature. While risking the addition of interspecies/test system variability in the evaluation process, the current study employed a data set of 99 structures that were assessed in MCF7 cells (hER) and rodent models (mER and rER) as a means to determine ability of the model to assess the activity of compounds not used in the original
280
MEKENYAN ET AL.
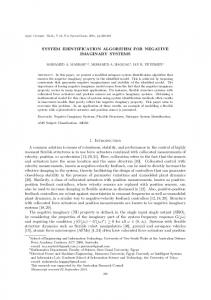
training set. For those 17 compounds that overlapped with the original hER␣ data set, measured RBA values were within an order of magnitude. The largest percentage of correct predictions was obtained for the MCF7 data set, which was most likely due to similarity in chemical structures between the two data sets, as well as the fact that the two systems are based on a similar, perhaps the same, receptor. The increase in incorrect predictions with the mouse and rat data sets was largely due to false positive identifications. The rate of false positive identifications was markedly reduced when an additional rule was included that required at least one electronegative atom to be unshielded. This occurred at the expense of a slight increase in the number of false negatives. The observation that the electronegative atom must be unshielded could reflect differences in the hER␣ and rodent receptors, or reflect a bias in the original training set where the occurrence of shielded electronegative atoms was rare. An analysis of the data set reported by Waller et al. (1996), where binding affinity was expressed in terms of pKi rather than RBA values, also indicated the need for an unshielded electronegative atom, which suggests the original hER␣ training set may not have had sufficient diversity in chemical structure. Assuming the false positive error rates for the rodent data sets are not primarily due to interspecies differences, but instead due to a bias in the original training set, a modification to the expert system rules that requires at least one electronegative atom be unshielded appears warranted. Figure 1A summarizes the results of using the hER␣-based reactivity patterns to predict RBA ranges from the combined hER␣, MCF7 cell and rodent data sets using the expert system. Figure 1B represents predictions obtained with inclusion of the shielding rule. Eight false negatives were identified among the 46 ligands (31 compounds in the MCF7 cell, mER and rER data sets) whose measured RBA values were greater than 10%. No false positive identifications were observed for ligands with measured RBA values ⬎10%. Thus, the interspecies comparison, undertaken assuming similarity between ER binding domains in the human and rodent assays, provides a reasonably robust screening result for ER ligands whose binding affinities are at least 10% of E 2, independent of the mammalian receptor system. Thirteen of the remaining 129 compounds with RBA values ⬍ 10% were incorrectly classified as false negatives, without the shielding rule (Fig. 1A), and 17 with the shielding rule (Fig. 1B). The number of false positives obtained for chemicals with RBA ⬍ 10% was 69 with the original expert system and 47 upon incorporation of the shielding rule. The increased occurrence of false positive identifications for chemicals with lower binding affinities is consistent with a lower level of biological similarity to E 2 and therefore a lower level of chemical similarity and specificity of reactivity patterns (Bradbury et al., 2000). As reported in a recent summary from a workshop sponsored by the U.S. Environmental Protection Agency (EPA), ranking and prioritization schemes for screening industrial chemicals
FIG. 1. Relationship of observed hER␣, MCF7 cell, mouse uterine, and rat uterine RBAs to RBAs predicted from an expert system reported by Bradbury et al. (2000); (A) original model; (B) model with the additional requirement that at least one electronegative atoms, with an atomic charge of -0.3 or greater, must be unshielded.
for “endocrine-disrupting potential” relies exclusively on existing chemical-specific human health and wildlife exposure and effects data. Consequently, when prioritizing chemicals for testing there is a tendency to focus upon those compounds for which data exist. One approach to help obviate this bias is to utilize 3-D SARs to expand the knowledge base for prioritization (Meridian Institute, 1999). In a related workshop cosponsored by the Society of Toxicology and Environmental Chemistry—Europe, the Organization for Economic Cooperation, and Development, and the European Commission, SARs for receptor binding and gene expression were also endorsed as promising approaches to enhance prioritization efforts (Ankley et al., 1997). The exploratory COREPA 3-D SAR technique described here was developed, in part, to facilitate this need for rapid and mechanistically credible evaluations of large chemical data sets, including the Toxic Substances Control Act (TSCA) chemical inventory, which contains more than 75,000 chemicals. Specifically, the development of COREPA-based expert systems and complementary training data sets to predict
hER␣ BINDING AFFINITY MODEL EVALUATION
ligand-receptor binding affinity are intended to support ranking paradigms for the EPA Endocrine Disruptor Priority Setting Database (Meridian Institute, 1999), and similar international programs, where prioritization decisions for testing thousands of chemicals in commerce for endocrine disruption are needed. ACKNOWLEDGMENTS This research was supported, in part, by a cooperative agreement between Bourgas University “Prof. As. Zlatarov” and U.S. EPA (CR822306-01-0); and by an agreement between the European Union and Bourgas University “Prof. As. Zlatarov” (EU Project IC20-CT98-0114, EDAEP). The authors thank Dr. Stoyan Karabunarliev for fruitful discussions. Comments on an earlier draft of the manuscript were provided by Chris Russom and Mike Hornung. Diane Spehar and Roger LePage assisted in manuscript preparation.
REFERENCES Ankley, G., Bradbury, S. P., Hermens, J., Mekenyan, O. G., Tollefsen, K.-E. (1997). Current approaches to the use of structure activity relationships (SARs) in identifying the hazards of endocrine-disrupting chemicals to wildlife. Proceedings of the EMWAT Workshop, April 1997, pp. 19 – 40. SETAC-Europe, The Netherlands. Anstead, G. M., Wilson, S. R., and Katzenellenbogen, J. A. (1989). 2-Arylindenes and 2-arilindenones: Molecular structures and considerations in the binding orientation of unsymmetrical non-steroidal ligands to the estrogen receptor. J. Med. Chem. 32, 2163–2171. Bolger, R., Wiese, T. E., Ervin, K., Nestich, S., and Checovich, W. (1998). Rapid screening of environmental chemicals for estrogen receptor. Environ. Health Perspect. 106, 551–557. Bradbury, S. P., Mekenyan, O. G., Ankley, G. T. (1998). The role of ligand flexibility in predicting biological activity: Structure-activity relationships for aryl hydrocarbon, estrogen, and androgen receptor-binding affinity. Environ. Toxicol. Chem. 17, 15–25. Bradbury, S. P., Kamenska, V., Schmieder, P. K., Ankley, G. T., and Mekenyan, O. G. (2000). A computationally based identification algorithm for estrogen receptor-ligands. Part I. Predicting hER␣ Binding Affinity. Toxicol. Sci. 58, 253–269. Brooks, S. C., Wappler, N. L., Corombos, J. D., Doherty, L. M. (1987). Estrogen structure-receptor function relationships. In Recent Advances in Steroid Hormone Action (V. K. Moudgil, Ed.), pp. 443– 466. Walter de Gruyter, Berlin. Connor, K., Ramamoorthy, K., Moore, M., Mustain, M., Chen, I., Safe, S., Zacharewski, T., Gillesby, B., Joyeux, A., and Balaguer, P. (1997). Hydroxylated polychlorinated biphenyls as estrogens and antiestrogens: Structure-activity relationships. Toxicol. Appl. Pharmacol. 145, 111–123.
281
Gabbard, R. B., and Segaloff, A. (1983). Structure-activity relationships of estrogens. Effects of 14-dehydrogenation and axial methyl groups at C-7, C-9, C-11. Steroids 41, 791– 805. Ivanov, J. M., Karabunarliev, S. H., and Mekenyan, O. G. (1994). 3DGEN: A system for an exhaustive 3D molecular design. J. Chem. Inf. Comput. Sci. 34, 234-243. Ivanov, J. M., Mekenyan, O. G., Bradbury, S. P, and Schuurmann, G. (1998). A kinetic analysis of the conformational flexibility of steroids. Quant. Struc. Act. Relat. 17, 437– 449. Korach, K. S., Sarver, P., Chae, K., McLachlan, J. A., and McKinney, J. D. (1988). Estrogen receptor-binding activity of polychlorinated hydroxybiphenyls: Conformationally restricted structural probes. Mol. Pharmacol. 33, 120 –126. Kuiper, G. G. J. M., Carlsson, B., Grandien, K., Enmark, E., Haggblad, J., Nilsson, S., and Gustafsson, J.-K. (1997). Comparison of the ligand binding specificity and transcript tissue distribution of estrogen receptor a and b. Endocrinology 138, 853– 870. Mekenyan, O. G., Ivanov, J. M., Karabunarliev, S. H., Bradbury, S. P., Ankley, G. T., and Karcher, W. (1997). A computationally-based hazard identification algorithm that incorporates ligand flexibility. 1. Identification of potential androgen receptor ligands. Environ. Sci. Technol. 31, 3702–3711. Mekenyan, O. G., Nikolova, N., Karabunarliev, S. H., Bradbury, S. P., Ankley, G. T., Hansen, B. (1999). New developments in a hazard identification algorithm for hormone receptor ligands. Quant. Struct. Act. Relat. 18, 139 –153. Meridian Institute. (1999). EPA priority-setting workshop for the endocrine disruptor screening program. January 20 –21, 1999. A meeting summary. Dillon, CO. Palomino, E., Heeg, M. J., Horwitz, J. P., Polin, L., Brooks, S. C. (1994). Skeletal conformations and receptor binding in some 9,11-modified estradiols. J. Steroid Biochem. Mol. Biol. 50, 75– 85. Qian, X., and Abul-Hajj, Y. J. (1990). Synthesis and biological activities of 11-substituted estradiol as potential antiestrogens. Steroids 55, 238 –241 Stewart, J. J. (1990). MOPAC: A semiempirical molecular orbital program. J. Comput.Aid. Mol. Des. 4, 1–105. Stewart, J. J. (1993). MOPAC 93. Fujitsu Limited, Chiba-city, Chiba 261, Japan, and Stewart Computational Chemistry. Colorado Springs, CO. VanderKuur, J. A., Wiese, T., and Brooks, S. C. (1993). Influence of estrogen structure on nuclear binding and progesterone receptor induction by the receptor complex. Biochemistry 32, 7002–7008. Waller, C. L., Oprea, T. I., Chae, K., Park, H.-K., Korach, K. S., Laws, S. C., Wiese, T. E., Kelce, W. R., and Gray, L. E., Jr. (1996). Ligand-based identification of environmental estrogens. Chem. Res. Toxicol. 9, 1240 – 1248.