International Journal of Modeling and Optimization, Vol. 5, No. 1, February 2015
A Computer Simulation Study of High Pressure Processing of Liquid Food Using Computational Fluid Dynamics Suhad S. Hussein of micro-organisms. Bacterial spores are more resistance to temperature and pressure than vegetative bacteria, and the combined pressure-temperature effect is very efficient for the treatment of spores. Also, it is known that food undergoes minimum nutrient destruction at temperatures below 100oC. Hence the application of HPP at moderate temperatures can be applied to a large number of food products; especially those contaminated with spores, which are usually sterilized thermally at 121oC. The temperature distribution in the high pressure vessel may result in a non uniform distribution of microbial inactivation and quality degradation. Without full understanding of the microbial inactivation mechanism under the combined effects of pressure and temperature, the application of such process will remain limited and expensive. Pressure is transmitted uniformly and immediately through the pressure transferring medium according to the Pascal principal, and thus the effect of pressure are independent of product size and geometry [9]. In fact, heat transfer characterizes every process, accompanied by a period of pressure increase or decrease, because an increase or decrease of pressure is associated with proportional temperature change of the vessel’s contents due to adiabatic heating [10]. Heat transfer is caused by resulting temperature gradients and can lead to large temperature differences, especially in large-volume industrial vessel. These limitations should be taken into account in analysis of High Pressure Processing (HPP), especially of the industrial size. By taking into account the nonuniform temperature distribution appearing during the process, it can be assured that the objective of the process has been accomplished everywhere within the food product. Most numerical models for predicting heat transfer during HPP of foods were based on conductive heat transfer [10], [11]. During compression, the liquid will be pumped to the treatment chamber using a high pressure pump followed by an intensifier. Liquids at extreme high pressure are compressible requiring extra fluid to be pumped to the treatment chamber. The increase of temperature due to compression induces heat transfer within the liquid and heat exchange with the treatment chamber’s walls. As a consequence, fluid density differences occur, which lead to free convection motion of the fluid. The fluid motion generated by forced and free convection strongly influences the temporal and spatial distribution of the temperature, which has already been observed using experimental techniques [12]. Hartman [12] has analyzed the mathematical modeling of convective heat transfer during HPP and included thermodynamic and fluid-dynamic effects of high pressure treatment. Pure water was considered in the process,
Abstract—In the present work, the adiabatic heating during high-pressure processing of liquid food is analyzed by means of numerical simulations. Natural convection heating within a three-dimensional cylinder filled with water as a model liquid food during sterilization is simulated. Pressure is assumed to rise from atmospheric pressure to the treatment pressure of 500 MPa. The governing equations for continuity, momentum and energy conservation are solved using a commercial Computational Fluid Dynamics (CFD) package (PHOENICS), version 3.5, which is based on a finite volume method of solution. Temperature and pressure profiles within the model liquid are predicted. The simulations show that the heat transfer process after completion of the compression process is mostly controlled by conduction, which is due to the insignificant effect of natural convection (very low liquid velocity 3x10⁻⁸ – 4x10⁻⁷ ms-1) as observed from the results of the simulation. Index Terms—CFD, high pressure processing, temperature distribution.
NOMENCLATURE CP specific heat of liquid food, J kg -1 K-1 H height of the cylinder, mm k thermal conductivity of liquid food, W m-1 K-1 p pressure, Pa r,z radial and vertical direction of the cylinder t compressing time, s T temperature, °C vr velocity in radial direction, ms –1 vz velocity in vertical direction, ms -1 β thermal expansion coefficient, K-1 μ apparent viscosity, Pa.s ρ density, kg m-3
I. INTRODUCTION In the past decade, it has become clear that high pressure processing (HPP) may offer major advantages to the food preservation and processing industry [1], [2]. Next to inactivation of microorganisms and spoilage enzymes [3], [4], promising results have been obtained with respect to application of high pressure in food processing, for gelation of food proteins [5], [6] and improving digestibility of proteins and tenderization of meat products [7], [8]. There is growing interest in the combined effect of temperature and pressure as an effective mean of inactivation Manuscript received July 12, 2014; revised October 4, 2014. Suhad S. Hussein is with Baghdad University, Iraq (e-mail:
[email protected]).
DOI: 10.7763/IJMO.2015.V5.440
78
International Journal of Modeling and Optimization, Vol. 5, No. 1, February 2015
50 in radial direction and 70 in the vertical direction. The computations domain was performed for a cylinder with a diameter of 37 mm and height of 300 mm, which is the same as those used in the high pressure unit “FOOD-LAB model S-FL-850-9-W” available at the Department of Chemical and Materials Engineering at the University of Auckland.
and it is compressed up to 500 MPa in a 4 ml chamber at different compression rates. The spatial and temporal evolution of temperature and fluid velocity fields were analyzed. It was found that the fluid motion is dominated by forced convection at the beginning of pressurization. Due to density differences, free convection sets in and dominates the fluid motion for a few seconds after the beginning of pressurization. Also, it was found that, the temperature differences occurring in the high-pressure volume depend strongly on the pressure ramp during pressurization. The adiabatic heating caused by the fluid compressing at high pressure can lead to significant temperature distribution throughout the treated food. To date, a heat transfer model for HPP that includes the above mentioned effects is limited. The development of such model is very important, as experimental testing of every single food at different operating conditions can be time consuming. In this work, the effects of transient pressure and the temperature distribution at non-adiabatic treatment chamber were analyzed and studied.
B. Governing Equations and Boundary Conditions The partial differential equations governing natural convection of the fluid being compressed and heated in a cylinder are given below [13]: 1) Energy conservation
∂T ∂T ∂T k ⎡1 ∂ ⎛ ∂T ⎞ ∂ 2T ⎤ r + vr + vz = + ∂t ∂r ∂ z ρCp ⎢⎣ r ∂ r ⎜⎝ ∂ r ⎟⎠ ∂ z2 ⎥⎦
(1)
Q + ρCp where Q is the volumetric heat generation term due to adiabatic heating (i.e. source term) in Wm-2 2) Momentum equation in the radial direction (r)
∂v ∂v ⎞ ⎛ ∂v r + vr r + v z r ⎟ = t r ∂ ∂ ∂z ⎠ ⎝ 2 ⎡∂ ⎛1 ∂ ⎤ ∂p (rv r )⎞⎟ + ∂ v2r ⎥ − + μ⎢ ⎜ ∂r ⎠ ∂z ⎦ ⎣ ∂r ⎝ r ∂r
II. NUMERICAL APPROXIMATIONS OF CONVECTIVE HEAT TRANSFER
ρ⎜
In order to analyze the temperature distribution in a liquid food in high pressure treatment, the following process is considered: a high-pressure chamber of 300 ml volume (Fig. 1) is filled with liquid food (pure water). The liquid food is compressed from ambient pressure to a maximum pressure of 500 MPa. The inflow of water is stopped when the maximum pressure is reached. The pressure level is held at 500 MPa for up to 1000 s.
(2)
3) Momentum equation in the vertical direction (z)
∂v ∂v ⎞ ⎛ ∂v z + vr z + +v z z ⎟ = ∂r ∂z ⎠ ⎝ ∂t ⎡ 1 ∂ ⎛ ∂v z ⎞ ∂ 2 v z ∂p − + μ⎢ ⎜r ⎟+ 2 ∂z ⎣ r ∂r ⎝ ∂r ⎠ ∂z ρ⎜
(3) ⎤ ⎥ + ρg ⎦
The above equations are coupled with the following equation: 4) Continuity equation
∂ρ 1 ∂ (r ρ v r ) + ∂ (ρ v z ) = 0 + ∂t r ∂r ∂z
(4)
5) The boundary conditions used were At the cylinder boundary, r = R,
vr = 0, Fig. 1. Geometry of the high pressure vessel.
vz = 0,
for
0≤ z ≤H
(5)
At the bottom and top of the cylinder, z = 0 and z = H
v r = 0,
It took 5 steps for the first 30 s of compression until reach 500 MPa and another 5 time steps for the total of compression of 1000 s. During the holding phase, the pressure remains constant. The initial temperature of the fluid and the wall temperature of the treatment chamber were assumed to be at 20oC during the whole period.
v z = 0,
for
0≤r≤R
(6)
for
(7)
At t = 0, P = 0.1 MPa, 0 ≤ r ≤ R and 0 ≤ z ≤ H At t = 0,
A. Computational Grid A non-uniform grid system in radial and vertical directions is used in the simulation. A grid system in radial and vertical directions is used in the simulation to improve the computation. The whole domain was divided into 3500 cells:
for
P = 500 MPa,
(8)
0 ≤ r ≤ R and 0 ≤ z ≤ H
Initially the fluid is at rest and is at a uniform temperature and pressure
79
International Journal of Modeling and Optimization, Vol. 5, No. 1, February 2015
T =Tref = 20oC, vr = 0,
vz = 0
at
0 ≤ r ≤ R,
0≤ z ≤ H
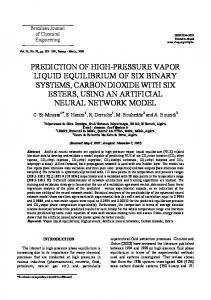
with the walls of the pressure chamber. As a consequence, density differences occur and lead to free convection of the fluid. The fluid motion generated by forced and free convection strongly influences the temporal and spatial distribution of the temperature, which was already observed using experimental techniques [14]. In this study, the pressure and temperature distribution, and the location of the hottest heating zone (HHZ) during the process, are compared and analyzed. Fig. 2 shows the pressure variation along the height of the cylinder after the compression periods of 6 s, 18 s and 30 s respectively. In order to minimize numerical errors the pressure field solution calculates the pressure relative to that fixed at the inlet, which was 500 MPa. As a result, the calculated pressure field primarily shows the hydrostatic gradient which for a 300 mm height cylinder is expected to give pressure of 2.94 kPa at the base in excess of the pressure at the inlet. Fig. 3 shows the pressure variation along the height of the cylinder, which is related to the static head only, since the external applied pressure (500 MPa) was not included as discussed above. The kinetic head is negligible due to the extremely low liquid velocity (3×10⁻⁸ – 4×10⁻⁷ ms-1) in the cylinder.
(9)
The properties of the model liquid food (water) in the current simulation at atmospheric pressure were: ρ =998.23 kg m-3, CP = 4181 Jkg-1 K-1, k = 0.597 Wm-1K-1 and β = 1.18× 10⁻⁴ K-1 as built in the software code PHOENICS for the properties of water at 20oC. As the pressure and temperature changes during compression, the program calculates the new values of physical properties, with the aid of FORTRAN statements written. The properties of water are calculated based on the updating values at every time step, which is done using the subroutines in PHOENICS, named CHEMKIN. The liquid (water) is compressible under high pressure. Appropriate equations of state describing the density as a function of pressure and temperature have to be added to the equations as explained above. Another built in subroutine used in the simulation is named PRESS0, which is the parameter representing the reference pressure, to be added to the pressure computed by PHOENICS in order to give the physical pressure needed for calculating density and other physical properties. The use of this variable is strongly recommended in cases in which the static component of the pressure is much greater than the dynamic head. The reason is that the static component can be absorbed in PRESS0 leaving the stored pressure field, to represent the dynamic variations which otherwise may be lost in the round off, according to the machine precision and the ratio of dynamic pressure to the static head. Several built in subroutines are used as well in this simulation, such as DVO1DT, used to calculate the volumetric coefficient of thermal expansion of the phase 1 of the material used (water). It is useful for the prediction of natural-convection heat transfer. DRH1DP, which is used to calculate the compressibility: (
d ρ1 ) / ρ1 dP
ie.
d (ln ρ1) dP
Fig. 2. Pressure variation along the height of the cylinder at a compression of 100 MPa, 300 MPa, and 500 MPa after periods of 6 s, 18 s and 30 s respectively.
(10)
III. RESULTS AND DISCUSSION During high pressure processing of food, an increase of temperature due to compression is observed as a result of partial conversion of mechanical work into internal energy. This is known as adiabatic heating. In reality the situation is much more complex. In the simulation presented here, heat exchange between the treated fluid and the cylinder wall as well as the cooling effect caused by the entering fluid during compression is included in the analysis. Temperature distribution, location of the hottest zone, velocity profile and pressure profile during the process, are compared and analyzed based on the simulations conducted. Experimental measurements are used to validate these simulation results. During compression, the liquid will move by forced convection due to the movement of the piston used for compression. This is because; liquids at extreme high pressure are compressible. The increase of temperature induces heat transfer within the liquid and heat exchange
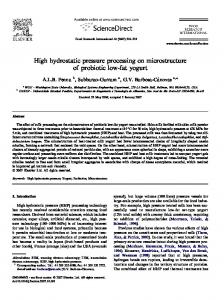
Fig. 3. Static Pressure variation in the fluid along the height of the cylinder (t=1000 s, P=500 MPa).
In order to minimize numerical errors the pressure field solution calculates the pressure relative to that fixed at the inlet, which was 500 MPa. As a result, the calculated pressure 80
International Journal of Modeling and Optimization, Vol. 5, No. 1, February 2015
have higher density creating it to flow downward. At all other locations in the bulk of the cylinder, the liquid will flow upward as shown in Fig. 5.
field (Fig. 3) primarily shows the hydrostatic gradient (2.90 kPa at the base). In order to minimize numerical errors the pressure field solution calculates the pressure relative to that fixed at the inlet, which was 500 MPa. As a result, the calculated pressure field (Fig. 3) primarily shows the hydrostatic gradient (2.90 kPa at the base). Due to the high hydrostatic pressure, the velocities are very small, and hence the effect of natural convection heat transfer at the end of compression is expected to be very small in this situation. This is confirmed by the temperature profile in the liquid food shown in Fig. 4. The hottest region (34.9oC) after 1000 s of compression is almost at the center of the cylinder, with only very little shift toward the top of the cylinder. This is very close to the increase in temperature due to the adiabatic heating reported in the literature. Fig. 3 shows that the increase in the fluid average temperature in the cylinder will be less than 3oC per 100 MPa due to the cooling at the wall of the cylinder
IV. CONCLUSION Numerical simulation of non-adiabatic compression of liquid food has been conducted using finite volume method analysis. The simulation shows that, at holding period and at the end of compression, the effect of natural convection heat transfer in the High Pressure Processing unit is insignificant. However, such conclusion maybe limited to the case in which no external heating was applied. REFERENCES [1] [2]
[3] [4]
[5] [6] [7] [8] [9]
Fig. 4. Temperature profile of the fluid due to non adiabatic compression (t=1000 s, P=500 MPa).
[10]
[11]
[12]
[13] [14]
G. V. B. Canovas, U. R. Pothakamury, E. Paulo, and B. G. Swanson, Non Thermal Preservation of Foods, Dekker, New York, pp. 9-52, 1997 L. Ludikhuyze, I. Indrawati, C. V. D. Broeck, C. Weemens, and M. E. Hendrickx, “Effect of combined pressure and temperature on soybean lipoxygenase. 2. Modeling inactivation kinetics under static and and dynamic conditions,” J. of Agricultural Food Chemistry, vol. 46, pp. 4081-4086, 1998. I. Seyderhelm, S. Bogulawiski, G. Michaelis, and D. Knorr, “Pressure induced inactivation of selected food enzymes,” J. of Food Sci., vol. 61, no. 2, pp. 308-310, 1996. G. C. Yen and H. T. Lin, “Comparison of high pressure treatment and thermal pasteurization on the quality and shelf life of guava puree,” International Journal of Food Science and Technology, vol. 31, pp. 205-213, 1996. A. Richwin, A. Roosch, D. Teichgraber, and D. Knorr, “Effect of combined pressure and temperature on the functionality of egg-white proteins,” Eur. Food Science, vol. 43, no. 7/8, pp. 27-31, 1992. T. Ohshima, H. Ushio, and C. Koizumi, “High pressure processing of fish and fish products,” Trends in Food Science and Technology, vol. 4, pp. 370-375, 1993. P. E. Bouton, A. L. Ford, P. V. Harris, J. J. Macfarlane, and J. M. O’Shea, “Pressure treatment of post rigor muscle: effects on tenderness,” J. of Food Scince, vol. 42, pp. 132-135, 1997. T. Ohmori, T. Shigehisa, S. Taji, and R. Hayashi, “Effect of high pressure on the protease activities in meat,” Bio. Chemistry, vol. 55, no. 2, pp. 357-361, 1991. D. Knorr, “Effects of high hydrostatic pressure processes on food microorganism,” Trends in Food Science and Technology, vol. 4, pp. 370-375, 1993. S. Denys, L. R. Ludikhuyze, A. M. Van Loey, and M. E. Hendrickx, “Modeling conductive heat transfer and process uniformity during batch high pressure processing of foods,” Biotechnology Progress, vol. 16, pp. 92-101, 2000. S. Denys, A. M. Van Loey, and M. E. Hendrickx, “A modeling approach for evaluating process uniformity during batch high hydrostatic pressure processing: combination of numerical heat transfer model and enzyme inactivation kinetics,” Innovative Food Science and Immerging Technologies, vol. 1, pp. 5-19, 2000. C. Hartmann, “Numerical simulation of thermodynamic and fluid-dynamic processes during the high-pressure treatment of fluid food systems,” Innovative Food Science & Emerging Technologies, vol. 3, pp. 11-18, 2002. R. B. Bird, W. E. Stewart, and E. N. Lightfoot, Transport Phenomena, John Wiley and Sons, New York, 1976. C. Hartmann, A. Delgado, and J. Szymczyk, “Convective and diffusive transport effects in a high pressure induced inactivation process of packed food,” Journal of Food Engineering, vol. 59, pp. 33-44, 2003.
Suhad S. Hussein was born in Baghdad, Iraq. She got her BSc in computer in Baghdad, Iraq in 1994. And she got her MSc in computer in Baghdad, Iraq in 2006. Her positions are as following: Director of Computer Labs in the College of Mamoun University in 2001, Director of the Computer Center at the College of Mamoon in 2002. Academic position: Teacher of College of Dentistry, Baghdad University.
Fig. 5. Fluid velocity profile during non-adiabatic compression (t=1000 s, P=500 MPa).
Fig. 5 shows the velocity profile of the compressed fluid in the cylinder. The fluid is heated due to compression. Due to the external cooling at the wall, the fluid adjacent to it will 81