workers in plain language using a relational database (RDB). First ... RDB software read component files into a database file, integrated all data, and printed.
Field Report
Industrial Health 2000, 38, 331–337
Creating Notifications Tailored for Individual Workers by Using a Database: A Conceptual Framework and Its Application Norio MISHIMA1*, Noboru IWATA2 and Takashi SHIMIZU3 1
Department of Mental Health, Institute of Industrial Ecological Sciences, University of Occupational and Environmental Health (UOEH), Japan 2 Life Course and Health Research Center, CUPA, Florida International University, USA 3 Occupational Health Training Center, University of Occupational and Environmental Health (UOEH), Japan Received February 4, 2000 and accepted May 29, 2000
Abstract: Although prevention strategies to assure good mental health in the workplace have become important, worker notification in studies using psychometric tests has rarely been discussed. Until now it has been difficult to prepare a large number of notifications that are tailored well for individual workers. We have developed a system to create notifications that explain the results for individual workers in plain language using a relational database (RDB). First, scores for each test were divided into categories and the workers’ data was classified. Then, explanations were written for each category. RDB software read component files into a database file, integrated all data, and printed out notifications. After the system was developed, we realized its high potential for use in occupational health care, as well as in many other fields. We also report an example of its application. Key words: Notification, Relational database, Mental health, Psychometric test, Personal computer, Tailored information
Introduction In Japan, the Industrial Safety and Health Law1) requires employers to notify employees of the results of their medical checkup carried out regularly in the workplace. One of the purposes of this legal obligation is to offer all workers an opportunity to utilize the information from their checkup to personally attend to their health themselves. Hence, the law requires that the information should be returned in a way that facilitates each worker’s understanding of it. When we respect the spirit of the law in our research activities regarding occupational health, we should pay careful attention to the method of notification of the results to respondents or workers, so that all workers can fully utilize them. The importance of worker notification in occupational health *To whom correspondence should be addressed.
studies has already been discussed. NIOSH2) held a workshop on the methodology of worker notification in 1991, where the main topic was notification of workers whose health was at risk because of exposure to toxic substances3, 4). Most discussions focused on the notification of these hazards. In these cases, occupational health care staff mainly informed workers of potential risks to their health revealed by the studies along with overall study results. Because concerns about stress and mental health in the workplace have been increasing5), many studies using such psychometric tests as the General Health Questionnaire6) and the Center for Epidemiologic Studies Depression Scale (CES-D) 7) have been conducted worldwide. However, worker notification in this type of research has rarely been discussed. Notification in the study of stress and mental health includes issues that are different from those in the study of exposure to toxic substances. Stress and mental
332 health problems are closely related to human relationships in the workplace and are not confined to a specific group of employees. Hence, researchers must explain to all workers in detail whatever test results, i.e., normal or abnormal scores, they have. As a result of such notification, workers should be motivated to participate in activities to improve their work environments from a mental health standpoint. In other words, this process can be the first step toward an intervention by which workers are advised about reducing stress in their interpersonal relationships. In terms of tailoring, Rakowski et al.8) reported on the usefulness of tailored intervention for increasing the receipt of screening mammography for women patients. When patients were assigned to one of three intervention groups: No Educational Materials, Standard Materials, and StageMatched Materials, and received different mailed educational packets, the Stage-Matched group showed significantly higher receipt of mammography than the No Materials group did, whereas the Standard group did not differ from the No Materials group. They concluded that stage-matched, tailored materials might be a means to encourage screening mammography. When an occupational health care staff or a researcher attempts to make a useful notification for the abovementioned purpose, they should consider carefully how to explain the results of psychometric tests to workers. Reporting only figures or indicating that their scores are normal or abnormal is not considered to be an effective way to notify them. The results should be described in plain language so that every worker can easily understand his/ her own results. Hence, when psychometric tests are included in a study, a notification specific to each worker should be prepared based on his/her test results. Creating these notifications is not technically difficult if sufficient economic and human resources are available. However, this requirement imposes serious questions about how to prepare documents for occupational health care staff with limited resources. Nevertheless, to our knowledge, no reports have been published so far regarding practical strategies to overcome these difficulties. We recently developed a system with which we can create notifications that explain psychometric test results to individual workers in plain language. We were able to overcome the problem of limited resources by using a relational database management system. After applying our system to make notifications in two different mental health studies (unpublished data), we realized that it has a high potential for use in many fields. In this report, we introduce the conceptual framework of
N MISHIMA et al. our system, describe an example of its application, and discuss its potentialities.
Methods Outline of our notification system In the first step of making notification documents, we determined criteria for dividing test scores for each psychometric test into several categories. These criteria were used to classify all of the workers’ scores for each of the tests, and the results were then saved in a computer file. Secondly, we wrote explanations for each category in each test and saved these in a different computer file. Personal information such as workers’ names and affiliations was also saved in another file. Thirdly, we used relational database (RDB) software to read these component files into a single database file in which the component files became individual tables. The tables were then integrated by creating relationships that connected their contents. Finally, we used the RDB software to create a form to print out the notifications. In the following sections, we elaborate on the steps for creating notification documents. Our system does not depend on a specific computer system, but in this report we assume that a personal computer (PC) is used. To handle the procedures written in this report, a PC has to be equipped with relational database software and a printer with high quality output. 1) What is an RDB? To understand how our system works, it is necessary to have a basic understanding of what an RDB is. An RDB manages data in the form of tables that consist of records and fields and can handle many tables simultaneously9). A record corresponds to a sample in data analysis, and a field corresponds to a variable. Different tables in a database can be integrated by creating relationships that connect the same field in different tables. For example, if a database has a results table and a personal information table, then the two tables can be connected using one key variable, such as an identification number, that appears in both tables to identify data from the same individual. After relationships are created, data from the personal information table can be matched automatically with the appropriate data from the results table and inserted into the document. 2) First step: Classification of test scores Our system enabled every worker to receive a notification that gave specific explanations of their own test results. In each psychometric test, however, workers whose scores were similar obtained the same explanation. In order to explain the results in this way, we decided on the criterion for dividing test scores into several categories in each psychometric test.
Industrial Health 2000, 38, 331–337
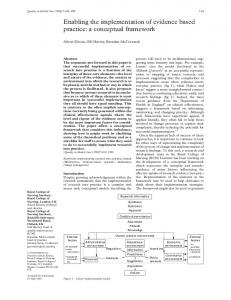
NOTIFICATIONS TAILORED FOR INDIVIDUAL WORKERS As for the criterion, we could use either the standard cutoff point given by test developers or our own classification by which scores were temporarily divided into several categories. We mainly used the latter method for categorization. Data analysis software was then used to classify all the workers’ scores for each test and the results were saved in a computer file. When data was missing for a certain test, a special value, such as 0 or 9, was used to generate a specific explanation about the missing values. 3) Second step: Writing explanations for each category We wrote explanations for each category in each test and saved these in a separate computer file. In this step, we made good use of our own expertise in using the tests and interpreting the results. The explanations corresponded to the score ranges of each category. We used an expression such as “No valid data was available” for categories with missing values. The explanations and their corresponding category numbers were saved in different files for each test. We also created a file that held personal information such as workers’ names and affiliations. The length of explanations is not a problem because the latest PC software can manage long entries in data fields. Factors to consider in this step include the balance of explanation lengths among the tests and the desired appearance of the finished notification document, i.e., size of paper, fonts, etc. 4) Third step: Data integration using an RDB Each notification document was made up of three types of data that were stored in different component files. The first type was personal information, called profile data, such as workers’ names, affiliations and identification numbers. The second type was the research data and consisted of test scores, their category numbers and identification numbers. The third type consisted of the category numbers and their corresponding explanations for the various psychometric tests. RDB software was used to read these component files into a single database file. All component files were stored as individual tables in the overall database file. The tables were integrated by creating relationships that connected their contents. This is the most important process in database management, and RDB software provides the basic functions to carry it out. After this process, the three types of data could be retrieved for each individual worker. Fig. 1 shows how such relationships are structured. Each pair of tables must have a common field. For example, both the profile data table and the research data table had fields for workers’ identification numbers (ID No.). Once this relationship was created, an individual worker’s name could
333
Fig. 1. The structure of relationships between different types of tables. indicates that these fields are connected in a database. Psy Test: psychometric test.
be easily matched to that worker’s research data. In the same way, the categories for each test in the research data were matched with their corresponding explanations. 5) Fourth step: printing the final document RDB software can be used to print the final notification document by creating a printing ‘form’ based on the integrated data. Our form consisted of two parts. The main part contained the test results and their corresponding explanations and changed automatically for individual workers. The other part contained general information that did not change among workers. RDB software usually supplies functions for manually modifying the printing form so that readability can be maximized. As an option, graphs could also be added. Once the form was designed, we used the RDB software to print out the notification documents. We were then able to send workers notifications that contained both general and specific information explaining the results of psychometric tests based on their own scores. Application of our system to a research project In order to illustrate the usefulness of our notification system, we report the process of making notifications in a research project (unpublished) that was recently carried out. 1) Research aim The aim of the research was to clarify the influence of stress in the workplace upon the risk factors of cardiovascular diseases and diabetes mellitus. In this study, workers in a petrochemical company located in the Kanto region of Japan were asked to fill in a questionnaire when they received their annual medical checkup. Then, the relationship between
334 the results of psychometric tests that were included in the questionnaire and workers’ physical conditions revealed by the medical checkup was studied. 2) Subjects This company operates two factories and has a total of 1683 employees (1453 male and 230 female) with an average age of 38.2 years. All staff responded to our request to fill in the questionnaire. 3) Psychometric tests used in the research We considered that measuring such psychological conditions as anxiety, anger, and depression, was very important to evaluate stress reaction. Hence, we included the following scales in the questionnaire; they were StateTrait Anxiety Inventory-Form Y (STAI-Y)10), State-Trait Anger-Expression Inventory (STAXI)11), and CES-D. The ‘Social Support’ scale of the NIOSH Generic Job Stress Questionnaire12) was also included. In addition, we included a specific question that asked whether or not workers sought consultation regarding their health concerns. 4) Computer software Both analyzing data and making notifications were performed on a personal computer with a Windows 95® operating system. SAS13) was used to analyze and transform data. Microsoft Access 97® was used as RDB software to make notifications.
Results We describe the actual process of making notification documents tailored for the individual employees of this company. An occupational physician of the company, who was also a member of the research project, explained the purpose of the research to workers and asked them to answer the questionnaire. The questionnaires were collected when workers underwent checkups, and then were sent to us. Finally, we inputted and stored data in computer files. The same data was used for the analyses and notification. Before actually beginning the process, we needed to establish our own principle of how to notify workers involved in the project, because there were many possible ways to account for the test results. The basic principles established for the research were as follows. First, we emphasized ease of comprehension rather than accuracy of explanation, although we considered both conditions to be important. Hence, we took great care to write explanations that would be easily understood by workers. Secondly, we took into consideration the characteristics of how Japanese people in general respond to psychometric tests. Iwata et al.14) already reported that the responses of Japanese people to items that
N MISHIMA et al. describe positive emotional feelings appear to be quite different from those of their U.S. counterparts. Hence, we divided the items of STAI-Y into two groups; the anxietyabsent or positively worded items and anxiety-present or negatively worded items, and then these groups of items were treated as subscales. To classify test scores, we divided the scores of every subscale into three categories, i.e. high, middle and low groups, as shown in Table 1. In this step, we used our own classifications. By using SAS, we standardized each subscale to have a mean of 100 and a standard deviation of 20, and then classified the workers’ responses according to the standardized scores. The score ranges of the three categories were different among subscales, based on the characteristics of the scales and the above-mentioned principles. When explaining the results of STAI-Y, we combined the results of its two subscales. Since the subscales had three categories respectively, the combined explanation that appeared in the corresponding paragraph of the document was selected out of nine kinds of explanation for the scale. The results of STAXI were treated in the same way. Responses to the question that asked workers their intention of seeking consultation were treated as an independent scale, although it did not have a specific score, because the question simply asked for a response of ‘yes’ or ‘no’. The most important part of the notifying process was to construct an overall framework for explaining the results of psychometric tests to workers. Table 1 shows our final framework. In the table, we indicate only the outline of explanations to describe the categories of every scale. However, we used a more detailed description with colloquial expressions in the final document. We also prepared a specific category for each scale to explain that the response was missing, but we omitted its description from the table, since it was treated in the same way as described in the first and second steps of Outline of Our Notification System. In the third step of making notifications, workers’ responses to the questionnaire were matched with their personal profile, such as their name and department, by using their identification number. We also included the radar-chart graph that indicated the standardized score of the scales. After printing documents in the fourth step, we returned the notifications by putting them in a specific envelope with a small window on one side. Only the name and department of individual workers could be seen from this window. In this way, we attempted to avoid mistakes in returning notifications to workers, while ensuring confidentiality. An example of the actual document is shown in the Appendix.
Industrial Health 2000, 38, 331–337
335
NOTIFICATIONS TAILORED FOR INDIVIDUAL WORKERS Table 1. The basic framework to explain the results of psychometric tests Original scale and subscale
Label in notification
Standardized score range
STAI-Ya Trait (anxiety-absent)b
Calmness
under 80 80–100 over 100 under 100 100–120 over 120
you lack calmness you lack calmness a little you are calm enough you are not influenced by things you tend to be worried a little you tend to be very worried
under 100 100–120 over 120 under 80 80–120 over 120
you do not get angry often you sometimes get angry you often get angry you suppress anger too much you express anger appropriately you express anger too much
Trait (anxiety-present) STAXIa Trait
Anger Out
Worry
Short temper
Anger expression
Outline of explanation
CES-Dc
Mental energy
under 80 80–100 over 100
you have low energy you have slightly low energy you have enough energy
Social Support
Interpersonal relationships at work
under 100 100–120 over 120
your relationships are not good enough you have appropriate relationships you have very good relationships
Help-seekingd
Seeking consultation
yes no
you can consult health care staff when you need to, do not hesitate
a
These scales were explained as a combined item of subscales in the notification. bThis subscale is calculated by reversing responses in the original scale. In this notification, however, responses were not reversed. So, the higher the score of this subscale, the lower the anxiety of respondents. cThis scale is also reversed. So, the higher the score of this scale, the lower the depression of respondents. dA single item with a yes-or-no answer was used to ask whether respondents seek consultation about their health concerns.
Discussion In this report, we have explained the concept and framework of a notification system that we developed when we had to return the results of a questionnaire survey to individual workers at a company. We thought that informing them only of their test scores was insufficient to either satisfy the workers’ needs or make them aware of their own conditions. We intended to give them a clear understanding of their own test results and to motivate them to take an interest in activities that would improve their work environments relative to mental health. To meet this requirement, we planned to return the results in a document that was written in plain language that all the workers could understand easily. Incidentally, our purpose of explaining the actual notification process is not to indicate that our classifications of psychometric tests and strategy to explain them are one
of the best ways to notify workers, but to effectively exemplify the easiness and usefulness of our system. Hence, we would like to mainly discuss the importance and applicability of our system in this report. The issue of test classifications will be dealt with elsewhere. We have applied our new system to make notifications in two different mental health studies in Japan, one of which we have described as an example in this report. From these experiences we realized that it has a high potential for use in many fields, including not only research activities, but also the regular work of occupational health care staff, human resources professionals, and others. We also noticed that our system would meet the above-mentioned demand of the Industrial Safety and Health Law in Japan. The most remarkable advantage of our system is that a researcher or a staff member is capable of making notifications tailored to each respondent without using any specialized programs. The importance of our system lies in
336 its ease of use and its generality. There may be other methods that can produce this type of document, but it would be practically impossible for a small number of staff to make the extensive documentation required for individual workers, without a specialized program. In addition, our system does not depend on specific software, and is flexible enough to be easily adjusted when psychometric tests are changed. Besides this advantage, our system provides new flexibility in explaining the results of psychometric tests. When determining classification criteria for multiple psychometric tests, one can make additional categories that combine classifications, as indicated in the explanations of STAI-Y and STAXI. For example, if both tests A and B have three categories, the combined results of the two tests could have nine (= 3 × 3) categories. Therefore, one can utilize one’s own knowledge of the relationships between the two psychometric tests to create a feedback document based on the information and interpretation of the combined instruments. A potential variation of this combination method would be to combine respondents’ demographic information with test results, so that a researcher could use different versions of explanations that are appropriate for individual workers based on their social background. A researcher could prepare notifications with the same contents in different styles, i.e., formal and colloquial. This device may attract the workers’ interest and increase effectiveness. Of course, one must be sensitive in making appropriate relationships between multiple sources of information. When a researcher conducts similar studies again, existing component files can be reused. A new component file must be prepared every time a new instrument is used, but this process offers an opportunity to create a database to explain the results of many different psychometric tests. When many different kinds of information and experience are accumulated in the database, it would allow one to further study the methodology of worker notification regarding mental health and coping with stress in the workplace. Although our system has substantial advantages, a staff member or a researcher may have some difficulties when using an RDB for the first time. However, computers are becoming increasingly user-friendly and one can expect to master these procedures quickly. An experienced PC user will find it easy to create component files because the process is similar to those used in data analysis and word processing. However, to use RDB software smoothly after this step, one needs to have a sufficient understanding of RDB functions generally and how to use their specific RDB software program. The essential requirements are to make sure that
N MISHIMA et al. component files are read correctly and to create appropriate relationships among tables. Sufficient knowledge of the file formats that are used frequently with RDB software will help to avoid problems in the practical steps. We believe that our system to create notifications tailored for individual workers has a high potential for use in many different fields and we hope that it will encourage many researchers and occupational health care staff to communicate with workers more effectively.
References 1) Japan Industrial Safety and Health Association [JISHA] (1996) Revision of Industrial Safety and Health Law. In JISHA Newsletter No. 18. Available: http:// www.jisha.or.jp/english/newsletr/safety.htm 2) Schulte PA, Connally LB (1993) Workshop on the methodology of worker notification. Am J Ind Med 23, 1. 3) Needleman C (1993) Worker notification: lessons from the past. Am J Ind Med 23, 11–23. 4) Averill E, Henry CJ, Rubenstein H, Sattler B, Tirey SL (1993) Content of worker notification. Am J Ind Med 23, 71–6. 5) Shimizu Y, Makino S, Takata T (1997) Employee stress status during the past decade (1982–1992) based on a nation-wide survey conducted by the Ministry of Labour in Japan. Ind Health 35, 441–50. 6) Goldberg DP (1972) The detection of psychiatric illness by questionnaire: a technique for the identification and assessment of non-psychotic psychiatric illness. Oxford University Press, London. 7) Radloff LS (1977) The CES-D scale: a self-report depression scale for research in the general population. Appl Psychol Measur 1, 385–401. 8) Rakowski W, Ehrich B, Goldstein MG, Rimer BK, Pearlman DN, Clark MA, Velicer WF, Woolverton H (1998) Increasing mammography among women aged 40–74 by use of a staged-matched, tailored intervention. Prev Med 27, 748–56. 9) Hernandes MJ (1997) Database design for mere mortals. 440, Addison-Wesley Developers Press, Boston. 10) Spielberger CD (1983) Manual for the State-Trait Anxiety Inventory: STAI (Form Y). Consulting Psychologists Press, Palo Alto, California. 11) Spielberger CD (1988) Manual for the State-Trait Anger Expression Inventory (STAXI). Psychological Assessment Resources, Odessa, Florida. 12) Hurrell JJ Jr, McLaney MA (1988) Exposure to job
Industrial Health 2000, 38, 331–337
NOTIFICATIONS TAILORED FOR INDIVIDUAL WORKERS stress: a new psychometric instrument. Scand J Work Environ Health 14 (suppl 1), 27–8. 13) SAS Institute Inc. (1988) SAS® Procedures Guide, Release 6.03 Edition. 441, SAS Institute Inc., Cary, NC.
Appendix
An example of notification The size of the sheet is 257 × 364 mm.
337
14) Iwata N, Mishima N, Shimizu T, Mizoue T, Fukuhara M, Hidano T, Spielberger CD (1998) Positive and negative affect in the factor structure of the State-Trait Anxiety Inventory for Japanese workers. Psychol Rep 82, 651–6.