Sep 1, 2012 - My main concern during my studies has not been to find the best way. ..... SMEs create 2 out of 3 new jobs (US Small Business Administration.
SMES AND SUPPLY CHAIN MANAGEMENT: A FUNCTIONAL PERSPECTIVE
Jafar Rezaei
SMES AND SUPPLY CHAIN MANAGEMENT: A FUNCTIONAL PERSPECTIVE
Proefschrift
ter verkrijging van de graad van doctor aan de Technische Universiteit Delft, op gezag van de Rector Magnificus prof. ir. K.C.A.M. Luyben, voorzitter van het College voor Promoties, in het openbaar te verdedigen op dinsdag 2 oktober 2012 om 12.30 uur
door Jafar REZAEI Master of Science in Industrial Management, University of Tehran, Iran geboren te Shahreza, Iran.
Dit proefschrift is goedgekeurd door de promotor: Prof. dr. P. Trott Copromotor: Dr. J.R. Ortt. Samenstelling promotiecommissie: Rector Magnificus, Prof. dr. P. Trott, Dr. J.R. Ortt, Prof. dr. A. Labib, Prof. K. Ruijgrok, Prof. dr. J.C.M. van den Ende, Prof. dr.ir. L.A. Tavasszy, Prof. dr. C.P. van Beers,
voorzitter Technische Universiteit Delft/University of Portsmouth, promotor Technische Universiteit Delft, copromotor University of Portsmouth, UK Tilburg University Erasmus Universiteit Rotterdam Technische Universiteit Delft Technische Universiteit Delft
ISBN: 978-90-90-27097-5 Copyright © 2012 by Jafar Rezaei All rights reserved. Save exceptions stated by the law, no part of this publication may be reproduced, stored in a retrieval system of any nature, or transmitted in any form or by any means, electronic, mechanical, photocopying, recording or otherwise, included a complete or partial transcription, without the prior written permission of the author, application for which should be addressed to author.
ii
Acknowledgements The road to understanding ourselves as human beings and the world in which we live is infinite. To keep from being overwhelmed by the sheer scale of the journey, we have designed some station along the way, one of the last of which is ‘PhD station’. However, in light of the endless of the journey we are on, we may just as well the PhD station as a beginning. My main concern during my studies has not been to find the best way. Instead, I have tried to find ‘a way’, for which, like anybody, I needed someone to put me in the right direction and people who stood by me on my journey. I have been very fortunate in both areas! First of all I want to thank my promoter Paul Trott, who has been a tremendous help to me on my journey to the PhD station, who have me a lot of freedom to develop my scientific work independently, and who believed in my work, giving me courage and inspiration on the way. Special thanks go to my co-promoter, Roland Ortt, someone from whom I learned a lot, not only in my scientific career, but also in my personal life! We had many creative meetings which were full of learning and fun for me. Like any other PhD candidate, I encountered some closed doors, and some would simply say: “this is your problem”. These people are rational. Irrationality and unfairness happen when someone adds another lock to the door, and kindheartedness appears when someone is kind enough to hand you a golden key. Roland, that someone was you. Many thanks! I am also grateful to many other persons during my PhD. I am grateful to Victor Scholten, who kindly provided me with the data on the entrepreneurial orientation of 59 Dutch SMEs, and who contributed to the second chapter of this book. I would like to thank my former roommates Geerten van de Kaa, Sergey Filippov, and Ayoub Mohammadian for the many prolific brainstorming discussions we had. I also wish to thank Patrick van der Duin, Ardalan Haghighat Talab, Mohammadbashir Sedighi, Marian Bosch-Rekveldt, Cees van Beers, Erik den Hartigh, Dap Hartmann, Elisa Anggrani, Claire Stolwijk, Mozhdeh Taheri, Prap Suprapto, Herman Mooi, Laurens Rook, Robert Verburg, and Sam Solaimani for their encouragement, El Arkesteijn and Helen Keasberry for their kindness and support in conducting my survey, and Fardad Zand and Mohsen Davarynejad for their invaluable support in my personal life. I wish to thank the managers of 314 high-tech SMEs in the Netherland who completed my survey, and the manager of the broiler iii
company who provided me with data for my case study in chapters three and four. During my PhD, I have had the opportunity to work on some other scientific papers with some of my best colleagues and friends: Jos Vrancken, Jan van den Berg, Carlos Coello Coello, Shad Dowlatshahi, Mohsen Davarynejad, Mansoor Davoodi Monfared, Geerten van de Kaa, and Negin Salimi, from whom I learned a lot. Thank you all! Last but not least, I am really grateful to Negin for her unconditional support and sacrifices. I would like to thank my parents, Hamzeh and Ehteram, my brother, and my sisters for their continuing support and encouragement, and my son, Pedram for the happiness he brings to me every second. I am indebted to you all forever!
Jafar Rezaei 1 September 2012 Delft, The Netherlands
iv
Table of Contents Acknowledgements
iii
List of Figures
ix
List of Tables
x
1
1
Introduction 1.1 Small-to-Medium-Sized Enterprises
2
1.2 Supply Chain Management
6
1.3 Research Methodology 1.3.1 Problem definition 1.3.2 Objectives 1.3.3 Research questions 1.3.4 Scientific and managerial significance
8 8 10 11 12
1.4 An overall view of the other chapters
13
1.5 References
16
2 Measuring entrepreneurship: expert-based vs. data-based methodologies
25
2.1 Introduction
26
2.2 Literature review
27
2.3 Methodologies 2.3.1 Naïve 2.3.2 Statistical 2.3.3 Fuzzy logic 2.3.4 Data Envelopment Analysis (DEA)-like
29 29 30 31 33
2.4 Application 2.4.1 Description of the real-world case and data collection 2.4.2 Naïve methodology 2.4.3 Statistical methodology 2.4.4 Intended fuzzy inference system 2.4.5 DEA-like methodology
35 35 36 36 37 41
2.5 Comparison 2.5.1 Ranking the firms 2.5.2 Classification
44 44 47 v
2.5.3 2.5.4
3
Post analysis (vulnerability) Data-set limitation
48 49
2.6 Conclusions, implications and future research 2.6.1 Conclusion 2.6.2 Managerial implications of the findings 2.6.3 Future research
49 49 51 51
2.7 References
52
A Multi-Variable Approach to Supplier Segmentation
57
3.1 Introduction
57
3.2 Literature review 3.2.1 The process method to supplier segmentation 3.2.2 The portfolio method to supplier segmentation 3.2.3 The involvement method to supplier segmentation 3.2.4 Evolution of supplier segmentation methods
59 59 60 60 63
3.3 A New Approach to Suppler Segmentation 3.3.1 Supplier selection and segmentation variables 3.3.2 Partnership and collaboration in other activities and functional areas 3.3.3 Supplier management and supplier development 3.3.4 The practical steps of supplier segmentation
65 65 72 74 77
3.4 Illustration of the proposed approach in a real-world situation 78 3.4.1 Supplier segmentation for purchasing function 80 3.4.2 Supplier segmentation for marketing & sales 81 3.5 Discussion, Conclusion and Future Research Directions
84
3.6 References
86
4 Multi-Criteria Supplier Segmentation using a Fuzzy Preference Relations Based AHP 4.1 Introduction
vi
93 94
4.2 Proposed methodology 4.2.1 Preliminaries 4.2.2 Preference relations-based fuzzy AHP
99 100 102
4.3 Case study
104
4.4 Conclusion
115
4.5 References 5
Supply Chain Partnership: A Functional Perspective
117 123
5.1 Introduction
123
5.2 Theoretical background
125
5.3 Methodology 5.3.1 Population, Sample and Data Collection 5.3.2 Analysis 5.3.2.1 Confirmatory factor analysis (CFA) 5.3.2.2 Regression Analysis 5.3.2.3 None-response bias analysis
130 130 131 131 139 141
5.4 Managerial implications, conclusions, and future research
143
5.5 References
145
6 SMEs and Supply Chain Partnership: Antecedents and Consequences
151
6.1 Introduction
151
6.2 Conceptual framework and construct development 6.2.1 Entrepreneurial orientation 6.2.2 Firm’s drivers to engage in partnership 6.2.3 Functional partnership 6.2.4 Firm’s functional performance
153 154 155 156 158
6.3 Methodology 6.3.1 Population, Sample and Data Collection 6.3.2 Analysis
159 159 160
6.4 Managerial implications, conclusions, and future research 6.4.1 Managerial implications 6.4.2 Conclusions 6.4.3 Future research
166 166 167 168
Appendix A
169
Appendix B
170
Appendix C
173
Appendix D
177
6.5 References
179 vii
7
Conclusion
185
7.1 Main findings and scientific implications 7.1.1 Measuring entrepreneurial orientation 7.1.2 Supplier segmentation 7.1.3 SMEs partnering in SCM
185 185 188 190
7.2 Managerial implications
192
7.3 Limitations and Future research
194
7.4 Concluding remarks
197
7.5 References
197
Appendix 1 Questionnaire
200
Summary
212
Samenvatting
214
About the author
217
viii
List of Figures Figure 1.1 A typical supply chain of a firm 7 Figure 1.2 A general framework for inter-organizational relationships 14 Figure 1.3 An overview of the chapters of this thesis 16 Figure 2.1 Dimensions and items of entrepreneurial firm 29 Figure 2.2 The proposed two-level fuzzy inference system 37 Figure 2.3 Intended fuzzy inference systems 39 Figure 2.4 Rules output for two firms 45 and 59 46 Figure 3.1 Supplier segmentation based on supplier potential 68 Figure 3.2 Different supplier segmentation based on three dimensions 73 Figure 3.3 Supplier development based on supplier potential 76 Figure 3.4 The conceptual framework for supplier-related activities for a buyer 78 Figure 3.5 Supply chain of the broiler company 79 Figure 3.6 Supplier segments (purchasing) 81 Figure 3.7 Suppliers segments (marketing & sales) 82 Figure 4.1 Fuzzy linguistic assessment variables 103 Figure 4.2 Defuzzified weight of capabilities criteria 110 Figure 4.3 Defuzzified weight of willingness criteria 111 Figure 4.4 Segments of the suppliers 113 Figure 5.1 Two conceptual models to operationalize SC partnership 129 Figure 5.2 Response trend projections for the coefficients of five regression analyses 142 Figure 6.1 A typical supply chain of a firm 152 Figure 6.2 A conceptual framework of SMEs functional partnership and its antecedents and consequences 154 Figure 6.3 A conceptual model for functional partnership 158 Figure 6.4 Path model 164
ix
List of Tables Table 1.1 Advantages, and challenges of SMEs 4 Table 2.1 Fuzzy rule base for innovativeness (level 2) 40 Table 2.2 The results obtained by the methodologies 42 Table 2.3 The ranking results of the methodologies 43 Table 2.4 The correlation between the results of the four methodologies 44 Table 2.5 The detail data of two selected cases for comparison purpose (firms 45 and 59) 45 Table 2.6 Classification of the firms based on the final degree of their entrepreneurship 48 Table 2.7 Characteristics of the methodologies 50 Table 3.1 The approaches and methods to supplier segmentation 62 Table 3.2 Variables of suppliers’ capabilities for possible supplier segmentation 69 Table 3.3 Variables of suppliers’ willingness for possible supplier segmentation 71 Table 4.1 A list of capabilities criteria 96 Table 4.2 A list of willingness criteria 98 Table 4.3 Fuzzy linguistic assessment variables 103 Table 4.4 Selected capabilities and willingness criteria 105 Table 4.5 Capabilities and willingness measures of the suppliers 106 Table 4.6 Fuzzy pairwise comparison of capabilities criteria 108 Table 4.7 Fuzzy pairwise comparison of willingness criteria 108 Table 4.8 Fuzzy linguistic preference relation decision matrix of capabilities criteria 108 Table 4.9 Fuzzy linguistic preference relation decision matrix of willingness criteria 109 Table 4.10 Transforming results of the six capabilities criteria matrix from Table 4.8 109 Table 4.11 Transforming results of the six willingness criteria matrix from Table 4.9 109 Table 4.12 Capabilities and willingness criteria weights 110 Table 4.13 Aggregated scores for suppliers' capabilities and willingness 111 Table 4.14 Segments of the suppliers 112 Table 5.1 Some definitions of supply chain partnership 126 Table 5.2 Some characteristics of the sample, and the respondents 131 x
Table 5.3 Standardized estimations of the two models organizational, and functional 134 Table 5.4 Fit indices of the models organizational, and functional 136 Table 5.5 Mean, standard deviation (s.d.) and correlation of the constructs of the functional model 137 Table 5.6 The results of regression analysis: standardized coefficients and their corresponding t-values 140 Table 5.7 The cumulative values for regression coefficients using the projected respondent method 142 Table 6.1 Some characteristics of the sample, and the respondents 160 Table 6.2 Fit indices of the path model 164 Table 6.3 Standardized estimations of the CFA of the firm EO 169 Table 6.4 Fit indices of the EO CFA model 169 Table 6.5 Mean standard deviation (s.d.) and correlation of the constructs of the EO model 170 Table 6.6 Standardized estimations of the CFA of the firm drivers to engage in partnership 170 Table 6.7 Fit indices of the drivers CFA model 172 Table 6.8 Mean standard deviation (s.d.) and correlation of the constructs of the Drivers model 172 Table 6.9 Standardized estimations of the functional partnership CFA model 173 Table 6.10 Fit indices of the functional partnership model 175 Table 6.11 Mean standard deviation (s.d.) and correlation of the constructs of the functional partnership model 176 Table 6.12 Standardized estimations of the functional performance CFA model 177 Table 6.13 Fit indices of the functional performance model 179 Table 6.14 Mean standard deviation (s.d.) and correlation of the constructs of the functional performance model 179
xi
1 Introduction “Entrepreneurs strive to use resources, rather than own them” (Cooper, 2002) Imagine a small firm in a high-tech industry with only a dozen employees as its major assets. Its primary concern would be to survive in today’s highly competitive market and then grow. Small firms, however, do not benefit from what their large counterparts take advantage of: “economies of scale, experience, brand name recognition, and market power” (Chen and Hambrick 1995). Building around limited resources and the knowledge and capabilities of a few people may motivate these small businesses to outsource some of their activities and to form partnerships (Cooper 2002) with other supply chain actors as a way to compensate for their lack of resources and realize sustainable competitive advantage. Forming partnership is not easy, however. A firm may face several important questions when deciding to make partnership. Perhaps the first and most important question would be: what is a partnership? How is it different from a contractual relationship? For which functions/activities, engaging in a partnership is more crucial to the market success of a firm? What is the impact of these partnerships on a firm's functional and overall performance? There are some more important questions in this regard that a firm should answer before engaging in and implementing partnership. Although partnerships are beneficial (Halldórsson and Skjøtt-Larsen 2004; Tai, Ho et al. 2009), there are also disadvantages, such as an increased dependence on suppliers, communication costs and the risk of losing confidential information (Kelle and Akbulut 2005). As such, it becomes very important for firms to invest on relationships that are beneficial to the firm and that meet its expectations. The question is then how managers can distinguish beneficial partnerships in advance? And, assuming the firm was able to identify potentially beneficial relationships, can all these partnerships be managed in a same way? It would be also very interesting to see how a firm's level of entrepreneurship affects its engagement in supply chain partnerships. Because entrepreneurial firms are more innovative, prone to take risks and proactive, it is interesting to see how these characteristics affect their decision to engage in different kinds of partnerships with different supply chain actors. The main purpose of this thesis is to propose some systematic models, bridging SME, entrepreneurship and supply chain management (SCM), to find some answers to these questions, and thus help small businesses enter into more effective and efficient partnerships. We begin by providing an
overview of the building blocks used as a basis for this research. In other words, we first elaborate on small-to-medium-sized enterprises (SMEs), to determine the boundary of this research, and clarify the advantages and challenges of SMEs may lead them towards supply chain partnership. Next, the main concepts of SCM are presented. Supply chain partnerships are investigated as a potential solution to the obstacles SMEs face. However, as mentioned above, not every partnership is beneficial. As such, we elaborate on the effect of partnerships on firm performance to identify the beneficial partnerships in a systematic way. After that, the research methodology including the main problem, the objectives and the research questions are discussed. Different data sets and methodologies used in the rest of this thesis, along with an overview of the remaining chapters, are also briefly addressed.
1.1
Small-to-Medium-Sized Enterprises
Small-to-medium-sized enterprises (SMEs) play an essential role in the economy. They are a major source of employment, entrepreneurial skills and innovation. In the enlarged European Union of 25 countries, some 23 million SMEs provide around 75 million jobs and represent 99% of all enterprises (European Commission, 2003). In the US, more than 5,500,000 SMEs create 2 out of 3 new jobs (US Small Business Administration 2000), are responsible for almost half the Gross National Product and employ over half of the workforce (US Census Bureau 2000). In Japan, 69% of the workforce is employed by SMEs (Barnes, 2008). In China and Singapore, SMEs number around 90% of all businesses, and in Hong Kong they account for 98% of all registered businesses (ACCA 2006). In Australia 74% of the Australian workforce is employed by SMEs (ABS). In the UK, they represent for 56% of employment and 52% of the national turnover. In Iran, SMEs number around 92% of all businesses and account for 63% of employment (MN 2007). There are different definitions for SMEs in different economies, mostly based on the number of employees. As this research was conducted in the Netherlands, we use the definition of SME provided by European Commission (European Commission, 2003): “The category of micro, small and medium-sized enterprises (SMEs) is made up of enterprises which employ fewer than 250 persons and which have an annual turnover not exceeding 50 million euro, and/or an annual balance sheet1 total not exceeding 43 million euro.” 1
2
Assets = Liabilities + Shareholders' Equity
Based on Wynarczyk et al. (1993), there are three central aspects, apart from size, in which small firms are different from large firms: 1) Uncertainties associated with being a price-taker, having a limited customer and product base, and having greater diversified objectives of the owners; 2) Innovation, small firms work in innovations that are more related to ‘niches’, they invest less in R&D than large firms, even though the likelihood of introducing fundamentally new products and services in small firms is higher compared to large firms; and 3) Evolution, the likelihood of change and evolution in small firms is much higher compared to large firms. However, the authors mentioned that a small firm that becomes larger undergoes multi-stage changes rather than a singlestage change and, as a result, its management styles and organizational structure changes fundamentally (Storey, 1994). These changes are similar to the evolution of a caterpillar becoming a butterfly (Penrose, 1959) and, consequently, we cannot easily generalize the findings related to large firms to small firms. Nooteboom (1994) determines many characteristics of SMEs, including intertwined ownership and management, integration of tasks in worker, variation and improvisation, few hierarchical levels, short communication lines, few and simple procedures, personal, direct, oral internal communication, personal and close relations with customers, craftsmanship, tacitness of knowledge, and idiosyncratic perception, few products and markets, small volume of production, no staff functionaries, lack of managerial time, much authority and many functions in one hand, low level of abstraction product- or technique orientation, and possible lack of finance. These characteristics can affect different parts of this research. For example, many new firms can be expected to experience difficulties in obtaining financial resources from the formal capital markets, for example because the available governance mechanisms are often insufficient to protect the financial interests of these institutions because quantifying the risks involved is very difficult. These firms are able to establish themselves successfully by using less formal business contacts, through access to a network of embedded business relationships (Wynarczyk and Watson, 2005). SMEs use upstream vertical alliances to access critical resources, to obtain the legitimacy they need and to learn about current benchmarks as well as future opportunities (Arend, 2006). SMEs have some advantages because of their characteristics, the core characteristics of these businesses are small scale, personality and independence (Nooteboom, 1994). Many obstacles and weaknesses in SMEs are also emphasized in existing literature. We summarize these advantages and disadvantages (Nooteboom, 1994; Rothwell, 1994, 1989; 3
Cooper, 1964; Vossen, 1998; Buijs, 1987; Freel, 2000; Filson and Lewis, 2000; Cobbenhagen, 1999; Pissarides, 1999; Scozzi and Garavelli, 2005) in Table 1.1. Table 1.1 Advantages and challenges of SMEs Advantages Strong relationships with customers Rapid response to technical and market shifts Dynamic and entrepreneurial management style High average capability of technical people Less expensive innovations High ability to explore new technical spaces More efficient and effective innovations Motivated management/commitment Motivated labor No bureaucracy Internal flexibility Little filtering of proposals Low costs and little distortion of internal communication Capacity for customization Unique or scarce competencies Originality of initiative Dynamic and entrepreneurial managers Willingness to accept risk Efficient and informal internal communication networks Fast response to internal problem solving
Challenges and Problems Lack of financial resources Lack of skilled workers Weakness in external information and linkages Difficulty in coping with government regulations Unable to exploit new products Limited organizational, managerial and marketing capabilities and ad hoc management Reluctance to change Tendency to ignore procedures Focus on short-term requirements Lack of strategic vision Diffusion of a blame culture Unopposed misapprehensions Limited capacity for absorption of new knowledge /technology Technical myopia Little spread of risk Limited synergy Diseconomies of small scale Lack of functional and technical specialists Vulnerability to discontinuity of management and staff Lack of means for growth Unable to support a formal R&D effort on an appreciable scale Lack the time or resources to identify and use important external sources of scientific and technological expertise Inability to spread risk over a portfolio of projects Inability to offer integrated product lines or systems Unable to afford time or costs involved in patent litigation. Lack of structured organizational memory
As becomes clear from Table 1.1, SMEs are struggling with several shortages, most notably a lack of resources or a lack of means to grow. These shortages force SMEs to engage in partnerships with other actors of supply chains. Lambert (2008), and Lambert et al. (1996) identified a list of potential drivers for firms to engage in supply chain partnerships in four 4
main categories: asset/cost efficiency, customer service, marketing advantage, and profit stability/growth. Forrest and Martin (1990) identified technology development, technology commercialization and financial benefits as the most important drivers in the biotechnology industry. Table 1.1 shows that many advantages and challenges may motivate SMEs to engage in partnerships. In this thesis, we focus mainly on SMEs operating in high-tech industries. We will also evaluate the entrepreneurial degree of SMEs to see the effect of their level of entrepreneurship on their engaging in partnerships and their performance. Because there is little agreement among entrepreneurship researchers on how to define entrepreneurial firms, they have conceptualized entrepreneurial firms in multiple ways, ranging from a high-growth firm, to an owner-managed business, to a founder-run business (Daily et al., 2002). Entrepreneurial firms have often been defined based on their size, growth rate and origin (Tansky and Heneman, 2006). Miller (1983, p.771) argued that "an entrepreneurial firm is one that engages in product-market innovation, undertakes somewhat risky ventures, and is first to come up with 'proactive' innovations, beating competitors to the punch." In other words, entrepreneurial firms engage in entrepreneurial orientation (EO). A firm’s entrepreneurial orientation (EO) has been defined to consist of the processes, practices and decisionmaking styles that lead to entrepreneurial behavior in the organization (Lumpkin and Dess, 1996). EO has been conceptualized by Covin and Slevin (1986) as having three dimensions: 1. Innovativeness, 2. Proactiveness, and 3. Risk-taking. Innovativeness: The essence of entrepreneurship is creation (Schumpeter, 1934; Drucker, 1985; Sweeney, 1987; Porter, 1985; Hornaday, 1992) and innovation (Lumpkin and Dess, 1996; Shane and Venkataraman, 2000). “Innovativeness reflects a firm's tendency to engage in and support new ideas, novelty, experimentation, and creative processes that may result in new products, services, or technological processes” (Lumpkin and Dess, 1996). Proactiveness: Proactiveness is reflected in anticipating and acting on future needs of firms by "seeking new opportunities which may or may not be related to the present line of operations, introduction of new products and brands ahead of competition, strategically eliminating operations which are in the mature or declining stages of the life cycle" (Lumpkin and Dess, 1996; Venkataraman, 1989). Risk-taking: Risk-taking is reflected in “the degree to which managers are willing to make large and risky resource commitments i.e., those which have a reasonable chance of costly failures” (Miller and Friesen, 1978). 5
Several studies have investigated the relationship between EO and other firm features. For example (Lumpkin and Dess 1996; Wiklund and Shepherd 2003; Wiklund and Shepherd 2005; Rauch, Wiklund et al. 2009) have studied the relationship between EO and firm performance, and found a positive effect of EO on firm performance. Rauch et al. (Rauch, Wiklund et al. 2009), conducting a meta-analysis, found that the correlation between EO and performance is moderately large. In this research we are interested to measure EO using different methodologies, and to study the relationship between EO and a firm's to engage in supply chain partnerships, and in turn its effect on firm performance.
1.2
Supply Chain Management
As mentioned before, SMEs face many resource-related restrictions. One way to overcome them is to engage in partnerships and in fact use the resources of others to create a sustainable competitive advantage. Interorganizational relationships help firms create value by combining resources, sharing knowledge, increasing speed to market, and gaining access to foreign markets (Doz and Hamel, 1998). These inter-firm cooperative relationships can help firms, especially SMEs, which face with many obstacles and weaknesses, such as a lack of financial resources, inadequate management and marketing, a lack of skilled workers, weakness in external information and linkages, and difficulty in coping with government regulations, which limit their competitiveness (Buijs, 1987; Freel, 2000; Rothwell, 1994). The inter-organizational relationships are placed between the two extremes of pure market and vertical integration. Within this spectrum, supply chain management (SCM) is an intermediate type of relationship (Harland, 1996). The term ‘supply chain management’ originated in the early 1980s, when Oliver and Webber (1982) first coined the term to refer to the integration of different business functions. However, it was not until the 1990s and 2000s that SCM received real attention. There are many definitions of SCM (e.g. Ellram and Cooper, 1990; Cooper and Ellram, 1993; Mentzer et al., 2001; Min and Zhou, 2002; Mouritsen et al., 2003; Burgess et al., 2006; Lambert, 2008). One of the most comprehensive definitions sees supply chain management as “the systemic, strategic coordination of the traditional business functions and the tactics across these business functions within a particular company and across businesses within the supply chain, for the purposes of improving the long-term performance of the individual companies and the supply chain as a whole” (Mentzer et al., 2001). Successful supply chain management requires the involvement of these 6
corporate functions (Lambert, 2008). These functions are marketing and sales, logistic, purchasing, production, finance and R&D (Mentzer, 2004; Lambert, 2008). Figure 1.1 shows a typical supply chain as a network of materials, products, service and information flows. Focal firm
Suppliers
Purchasing
Production Marketing & Sales
Customers
Research & Logistics Finance Development
Figure 1.1 A typical supply chain of a firm
Over the last four decades, the role of supply chain management has changed considerably within organizations. In the 1970s, supply chain management, which was primarily known as distribution, was focused on the optimization and integration of warehousing and transportation within firms, the goal being to reduce inventories and distribution costs. In the 1980s, the focus was on the re-engineering of supply chain cost structures in order to reduce supply chain operating costs and supply chain assets. In the 1990s, the focus shifted from reducing costs to improving customer service. Product development and growth also became objectives of the supply chain organization. In the 2000s, the focus was on the evolution of strategic supply chain management, which meant that supply chain management was viewed as a driver and enabler of the business strategy of the firm and no longer solely as the forming part of a firm’s operational strategy (Evans and Danks, 1998). Partnership is a central concept in supply chain management (SCM), and is in fact the driving force of effective SCM (Horvath 2001). Apart from the centrality of the concept in SCM studies, there are a few works on the concept itself and its operationalization (Anderson and Narus 1990; Spekman et al., 1998). Maloni and Benton (1997) define supply chain partnership as “a relationship formed between two independent entities in supply channels to achieve specific objectives and benefits”. While existing literature focuses mainly on an organizational perspective on partnership, the functional perspective has received relatively less attention. It is necessary to include all of the traditional business functions in the process and implementation of partnerships (Mentzer et al., 2001). When it comes to the functional perspective, we see that most partnerships involved logistics and purchasing (see for example: Caniëls et al., 2010; 7
Caniëls and Gelderman 2007; Carr and Pearson 1999; Ellram, 1995; Gao et al., 2005; Heide and John 1990; Miller and Kelle 1998; Noordewier, John and Nevin 1990; Stump and Sriram 1997), which can be attributed to the dominant role of these functions in buyer-supplier relationships; a few studies are devoted to other functional areas, such as research and development (R&D), marketing and sales, production, and finance (Rezaei and Ortt 2012). Notwithstanding this, it has been shown that other business functions also play an important role in partnerships. For example, according to Ruekert and Walker (1987), marketing plays a coordinating role in connecting all the other functional departments to the outside environment. A study by Hagedoorn (2002) showed a general growth pattern for R&D partnership, especially in high-tech industries, during the last four decades. So, in this research, partnerships are investigated from a functional perspective to better understand the effect of engaging in partnership on firm performance, which means we not only look at the relationship between two organizations as two entities, but rather at their relationship in different functional areas, such as R&D, marketing, etc. Some researchers have reported that engaging in the supply chain benefits SMEs, while others identified some disadvantages. For example, Koh et el. (2007), based on a survey conducted in Turkey, reported that SCM practices increase the operational performance of SMEs, which in turn leads to an improved organizational performance related to SCM, while Arend and Wisner (2005), based on a survey among senior managers (mostly from the US and with experience in SCM and/or SMEs), concluded that SCM practices do not improve the performance of SMEs. We believe that engaging in SCM may have different effects on functional performance in different contexts. Therefore, it would seem that adopting a functional perspective on partnerships may resolve many problems and questions practitioners and scientists have regarding the relationship between supply chain partnership and SME performance.
1.3
Research Methodology
1.3.1 Problem definition SMEs play a central role in the world economy. They are a major source of entrepreneurial skills, innovation and employment (European Commission, 2003) and play a key role in the evolution of markets (Almeida and Kogut, 1997). Despite their critical role, most of them 8
cannot survive for long terms, especially because of their financial obstacles (Rothwell, 1989). Inter-organizational relationships (IORs) help firms create value by combining resources, sharing knowledge, increasing speed to market, and gaining access to foreign markets (Doz and Hamel, 1998). There are many different forms of IORs, such as joint ventures, networks, alliances, trade associations, interlocking directorates (Barringer and Harrison, 2000), partnership franchises, license agreements, contractual relationships, service agreements, administrated relationships (Golicic et al., 2003), innovation networks, and R&D consortia (Trott, 2008). Supply chain management (SCM) is an intermediate type of relationship in a spectrum ranging from vertical integration to pure market or arm’s length (consisting of either one-time exchanges or multiple transactions) (Harland, 1996; Contractor and Lorange, 1988; Lambert, 2008). Most relationships between organizations are at arm’s length, whereby a supplier offers standard product/service to many customers and when the exchanges end the relationship ends, while partnerships refer to a closer and more integrated relationship, providing significant benefits to both firms (Lambert, 2008). For many reasons, such as its emphasis on time and quality-based competition, supply chain management has been a dominant strategy for many firms in the past recent decades (Cooper et al., 1997). However the main focus in existing literature is on studying different aspects of SCM in large firms (Thakkar et al., 2008). Recently, some researchers have studied some challenges, advantages and disadvantages of SCM in SMEs (e.g. Tan et al., 2006; Rosanna and Andrea, 2006) but, despite the importance of high-tech SMEs, few studies examine issues involving SCM in these enterprises. Many SMEs, choose to make SCM part of their strategy implementation (Arend and Wisner, 2005), although the implementation of SCM in SMEs is different from that in large enterprises (LEs) and while some SMEs successfully engaged in SCM, others could not benefit from that (Thakkar et al., 2008, Arend and Wisner, 2005). In fact, as pointed out by Penrose (1959), a small firm is not a miniaturized version of a large firm, like a caterpillar is not a miniaturized version of a butterfly. Consequently, based on the differences between the quality and ways of implementation of SCM in LEs and SMEs, we cannot generalize the findings of existing studies to this kind of firms. Therefore, the view of these firms towards SCM, the potential benefits and obstacles of engaging in SCM, and the quality of the implementation of SCM are not yet clear. This research project aims to investigate these scientific gaps. 9
1.3.2 Objectives The main purpose of this research is to identify the challenges SMEs introducing and developing their products are faced with in SCM in order to find more effective and efficient SCM strategies. The objectives of this research are: To find out the drivers of SMEs to engage in partnership; To find out the SCM strategies of SMEs in engaging in partnership with the other actors; To find out the effects of the SCM strategies of SMEs on their performance in order to identify more successful SCM strategies for SMEs. High-tech entrepreneurial SMEs have a combinational set of characteristics of SMEs, high-tech, and entrepreneurial firms such as small scale, research intensive, innovativeness, proactiveness, and risk taking, some of which may encourage them to engage in SCM, while others may limit the extent to which they benefit from SCM. For instance, one of the most important elements of an inter-organizational relationship is its degree of dependence (Jap and Anderson, 2007), while one of the characteristics of SMEs (generally) (Nooteboom, 1994) and especially high-tech entrepreneurial SMEs (Lumpkin and Dess, 1996) is independence or autonomy. Therefore, as the first objective of this research, we are interested in finding out why these firms choose SCM as a strategy to leverage their limited resources. As the second important objective, we want to know how these firms, with several conflict characteristics, enter into partnerships with other actors in supply chains. There are many studies on the SMEs challenges, weakness and strengths of SMEs and how and why they make innovative products and services and therefore are able to survive in competitive environments. In this research, our aim is not to find these issues, but instead we want to know how these firms overcome their obstacles and reinforce their advantages to engage in supply chain partnerships and gain a competitive advantage. Once we can find different SCM strategies, the third objective of this research is determining the effects of these strategies on firm performance, which will allow us to distinguish successful strategies - which will finally result in competitive advantages - from unsuccessful ones. Reaching the objectives discussed above will give us some managerial tools to make SMEs more aware of potential advantages and disadvantages of engaging in SCM and apply more successful SCM strategies, and decide which partner is more suitable for which function, when and where. 10
1.3.3 Research questions This research aims to answer the following main question. Why and how do high-tech, entrepreneurial small-to-mediumsized enterprises create their relationships in supply chains, and what is the effect of this on their performance? This question looks at three main issues of these firms in SCM: 1. Motivations/drivers of SMEs to engage in partnership; 2. Establishing relationship with partners in SCM context; 3. Effect of SCM strategies on SME performance Which lead to the following sub-questions. Why do SMEs engage in partnership with other supply chain partners? How do SMEs engage in partnership with other supply chain partners? What is the relationship between SCM strategies of SMEs and their performance? Below, we discuss these research questions in more detail: Why do SMEs engage in partnerships with other supply chain partners? Firms may have a variety of reasons (drivers) for engaging in partnership with other firms. Drivers should be examined before engaging in partnership (Lambert 2008). They must exist to set the supply chain goals (Min and Zhou 2002), and must be strong enough for a firm to strengthen the relationship with other supply chain partners (Lambert et al. 1996). It has been found that, while cost reduction, having a reliable source of supply and reduced lead time are key drivers for buyers to engage in partnerships, revenue/profit enhancement, strategic market position and customer satisfaction are key drivers for suppliers (Spekman et al., 1998). How do SMEs engage in partnership with other supply chain partners? The answer to this question determines the different strategies SMEs use to engage in supply chains. We want to determine these strategies in terms of two dimensions: o The characteristics of the relationships, such as the degree of joint decision-making, information sharing, commitment, trust, etc. o Business functions that the relationships are based on, such as marketing and sales, logistics and purchasing, research and development, etc. 11
What is the relationship between SCM strategies of SMEs and their performance? As mentioned before, in this study, we begin by determining different SCM strategies of SMEs. This question relates to the relationship between these strategies and firm performance. Because these strategies link the firm with other firms to perform different functions, we investigate the effects of these strategies not only on the overall performance of the firm, but also on its different functional performances.
1.3.4 Scientific and managerial significance The aim of this study is to contribute to the theoretical body of knowledge on SCM in small-to-medium-sized enterprises, especially high-tech entrepreneurial ones. SMEs, making up the largest part of today’s economies, may benefit from outcomes of this research. SMEs are the most important part of almost all economies. For instance, in the European Union, SMEs represent 99% of all enterprises (European Commission, 2003). We can see that the majority of enterprises in different economies are SMEs. Therefore, although studying SCM with regard to SMEs seems to have a significant value, most studies have so far focused on large enterprises (Thakkar et al., 2008). On the other hand, SMEs implement SCM in a different compared to LEs (Arend and Wisner, 2005), which means we cannot easily apply existing findings on SMEs. Recently, some researchers have focused on specific aspects of SCM, such as the integration, planning and implementation in SMEs (e.g. Stefansson et al., 2002; Macpherson and Wilson, 2003; Lajara and Lillo, 2004; Arend and Wisner, 2005; Morrissey and Pittaway, 2004, 2006; Wagner et al., 2003). They attempted to investigate issues like the strengths and weaknesses of SMEs entering the SCM, the relationship between supplier and buyer in SCM, fitness of SCM for SMEs, and the effect of engaging in SCM on firm performance. However, there is a common characteristic in most of these studies, which is that they consider concepts such as “entering the SCM”, “engaging in SCM” and or “doing the SCM” as a single construct rather than a concept that can be decomposed to completely different forms. Here, we argue the main reasons why the engagement of SMEs in SCM should be considered as a set of constructs as follows. Some researchers (e.g. Arend, 2006; Arend and Wisner, 2005) have investigated the relationship between the engagement of SMEs in SCM and their performance. We believe that considering SCM as a single concept cannot lead to useful results in this field. Each SCM is constructed 12
from a large number of inter-organizational relationships between different partners, for different purposes and to carry out different business functions, which that assessing the fitness of SMEs and SCM is not easy and meaningful. Instead it seems more logical and beneficial if we investigate the effects of different relationships with different partners for different business functions. Firms have different relationships with different partners. While some of these partners may have a positive impact on a firm’s performance, others may have a negative effect, or a firm can do well in some SCM functions and less well in others. Different SMEs have different organizational structures, objectives and resources and operate in a specific industry structure. Therefore, engaging in SCM depends on the firm characteristics and on the drivers for engaging in a partnership. Also, it seems that engaging in SCM does not have the same impact on all kinds of SMEs. According to some special characteristics of entrepreneurial firms, such as risk taking and innovativeness, they are expected to behave differently in engaging in SCM. So, we believe that establishing a relationship between the two concepts of SCM and SME as two single entities, while both of them have several subsets, cannot lead to efficient and effective practical results. Instead, we intend to determine the relationship between their subsets under different circumstances. As such, in this research, instead of an organizational perspective on partnership, we propose and examine a functional perspective on partnerships. In other words, we investigate how SMEs make different partnerships with different supply chain partners in different functional areas. The functional perspective allows topmanagement to assess which functions depend most on, or are relatively best in, collaboration with supply chain partners. Furthermore, the effect of the degree of partnership on firm performance in different functional areas can be assessed by indicating where the collaborative efforts pay off and where they do not.
1.4
An overall view of the other chapters
To examine the research questions and realize the objectives of this project, a set of studies have been conducted. We begin with a general framework, which is a guideline for developing any inter-organizational relationship (see Figure 1.2).
13
Partner Selection
Partner Segmentation
Partner Relationship Management
Figure 1.2 A general framework for inter-organizational relationships
Generally speaking, there are three consecutive steps in any interorganizational relationship: (1) Partner selection; (2) Partner segmentation; and (3) Partner relationship management. In these steps, the term partner refers to customers, suppliers, third party logistics or any other possible partners in inter-organizational relationships. In the first step, a firm selects a sub-set of partners from a bigger set, to optimize the potential benefits from the relationships. Many studies focus on this strategic decision (e.g. Dickson, 1966; Weber et al., 1991; Swift, 1995; Choi and Hartley, 1996; Hitt et al., 2000; Kannan and Tan, 2002; Smeltzer, 1997; Huang and Keskar, 2007; Handfield et al., 2002; Humphreys et al. 2003; Chan, 2003; Ho et al.; 2010, Ravindran et al., 2009; Rezaei and Davoodi, 2008, 2011, 2012). Given a specific set of partners (e.g. suppliers), supplier relationship management provides a basis for firms to develop and maintain relationships with these suppliers (Lambert, 2008). Especially when firms have many suppliers, it is difficult to manage every relationship individually, which is why, in supplier relationship management, firms develop business-to-business strategies for different groups of suppliers (Wagner and Johnson, 2004). Supplier segmentation, as a step between these two strategic activities (supplier selection and supplier relationship management), yields distinct groups of suppliers based on their similarities. Finally, what is very important is how to manage the relationship with different partners. In this thesis, we focused on the last two steps. However, because we want to see what effect entrepreneurial orientation (EO) has on an SME's engagement in SCM activities, we begin by discussing some methodologies to measure the level of entrepreneurship of a firm (Chapter 2: Measuring entrepreneurship: expert-based vs. data-based methodologies). In other words, we apply statistical and expert-based methodologies to measure EO and show how different methodologies can be applied in different circumstances. Next, a new conceptual framework for supplier segmentation is proposed in Chapter 3 (A Multi-Variable Approach to Supplier Segmentation). As a basis for this new approach, we developed three requirements to create an overarching approach to supplier segmentation. Firstly, supplier segmentation should be based on long-term potential, which we propose to assess in terms of a supplier's capabilities and willingness to cooperate. Secondly, other functional areas, 14
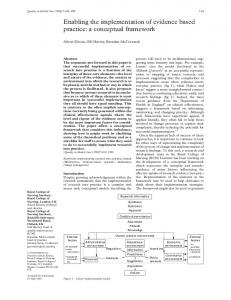
beyond purchasing, have to be considered when segmenting suppliers. Thirdly, supplier segmentation should be viewed as a step in a longitudinal process that includes selecting and segmenting suppliers, managing the relationship with them and actively developing their role over time. In Chapter 4 (Multi-criteria supplier segmentation using a fuzzy preference relations based AHP), a multi-criteria decision-making approach is applied to the supplier segmentation problem. A methodology is proposed that includes a fuzzy Analytic Hierarchy Process (AHP), which uses fuzzy preference relations to incorporate the ambiguities and uncertainties that usually exist in human judgment. The proposed methodology is used to segment the suppliers of a broiler company. Chapters 3 and 4 together cover the second step (i.e. supplier segmentation). Then we go to the third step (partner relationship management). In Chapter 5 (Supply chain partnership: A functional perspective), we look at the supply chain partnership from two perspectives: organizational and functional. The organizational perspective assumes that partnerships are formed by organizations as a whole, while the functional perspective claims that partnerships are formed by business functions, such as marketing or R&D, within organizations. To evaluate these two perspectives, we conducted a survey among high-tech SMEs. We used confirmatory factor analysis (CFA) to evaluate the fitness of a functional and organizational model. The results of CFA show a better fitness of the functional model, meaning that collaboration between organizations is reflected in functional rather than organization-wide aspects. We then studied the relationship between the functional model and the overall performance of the firm. The results indicate a significant relationship between partnerships in research and development (R&D) and the overall performance of the firm. We believe these results provide a new opportunity for both scientists and practitioners to increase their understanding of partnerships within supply chain management. In Chapter 6 (SMEs and supply chain partnership: Antecedents and consequences), based on the previous data, a comprehensive set of constructs and their relationships are examined as a whole model for partnership of SMEs with their supply chain partners considering several antecedents and consequences. We used CFA, and structural equation modeling (SEM) to see the relationships between different levels of the model. Several interesting results are discussed in Chapter 6. Chapter 7, finally provides the conclusions and some suggestions for future research (see Figure 1.3).
15
Partner Segmentation
Partner Relationship Management
CHAPTER 3 (Conceptual) CHAPTER 4 (MCDM, N=43) Supplier Segmentation
CHAPTER 6 (Statistical, N=279) Overall Model (SMEs Partnership: Antecedents, and consequences)
Supplier Segmentation in research and development
Supplier Segmentation in purchasing and logistics
Supplier Segmentation in production
Supplier Segmentation in finance
Firm
CHAPTER 2 (MCDM and Statistical, N=59)
Entrepreneurial Orientation (EO)
Drivers to engage in SC partnership
CHAPTER 5 (Statistical, N= 279) SC Partnership
Firm Performance
Partnership in marketing and sales
Performance in marketing and sales
Partnership in research and development
Performance in research and development
Partnership in purchasing and logistics
Performance in purchasing and logistics
Partnership in production
Performance in production
Partnership in finance
Performance in finance
CHAPTER 7 Conclusion
CHAPTER 1 Introduction
Supplier Segmentation in marketing and sales
Figure 1.3 An overview of the chapters of this thesis
As can be seen in Figure 1.3, in this thesis, two different types of methodologies are applied: (1) Multi-criteria decision-making (MCDM) methodologies; and (2) Statistical methodologies on three different data sets (43 suppliers of an SME in the food industry, 59 Dutch high-tech SMEs, and 279 Dutch high-tech SMEs). In the next chapters, we discuss how different methodologies suit different situations. Generally speaking, when the main goal is to make a decision for a particular purpose, and when there is a limited amount of data, MCDM methodologies are more suitable. It is clear that, here, the goal in not to generalize the results to the other members of the corresponding population. However, when the main goal is to discover a phenomenon or to find out the relationship between different phenomena, and when usually more data is available, statistical methodologies are more suitable. In that case, the researcher wants to generalize and apply the results to the other members of the corresponding population.
1.5 References Almeida, P., and Kogut, B., (1997). The exploration of technological diversity and geographic localization in innovation: Start-up firms in the semiconductor industry, Small Business Economics 9(1), 21-31. American Small Businesses (1988). The Agony and the Ecstasy, The Economist (March), 69-70. 16
Anderson, J.C., and Narus, J.A., (1990). A Model of Distributor Firm and Manufacturer Firm Working Partnerships. The Journal of Marketing 54(1), 42-58. Arend, R.J., (2006). SME-supplier alliance activity in manufacturing: contingent benefits and perceptions, Strategic Management Journal 27, 741-763. Arend, R.J., and Wisner, J.D., (2005). Small business and supply chain management: is there a fit? Journal of Business Venturing 20, 403436. Audretsch, D.B., (2002). The dynamic role of small firms: evidence from the US, Small Business Economics 18(1-3), 13-40. Barnes, L., (2008). A Review of Corporate Governance with an SME Perspective, Newcastle School of Business and Management, Newcastle University, 2008. Barringer, B.R., and Harrison, J.S., (2000). Walking a Tightrope: Creating Value Through Interorganizational Relationships, Journal of Management 26(3), 367-403 Buijs, J.A. (1987). Innovation can be taught, Research Policy 16, 303-314. Burgess, K., Singh, P.J., and Koroglu, R., (2006). Supply chain management: a structured literature review and implications for future research. International Journal of Operations & Production Management 26(7), 703–729. Caniëls, M., Gelderman, C.J., and Ulijn, J.M., (2010). Buyer-Supplier Relationship Development: An Empirical Study Among Dutch Purchasing Professionals. Journal of Enterprising Culture (JEC) 18(2), 107-137. Caniëls, M.C.J., and Gelderman, C.J., (2007). Power and interdependence in buyer supplier relationships: A purchasing portfolio approach. Industrial Marketing Management 36(2), 219-229. Carr, A.S., and Pearson, J.N., (1999). Strategically managed buyer– supplier relationships and performance outcomes. Journal of Operations Management 17(5), 497-519. Chan, F.T.S., (2003). Interactive selection model for supplier selection process: an analytical hierarchy process approach. International Journal of Production Research 41(15), 3549-3579. Chen, M.J., and Hambrick D.C., (1995). Speed, Stealth, and Selective Attack: How Small Firms Differ from Large Firms in Competitive Behavior. The Academy of Management Journal 38(2), 453-482. Choi, T.Y. and Hartley, J.L., (1996). An exploration of supplier selection practices across the supply chain. Journal of Operations Management 14(4), 333-343. 17
Cobbenhagen, J., (1999). Successful innovation towards a new theory for the management of small and medium-sized enterprises, Edward Elgar, Cheltenham. Contractor, F., and Lorange, P., (1988). Why should firms cooperate? The strategy and economics basis for cooperative ventures. In F. Contractor and P. Lorange (eds.), Cooperative Strategies in International Business. Lexington Books, Lexington, MA, pp. 3-30. Cooper, A.C., (1964). R&D is more efficient in small companies?, Harvard Business Review 42(3), 75-83. Cooper, A.C., (2002). Networks, alliances, and entrepreneurship. Strategic Entrepreneurship: Creating a New Mindset, M.A. Hitt, R.D. Ireland, S.M. Camp and D.L. Sexton. Malden, MA, Blackwell Publishing Ltd. Cooper, M.C., and Ellram, L.M., (1993). Characteristics of Supply Chain Management and the Implications for Purchasing and Logistics Strategy. International Journal of Logistics Management, The 4(2), 13-24. Cooper, M.C., Lambert, D.M. and Pagh, J.D., (1997). Supply chain management more than a new name for Logistics. The International Journal of Logistics Management 8(1), 1-14. Covin, J.G., and Slevin, D.P., (1986). The development and testing of an organizational level entrepreneurship scale. In R. Ronstadt, J.A. Hornaday, R. Peterson, and K.H. Vesper (Eds.), Frontiers of entrepreneurship research, pp.628–639,Wellesley,MA:Babson College. Daily, C.M., McDougall, P.P., Covin, J.G., and Dalton, D.R., (2002). Governance and Strategic Leadership in Entrepreneurial Firms, Journal of Management 28, 387-412. D'Aveni, R.A., (1994). Hypercompetition: Managing the dynamics of strategic maneuvering. New York: Free Press. Dickson, G.W., (1966). An analysis of vendor selection systems and decisions. Journal of Purchasing 2(1), 5-17. Doz, Y., and Hamel, G., (1998). Alliance Advantage: the Art of Creating Value through Partnership, Harvard Business School Press, Cambridge, MA. Drucker, P.F. (1985). Innovation and entrepreneurship: Practice and Principles. New York: Harper & Row. Ellram, L.M., (1995). A Managerial Guideline for the Development and Implementation of Purchasing Partnerships. Journal of Supply Chain Management 31(2), 9-16. Ellram, L.M., Cooper, M.C., (1990). Supply Chain Management, Partnership, and the Shipper-Third Party Relationship. International Journal of Logistics Management, The 1(2), 1-10. 18
European Commission, (2003). Commission Recommendation of 6 May 2003 concerning the definition of micro, small and medium-sized enterprises (notified under document number C(2003) 1422) , Official Journal of the European Union L 124, p. 36 of 20 May 2003. Evans, R., Danks, A., (1998). Strategic supply chain management: creating shareholder value by aligning supply chain strategy with business strategy. In: Gattorna, J. (Ed.), Strategic Supply Chain Alignment. Gower, Aldershot, pp. 18–37. Filson, A., and Lewis, A., (2000). Cultural issues in implementing changes to new product development process in a small to medium sized enterprises (SME). Journal of Engineering Design 11(2), 149-157. Forrest, J.E., and Martin, M.J., (1990). Strategic alliances: Lessons from the new biotechnology industry. Engineering Management Journal 2, 13-20. Freel, M.S., (2000). Barriers to product innovation in small manufacturing firms. International Small Business Journal 18(2), 60-80. Gao, T., Sirgy, M.J., and Bird, M.M. (2005). Reducing buyer decisionmaking uncertainty in organizational purchasing: can supplier trust, commitment, and dependence help? Journal of Business Research 58(4), 397-405. Golicic, S.L., Foggin, J.H., and Mentzer, J.T., (2003). Relationship magnitude and its role in interorganizational relationship structure. Journal of Business Logistics 24 (1), 57-75. Hagedoorn, J., (2002). Inter-firm R&D partnerships: an overview of major trends and patterns since 1960. Research Policy 31(4), 477-492. Halldórsson, Á., and Skjøtt-Larsen, T., (2004). Developing logistics competencies through third party logistics relationships. International Journal of Operations & Production Management 24(2), 192-206. Handfield, R.B., Walton, S.V., Sroufe, R. and Melnyk, S.A., (2002). Applying environmental criteria to supplier assessment: A study in the application of the Analytical Hierarchy Process. European Journal of Operational Research 141(1), 70-87. Harland, C.M., (1996). Supply Chain Management: Relationships, Chains and Networks. British Journal of Management 7, S63-S80. Heide, J.B., and John, G. (1990). Alliances in Industrial Purchasing: The Determinants of Joint Action in Buyer-Supplier Relationships. Journal of Marketing Research 27(1), 24-36. Hines, A., (2004). Supply chains strategies; customer driven and customer-focused. Oxford: Butterworth-Heinemann. Hitt, M.A., Dacin, M.T., Levitas, E., Arregle, J.-L., and Borza, A., (2000). Partner Selection in Emerging and Developed Market Contexts: 19
Resource-Based and Organizational Learning Perspectives. The Academy of Management Journal 43(3), 449-467. Ho, W., Xu, X., and Dey, P.K., (2010). Multi-criteria decision making approaches for supplier evaluation and selection: A literature review. European Journal of Operational Research 202(1), 16-24. Hong, P., and Jeong, J., (2006). Supply chain management practices of SMEs: from a business growth perspective, Journal of Enterprise Information Management 19 (3), 292-302. Hornaday, R.W., (1992). Thinking about entrepreneurship: a fuzzy set approach. Journal of Small Business Management 30(4), 12-23. Horvath, L., (2001). Collaboration: the key to value creation in supply chain management. Supply Chain Management: An International Journal 6(5), 205 - 207. Huang, S.H., and Keskar, H., (2007). Comprehensive and configurable metrics for supplier selection. International Journal of Production Economics 105(2), 510-523. Humphreys, P.K., Wong, Y.K. and Chan, F.T.S., (2003). Integrating environmental criteria into the supplier selection process. Journal of Materials Processing Technology 138(1-3), 349-356. Jap S.D., and Anderson, E., (2007). Testing a life-cycle theory of cooperative interorganizational relationships: Movement across stages and performance. Management Science 53(2), 260-275. Kannan, V.R., and Tan, K.C.,( 2002). Supplier selection and assessment: their impact on business performance. The Journal of Supply Chain Management 38(4), 11-21. Kelle, P., and Akbulut, A., (2005). The role of ERP tools in supply chain information sharing, cooperation, and cost optimization. International Journal of Production Economics 93–94(0), 41-52. Koh, S.C.L., Demirbag, M., Bayraktar, E., Tatoglu, E., and Zaim, S., (2007). The impact of supply chain management practices on performance of SMEs. Industrial Management & Data Systems 107(1),103-124. Lajara, B.M. and Lillo, F.G., (2004). SMEs and supplier alliance use: an empirical analysis. Supply Chain Management: An International Journal 9(1), 71-85. Lambert, D.M., (editor), (2008). Supply chain management: Process, partnership, performance, 3th edition, Supply chain management institute, Sarasota, Florida. Lambert, D.M., Emmelhainz, M.A., and Gardner, J.T., (1996). Developing and Implementing Supply Chain Partnerships. International Journal of Logistics Management, The 7, 1-18. 20
Lambert, D.M., Emmelhainze, M.A., and Gardner, J.T., (1999). Building successful logistic partnership. Journal of Business Logistics 20(1), 165-181. Lumpkin, G.T., and Dess, G.G., (1996). Clarifying the entrepreneurial orientation construct and linking it to performance. Academy of Management Review 21(1), 135-172. Macpherson, A. and Wilson, A., (2003). Supply chain management: improving competitive advantage in SMEs. In: Jones, O. and Tilley, F., Editors, 2003. Competitive Advantage in SMEs: Organizing for Innovation and Change, Wiley, Chichester. Maloni, M.J., and Benton, W.C., (1997). Supplychain partnerships: Opportunities for operations research. European Journal of Operational Research 101, 419-429. Mentzer, J.T., (2004). Fundamentals of supply chain management: Twelve drivers of competitive advantage. Sage Publications, Inc., USA. Mentzer, J.T., DeWitt, W., Keebler, J.S., Min, S., Nix, N.W., Smith, C.D., and Zacharia, Z.G., (2001). Defining supply chain management. Journal of business logistics 22(2), 1-25. Miller, D., (1983). The correlates of entrepreneurship in three types of firms. Management Science 29, 770-791. Miller, D., and Friesen, P.H., (1982). Innovation in conservative and entrepreneurial firms: Two models of strategic momentum. Strategic Management Journal 3(1), 1-25. Miller, P.A., and Kelle, P., (1998). Quantitative Support for BuyerSupplier Negotiation in Just-In-Time Purchasing. Journal of Supply Chain Management 34(2), 25-30. Min, H., and Zhou, G., (2002). Supply chain modeling: past, present and future. Computers and Industrial Engineering 43(1–2), 231-249. Morrissey, B., and Pittaway, L., (2004). A study of procurement behaviour in small firms. Journal of Small Business and Enterprise Development 11(2), 254-262. Morrissey, W.J., and Pittaway, L., (2006). Buyer-supplier relationships in small firms: the use of social factors to manage relationships. International Small Business Journal 24(3), 272-298. Mouritsen, J., Skjøtt-Larsen, T., Kotzab, H., (2003). Exploring the contours of supply chain management. Integrated Manufacturing Systems 14(8), 686-695. Noordewier, T.G., John, G., and Nevin, J.R., (1990). Performance Outcomes of Purchasing Arrangements in Industrial Buyer-Vendor Relationships. The Journal of Marketing, 54(4): 80-93. 21
Nooteboom, B., (1994). Innovation and diffusion in small firms: theory and evidence. Small Business Economics 6(5), 327-347. Oliver, R.K., and Webber, M.D., (1992). Supply-Chain Management: Logistics Catches Up with Strategy. Outlook (1982); In: Christopher, M. G.: Logistics, The Strategic Issue. Chapman and Hall, London. Penrose, E.T., (1959). The Theory of the Growth of the Firm. Oxford, Basil Blackwell. Pissarides, F., (1999). Is lack of funds the main obstacle to growth? ebrd's experience with small- and medium-sized businesses in central and eastern Europe. Journal of Business Venturing 14(5-6), 519-539. Porter, M.E., (1985). Competitive advantage. New York: Free Press. Rauch, A., Wiklund, J., Lumpkin, G.T., and Frese, M., (2009). Entrepreneurial Orientation and Business Performance: An Assessment of Past Research and Suggestions for the Future. Entrepreneurship Theory and Practice 33(3) 761-787. Ravindran, A.R., Ufuk Bilsel, R., Wadhwa, V., and Yang, T., (2009). Risk adjusted multicriteria supplier selection models with applications. International Journal of Production Research 48(2), 405-424. Rezaei, J., and Davoodi, M., (2006). Genetic Algorithm for Inventory LotSizing with Supplier Selection under Fuzzy Demand and Costs, In: M. Ali and R. Dapoigny (Eds.), Advances in Applied Artificial Intelligence, Vol. 4031, pp. 1100-1110, Springer Berlin/Heidelberg. Rezaei, J., and Davoodi, M., (2008). A deterministic, multi-item inventory model with supplier selection and imperfect quality. Applied Mathematical Modeling 32(10), 2106–2116. Rezaei, J., and Davoodi, M., (2011). Multi-objective models for lot-sizing with supplier selection. International Journal of Production Economics 130(1), 77-86. Rezaei, J., and Davoodi, M., (2012). A joint pricing, lot-sizing, and supplier selection model. International Journal of Production research 50(16), 4524-4542. Rezaei, J., and Ortt, R., (2012). A multi-variable approach to supplier segmentation. International Journal of Production Research 50(16), 4593-4611. Rosanna, F., and Andrea, Z., (2006). Collaboration mechanisms in SME context: a case study in the footwear sector. International Journal of Networking and Virtual Organizations 3(2), 172-84. Rothwell, R., (1989). Small firms, innovation and industrial change. Small Business Economics 1, 51-64
22
Rothwell, R., (1994). Industrial innovation: success, strategy, trends, in Dodgson, M. and Rothwell, R. (Eds), The Handbook of Industrial Innovation, Edward Elgar, Cheltenham. Ruekert, R.W., and Walker, O.C., Jr. (1987). Marketing's Interaction with Other Functional Units: A Conceptual Framework and Empirical Evidence. The Journal of Marketing 51(1), 1-19. Schumpeter, J. (1934). The Theory of Economic Development. Cambridge: Cambridge University Press. Scozzi, B., and Garavelli, C., (2005). Methods for modeling and supporting innovation processes in SMEs. European Journal of Innovation considered Management 8(1), 120-137. Shane, S., Venkatraman, S., (2000). The promise of entrepreneurship as a field of research. Academy of Management Review 25, 217-226. Smeltzer, L.R., (1997). The meaning and origin of trust in buyer-supplier relationships. International Journal of Purchasing and Materials Management 33(1), 40-48. Spekman, R. E., J. W. K. Jr, et al. (1998). "An empirical investigation into supply chain management: a perspective on partnerships." Supply Chain Management: An International Journal 3(2): 53 - 67. Spekman, R.E., Jr, J.W.K., and Myhr, N., (1998). An empirical investigation into supply chain management: a perspective on partnerships. Supply Chain Management: An International Journal 3(2), 53-67. Stefansson, G., (2002). Business-to-business data sharing: a source for integration of supply chains. International Journal of Production Economics 75(1-2), 135-146. Storey, D.J., (2006). Understanding the small business sector, Thomson Learning. Stump, R.L., and Sriram, V., (1997). Employing information technology in purchasing: Buyer-supplier relationships and size of the supplier base. Industrial Marketing Management 26(2), 127-136. Sweeney, G.P., (1987). Innovation, entrepreneurs and regional development. New York: St. Martin’s Press. Swift, C.O., (1995). Preferences for single sourcing and supplier selection criteria. Journal of Business Research 32(2), 105–111. Tai, Y. M., Ho C.F., and Wu, W.H., (2009). The performance impact of implementing Web-based e-procurement systems, International Journal of Production Research 48(18), 5397-5414. Tan, E.N., Smith, G., and Saad, M., (2006). Managing the global supply chain: a SME perspective. Production Planning and Control 17(3), 238-46. 23
Tansky, J.W., and Heneman, R.L., (editors) (2006). Human Resource Strategies for the High Growth Entrepreneurial Firm - Google Books Result, Greenwich, CT: Information Age. Thakkar, J., Kanda, A., and Deshmukh, S.G., (2008). Supply chain management in SMEs: development of constructs and propositions. Asia Pacific Journal of Marketing and Logistics 20(1), 97-131. Trott, P., (2005). Innovation management and new product development, 3rd edition, Pearson Education Ltd, London. Venkataraman, N., (1989). Strategic orientation of business enterprises: The construct, dimensionality, and measurement. Management Science 35, 942–962. Vossen, R.W. (1998). Relative strengths and weaknesses of small firms in innovation. International Small Business Journal 16(3), 88-94. Wagner, B.A., Fillis, I., and Johansson, U., (2003). E-business and esupply strategy in small and medium sized business (SMEs). Supply Chain Management: An International Journal 8(4), 343-54. Wagner, S.M., and Johnson, J.L., (2004). Configuring and managing strategic supplier portfolios. Industrial Marketing Management 33(8), 717-730. Weber, C.A., Current, J.R., and Benton, W.C., (1991). Vendor selection criteria and methods. European Journal of Operational Research 50(1), 2-18. Wiklund, J., and Shepherd D., (2005). Entrepreneurial orientation and small business performance: a configurational approach. Journal of Business Venturing 20(1), 71-91. Wiklund, J., and Shepherd, D., (2003). Knowledge-based resources, entrepreneurial orientation, and the performance of small and medium-sized businesses. Strategic Management Journal 24(13), 1307-1314. Wynarczyk, P., and Watson, R., (2005). Firm growth and supply chain partnerships: An empirical analysis of U.K. SME subcontractors. Small Business Economics 24, 39–51. Wynarczyk, P., Watson, R., Storey, D., Short, H., and Keasey, K., (1993). Managerial labour markets in small and medium-sized enterprises. London: Routledge.
24
2 Measuring entrepreneurship: expertbased vs. data-based methodologies1 Abstract – The concept of entrepreneurial orientation (EO) has become essential in research into the degree of entrepreneurial behaviour at firm level. It is relevant to managers to be able to assess explicitly the level of entrepreneurship of a firm. Incubators, venture capitalists, corporate venturing units, angel investors, investment banks and governments need solid measures that go beyond expert intuition to assess the entrepreneurial nature of firms before they invest in them. Researchers have examined EO and consider innovativeness, risk taking, and proactiveness important dimensions of this concept. Although the concept is seen as a multidimensional construct, there has been a great deal of debate among scholars on how to analyse it. The traditional statistical methodology has a number of drawbacks. In this article, we extend the debate and assess the construct of EO using four different methodologies: the traditional statistical methodology, a fuzzy-logic methodology, a DEA-like methodology and a naïve methodology. As an expert-based methodology, fuzzy logic compensates some of the limitations of the statistical methodology. Drawing on a sample of 59 start-ups in a self-administered questionnaire, we measure innovativeness, risk taking and proactiveness and subsequently compare the resulting EO scores using the four methodologies. We found several differences, the most prominent of which are discussed in greater detail. The EO score from a naïve methodology yields a value that lies between the other results, while the entrepreneurial score from a fuzzy logic methodology is most different from the other results. Keywords: Entrepreneurship orientation (EO); Fuzzy logic; Data envelopment analysis (DEA); factor analysis
1
This chapter is based on: Rezaei, J., Ortt, R., and Scholten, V., (2012). Measuring entrepreneurship: Expertbased vs. data-based methodologies. Expert Systems with Applications 39(4), 40634074. An improved fuzzy AHP has been also used to formulate and solve this problem: Rezaei, J., Ortt, R., and Scholten, V., (2012). An improved fuzzy preference programming to evaluate entrepreneurship orientation, Applied Soft Computing, forthcoming.
25
2.1
Introduction
Entrepreneurship has become the engine of economic and social development throughout the world (Audretsch, 2002). Entrepreneurial firms that are able to sustain continuous innovation are more likely to survive in a dynamic environment (D'Aveni, 1994). To measure the degree of entrepreneurial behavior, researchers have introduced the concept of entrepreneurial orientation (EO). The concept of EO refers to the strategymaking processes that underlie a firm’s entrepreneurial decisions and actions (e.g. Lumpkin and Dess, 1996; Wiklund and Shepherd, 2003). Since its introduction (Covin and Slevin, 1989; Miller, 1983), the concept has received substantial conceptual and empirical attention and has contributed significantly to the area of entrepreneurship (Covin et al., 2006). A meta-analysis of the relationship between EO and performance among a sample of 53 research projects indicated that the correlation is moderately large and robust with respect to different operationalizations and cultural contexts (Rauch et al., 2009). Despite the large consensus among researchers about the value of the EO construct, several researchers argue that there are some problems with the EO construct, most of which have to do with the nature of the construct (Zahra, 1993), the redundancy in the items (Zahra, 1993), the debate on reflective or formative constructs (George, 2006; Stetz et al, 2000) and the effect of different types of environments (i.e., external factors) (Knight, 1997; Wiklund and Shepherd, 2005). Although previous studies have adopted traditional statistical analysis to assess the level of EO of a firm, one could wonder whether such a methodology can control for the problems identified, which is why this paper focuses on the effect of the analytical approach being used on the possibility of making interpretations at the level of EO in a given data set of small and new ICT firms. Usually, the analytical approach to construct development is based on three steps. Firstly, the meaning of entrepreneurial character has to be defined and different dimensions of the construct have to be identified. Secondly, the measurement of the construct has to be described, for example in terms of the items used to measure the dimensions. Thirdly, the algorithm used to assess the overall entrepreneurial character of a firm, using the scores on separate items, has to be selected. In this article, we focus on the third step, which means that we will use a particular conceptualization of entrepreneurship and we adopt a standard list of items to measure the construct. Our focus is on the algorithm used to assess the overall entrepreneurial character of a firm. We compare the results for four 26
different algorithms: the traditional statistical methodology, a fuzzy-logic methodology, a DEA-like methodology and a naïve methodology. In the next section, we review existing literature on how to define and measure entrepreneurship and we choose a particular definition and measurement methodology that will be used in the remainder of the article. In section 2.3, the methodologies used to assess the entrepreneurial character of a firm are introduced. Applications of the proposed methodologies in real-world situations and a comparison of the results are presented in sections 2.4 and 2.5 respectively. The discussion and conclusions are discussed in section 2.6.
2.2
Literature review
Different groups of authors have defined the entrepreneurial character of firms and distinguished the relevant dimensions. To develop a construct to measure the level of entrepreneurial behavior of a firm, there are three steps. Firstly, we examine the meaning of the entrepreneurial character and the different dimensions of the EO construct. Secondly, we describe the construct in terms of the items to measure the dimensions. And thirdly, we assess various algorithms that can be used to identify the overall EO of a firm. Based on the work by Miller and Friesen (1982), Covin and Slevin (1989) define the concept of EO as a strategic posture at firm level. Firms with a high level of EO are seen as having a higher competitive advantage that improves their performance. Firms that score high on EO are believed to be engaged in innovation frequently, to be more willing to take risks and to act more proactively when opportunities arise. Accordingly, Covin and Slevin (1989) distinguish three dimensions in the entrepreneurialconservation orientation of a firm: innovativeness, aggressiveness and risk taking. They call a firm entrepreneurial if its managers have innovative, aggressive and risk-taking management styles. Otherwise, the management styles and the firms are considered to be more conservative. To measure this orientation, Covin and Slevin (1989) provide a nine-item scale (three items for each dimension). The mean rating on items determines the entrepreneurial-conservative orientation of the firm. In this paper we adopt the model suggested by Miller (1983), and Covin and Slevin (1989). To gather the data, we use the instrument provided by Covin and Slevin (1989) with some modifications. We decided to adopt this model because it is used most frequently in the field of entrepreneurship and use it to compare four different algorithms to assess the overall degree of entrepreneurship of firms. 27
Despite its popularity (e.g. Rauch et al., 2009), several researchers have reported problems with the above-mentioned scale. These problems have to do with different aspects of the scale, such as the choice of dimensions (Zahra, 1993; Lumpkin and Dess, 1996), the choice of the items used to assess the dimensions (Brown et al., 2001), the self-report assessment (Brown et al., 2001) and the lack of contingency effects of the environment on the relationship between the EO construct and firm performance (Knight, 1997; Wiklund and Shepherd, 2005). In this article, we assess the extent to which the algorithm being used affects the calculation of the overall entrepreneurial behavior of a firm, focusing on two types of criticism, the first of which refers to redundancy in the items (Zahra, 1993). According to Zahra, several items of a particular dimension may be related to other dimensions. Zahra illustrates this with an example: “entrepreneurial posture is positively related to the ability of a firm to quickly bring new products to market”. Zahra indicates that this may refer to the dimension of innovativeness as well as to the dimension of proactiveness. The second criticism refers to the debate on reflective or formative constructs (George, 2006, Stetz et al, 2000). A reflective construct is a latent construct that is assessed in terms of observable items that are a consequence or reflection of that construct. A formative construct is a latent construct that is assessed by combining observable items that together create or cause that construct (Diamantopoulos and Winklhofer, 2001). Originally, Covin and Slevin (1986) described the EO construct as unidimensional, where each dimension of EO should co-vary. Later, scholars have reached a consensus and argued that the construct is theoretically a more multidimensional one (Lumpkin and Dess, 1996; Kreiser et al., 2002). The three dimensions are considered to co-vary, which means that a change in EO also results in a change in innovativeness, risk taking and proactiveness (George, 2006; Rauch and Frese, 2009). Although most researchers use a statistical methodology and assess the construct by means of factor analyses, two studies indicate that a formative approach may be more appropriate (George, 2006; Stetz et al., 2000). These two issues, the redundancy in the items and the debate on reflective or formative constructs, can be tackled by using different algorithms to assess the EO construct even when the same data are used on the same items. In the following section, we therefore discuss the role different algorithms used to analyze the EO construct can have on its interpretation in a data set. 28
2.3
Methodologies
As mentioned above, in the model under study there are three general dimensions for entrepreneurship, each of which can be measured using different items (see Figure 2.1).
Figure 2.1 Dimensions and items of entrepreneurial firm (adapted from Miller, 1983 and Covin and Slevin, 1989)
Different methodologies can be applied to assess the overall value for the construct. The goal of a typical methodology is to calculate the degree of the top box (entrepreneurship) using the underlying dimensions and items. The methodologies vary, for example, in terms of the weights being assigned to the different items and dimensions. In this section, we describe four different methodologies to calculate the level of entrepreneurship of the firm: a naïve, statistical, fuzzy logic and DEA-like methodology, which are all based on expert knowledge or data. The naïve methodology applies the same weights to all elements at each level, the statistical methodology extracts the weights from the data, the fuzzy logic methodology calculates the weights using experts knowledge and the DEA-like methodology makes the highest flexibility to determine the weights, allowing a firm to select its own weights to maximize its level of entrepreneurship compared to other firms. This means we have a set of methodologies that operate differently when assigning weights to the items and dimensions. There are similarities and differences, which we discuss in greater detail below.
2.3.1 Naïve Using this methodology we simply use an average of the item scores as the level of entrepreneurship of the firm. This methodology is straightforward and is used in most real-world cases.
29
2.3.2
Statistical
The latent constructs in the conceptual model were measured on multiitem scales, excepting the construct diversity. To use the data, the items must be reduced and combined into the latent constructs they are intended to measure. For this purpose, a factor analysis1 is used. First of all, it is important to determine whether a factor analysis is allowed, which we did by conducting two different tests: Bartlett’s test of Sphericity2, Kaiser-Meyer-Olkin measure of sampling adequacy3. A principal component analysis is more commonly used, which is why we use it in this research. The principal component analysis explains total variance as opposed to common factor analysis, which explains common variance and specific and error variance. What followed was the rotation of the initial solution, which was executed according to the Orthogonal Rotation method4. The advantage of rotation is that it makes proper interpretation possible. The rotated solution clearly shows a distinction between factors. The method we used for rotation is the varimax procedure5. What followed was the determination of factors underlying the data; which could be found in the output of SPSS. After the underlying factors have been determined, communalities should be examined to see whether the different items actually correlate with each other. If communality is very low (< 0.30), and the degree of correlation between an item and other items is relatively low (which means it is ´quite unique´) such an item should be removed, as it is definitely measuring ´something else´. Also, when the loading of an item was < 0.45, the item was automatically deleted, after which the investigation started over again until the proper items were selected. The last step was to determine the 1
A factor analysis is a class of procedures primarily used for data reduction and summarization. 2 The Bartlett’s test of Sphericity shows if the correlation matrix is different from the identity matrix (significantly) which is essential for the factor analysis. Test statistic should be high (p 0.70 is acceptable. In this research, a Cronbach α > 0.60 is acceptable, because the sample of this research was not big (N = 59 firms). It is important to realize that the statistical procedure proceeds in two steps. Firstly, dimensions are assessed by adding weighted scores of the items, in which the weights are derived using a factor analysis. Secondly, the scores for these dimensions are simply added. In a full structural equation model, the effect of the dimensions on the overall construct would also be derived statistically. However, data limitations do not allow us to use these types of models.
2.3.3 Fuzzy logic In most practical problems, precise data are not available (Rezaei and Dowlatshahi, 2010), for two possible reasons. In some cases, we are faced with inherent imprecision in what we try to measure, while in other cases, the lack of a robust measurement tool causes the imprecision. In most cases, we are faced with both kinds of imprecision. Fuzzy logic, which was first introduced by Zadeh (1965), is a precise logic of imprecision and approximate reasoning. Unlike classical logical systems, the purpose of fuzzy logic is to model and formalize the imprecise modes of reasoning based on two fundamental human abilities; the ability to make rational decisions in an environment of uncertainty and imperfect information, and the ability to do a wide variety of physical and mental tasks and make rational decisions without any computations (Zadeh, 1988, 1999, 2001, 2008). As Ragin (2000) pointed out, however, most scholars have not recognized the potential of fuzzy logic for transforming social science methodologies. Although fuzzy logic has great potential for dealing with ambiguous problems in the field of innovation and entrepreneurship as a social science, as yet we find few applications in existing studies. For instance Wu et al. (2010), in assessing the performance of the intellectual capital of Taiwanese universities, applied Fuzzy Analytic Hierarchy Process (FAHP) to determine the weights of the innovation capital indicators. Cheng et al. (2009) applied trend-weighted fuzzy time-series model to predict innovation diffusion of ICT products. Wang (2009) considered a hierarchy of four criteria, each of them containing some elements to measure the new product development performance using a 2tuple fuzzy linguistic computing approach. 1
Cronbach α represents the average of all possible split-half coefficients computed as the mean correlation over all possible split half reliabilities and with this the reliability of a factor.
31
In this paper, due to the ambiguities of entrepreneurial dimensions and items, we design and apply a rule-based system to measure the level of entrepreneurship of a firm. In practice, experts start by determining the model by indicating how item scores can be transformed to verbal labels and subsequently how the item scores can be combined into dimensions and an overall score. Item scores for separate firms can then be determined (in some cases this can also be done by experts, and in our case a questionnaire was used to gather this data). So, in fuzzy logic, the development of the model is separated from the evaluation of the firms. When experts indicate how item scores can be transformed to verbal labels, they indicate, for each separate item in the construct (in the case of EO these items are INN1-3, RIS1-3 and PRO1-2), at which numerical values the item is considered to be low, moderate or high. Because this approach is relatively subjective, a distribution of values with some overlap is assessed. If this assessment is completed for all items, experts discuss how low, moderate and high values for the items can be combined into low, moderate or high values for the dimensions and in turn, how dimensions can be combined into the overall construct. In the next section, we briefly describe a fuzzy inference system that is required to conduct the calculations. Fuzzy Inference System A Fuzzy inference system (FIS), or fuzzy-rule-based system, is basically composed of four functional blocks (Jang, 1993): 1. Fuzzification interface The fuzzification interface consists of the following functions (Lee, 1990): Measures the values of input variables, Performs a scale mapping that transfers the range of values of input variables into corresponding universes of discourse, Performs the function of fuzzification to convert input data into suitable linguistic values that may be viewed as labels of fuzzy sets 2. Knowledge base The knowledge base refers to the rule base (IF–THEN rules) and the database. The knowledge acquisition phase comprises expert knowledge of the application domain and the decision rules governing the relationships between input and output. 32
3. Decision-making unit The decision-making unit is in fact simulating human decision-making processes based on the rules of inference in fuzzy logic. The evaluation of a rule is based on computing the truth value of its premise and applying it to its conclusion. This results in assigning one fuzzy subset to each output variable of the rule. This component interacts with the knowledge base and performs mathematical computations based on the above-mentioned fuzzy numbers. 4. The defuzzification interface As the final operation of a fuzzy inference system, the fuzzy output produced by the system is converted to a crisp number. This is necessary because the decision-maker cannot decide based on a fuzzy output. In literature, there are different methods of defuzzification (see. for example, Yen and Langari, 1999).
2.3.4 Data Envelopment Analysis (DEA)-like Here, we introduce a new methodology to measuring the level of entrepreneurship of the firm. It is similar to the Data Envelopment Analysis (DEA) first introduced by Charnes et al. (1978). DEA is a useful tool to measure the relevant efficiency of a set of Decision Making Units (DMUs), which use input to generate output. Because the amount of input and output varies, they are supposed to be different in terms of their efficiency. This methodology is mostly used to measure the relative efficiency of banks (e.g. Sherman and Gold, 1985; Sherman and Ladino, 1995), hospitals (e.g. Banker et al., 1986) and other decision-making units (e.g. public schools by Ray, 1991; suppliers by Celebi, and Bayraktar, 2007). For more information on this subject, please see Charnes et al. (1994) and Cooper et al. (2007). Mimicking DEA methodology, we introduce a mathematical programming model to measure the relative level of entrepreneurship of firms. Suppose we have N firms (DMUs). The level of entrepreneurship of firm i (Ei) is considered as the sum product of its items measures d ij , j 1, ..., J J
by their weights wij , j 1, ..., J ( wij d ij ). We can measure the level of j 1
entrepreneurship of other firms in the same formulation. Now, if firm i (DMUi) is allowed to maximize its level of entrepreneurship providing the level of entrepreneurship of other firms do not exceed than 1, then the 33
calculated maximum level of entrepreneurship of this firm denotes its relative entrepreneurship. The mathematical programming model for firm i is as follow.
max ( Ei )
J
w d j 1
ij
ij
s.t.
(1)
J
w d j 1
ij
nj
1, n 1, ..., i, ..., N
wij 0, j 1, ..., J The programming models of other firms are formed similar. Solving N models, the relative level of entrepreneurship of all N firms is obtained. It has to be mentioned that this methodology allows total flexibility in the selection of weights such that each firm could maximize its own level of entrepreneurship. In DEA based on their relative efficiency score, DMUs are usually divided into two categories: efficient (those who have efficiency score equal to 1) and non-efficient (those who have efficiency score less than 1). Here, however, we rank them based on their relative level of entrepreneurship, which logically lies between 0 and 1. However, it is possible for more than one DMU to have a relative level of entrepreneurship of 1. Although these firms are more entrepreneurial than those with a lower level of entrepreneurship, we cannot compare them by themselves. For example if the relative level of entrepreneurship of firms l, m and p is 1, 1, and 0.8, it is clear that firms l and m are more entrepreneurial than firm p, but we cannot asses the level of entrepreneurship of firm l compared to m or vice versa. To deal with this issue, we modify model (1) as follows:
max ( Ei )
J
w d j 1
ij
ij
s.t. J
w d j 1 j i
ij
nj
1, n 1, ..., N
(2)
wij 0, j 1, ..., J , j i. This modification is similar to the model suggested by Andersen and Petersen (1993) for ranking efficient DMUs. Here, we in fact excluded the DMUs under study from the constraint set, allowing it to maximize its relevant level of entrepreneurship if it can. We therefore will have the 34
relevant level of entrepreneurship of more than 1 for most of the entrepreneurial firms, which is useful for ranking them.
2.4
Application
In this section, we first describe the data used to apply and compare the above-mentioned methodologies, after which we discuss the application procedures.
2.4.1 Description of the real-world case and data collection We collected data on EO from a sample of Dutch ICT firms. To be included in our sample, firms needed to meet three requirements. Firstly, they had to be operating in the Dutch ICT industry. Secondly, they must have been established between 2002 and 2004, to make we were dealing with start-up firms. And thirdly, they needed to be relatively small, with a maximum of 65 full-time employees. The reason we selected the ICT industry was that start-ups in this industry are facing a hostile environment, where rapid change is a way of life. There have been substantial changes in information technology in recent years. Computers and software have evolved a rapid, complex and almost chaotic way, with implications for competition and strategy. As such, the new competitive landscape requires a significantly different approach to strategy compared to the past (Bettis and Hitt, 1995). As a result, the ICT industry represents a dynamic sector that preserves the variation in the degree of entrepreneurial behavior among the entrepreneurs. In addition, by selecting a single industry, we were able to draw among the start-ups. Furthermore, it is important for a participant to have existed for at least three years, which means it has survived the start-up phase, which can be considered the most critical phase for small firms: once firms have survived for three years they can be said to have passed through the “valley of death” (Gibb and Davies, 1990, in Littunen, 2000). After the first three years, strategic choices become an import factor in determining where a firm will go in the future. Also, their business practices presumably approximate those of established firms rather than new ventures. Therefore, we selected firms that were founded between 2002 and 2004. According to the third condition, all these firms have a maximum of 65 full-time employees. As such, they can all be classified as small firms. Finally, all firms must have a management team consisting of two or more members, which is necessary for the data regarding the composition of the team. In this research, management team members of small firms are defined as managers are responsible for strategic 35
formulation and decision-making, policy-setting and championing the status quo of the firms. The REACH database and the Dutch Chambers of Commerce were used to locate the firms for our sample. The empirical information was obtained by Internet questionnaires. Questionnaires have the advantage of obtaining data more efficiently in terms of researcher time, energy and costs. Also, questionnaires are an efficient data collection mechanism in cases where researchers know exactly what is required and how to measure the relevant variables (Sekaran, 2003). Internet questionnaires have the same properties as mail questionnaires, with several important advantages. For example, the flexibility of data collection and the diversity of questions in Internet surveys are moderate to high compared to low for traditional mail questionnaires. Most importantly, however, the sample control is slightly better and the speed with which data can be gathered is much higher than it is in the case of mail questionnaires (Malhotra and Birks, 2000). The Internet questionnaire was designed using a questionnaire generator (www.thesistools.com). The questionnaire was divided into different sections, each relating to a particular variable (Dillman, 1978), thus minimizing negative effects related to this structural format. The variables used in this research have already been studied in previous studies and are based on the entrepreneurial orientation (EO) scale developed by Miller (1983), and Covin and Slevin (1986; 1988; 1989). The existing scales were translated into Dutch as accurately as possible, making it easier for the respondents to complete the questionnaire.
2.4.2 Naïve methodology Using this methodology, we simply calculate the mean of eight items with the equal weights (for items under each dimension) as follows: 1 INN1 INN 2 INN 3 RIS1 RIS 2 RIS 3 PRO1 PRO 2 N 3 3 3 2
2.4.3 Statistical methodology Using the procedure discussed in section 2.3.2, the following weights are obtained for different items as follows. Innovation items weight: WINN1: 0.816; WINN2: 0.863; WINN3: 0.704 Risk taking items weight: WRIS1: 0.775; WRIS2: 0.778; WRIS3: 0.775 Proactiveness items weight: WPRO1: 0.799; WPRO2: 0.892 36
The final average score of entrepreneurship of each firm is then calculated as follows: ENTavg = (INNavg + RISavg + PROavg)/3 where, INNavg = (INN1*WINN1) + (INN2*WINN2) + (INN3*WINN3) RISavg = (RIS1* WRIS1) + (RIS2* WRIS2) + (RIS3* WRIS3) PROavg = (PRO1* WPRO1) + (PRO2* WPRO2) In fact, this methodology is a hybrid methodology (statistical and naïve) in which a statistical methodology is used to combine item scores in dimensions, whereas the dimensions are simply combined into EO in a naïve way by adding their values.
2.4.4 Intended fuzzy inference system
ENT
Based on the model proposed in Figure 2.1, the designed methodology contains two levels. We first have to measure the three dimensions of innovativeness, risk-taking and proactiveness, based on their subcomponents (level 2), after which the measures are aggregated to obtain the overall degree of entrepreneurship of a firm (level 1). Consequently, we have to design four fuzzy inference systems, three to measure the dimensions and one to aggregate the dimensions measures. Figure 2.2 shows the proposed two-level fuzzy inference system.
Knowledge base FIS4
FUZZY
FUZZY
FIS2
INN3
Decision making unit
Defuzzification interface
Decision making unit
Defuzzification interface
FUZZY
FUZZY
FUZZY
FUZZY
Fuzzification interface
Fuzzification interface
PRO2
FUZZY
Fuzzification interface
FIS3
Knowledge base
RIS3
FUZZY
interface
RIS2
Defuzzification
RIS1
Decision making unit
INN2
PR O
Knowledge base
Knowledge base
INN1
Fuzzification interface
PRO1
INN
Defuzzification interface
RIS
FIS1
Decision making unit
Figure 2.2 The proposed two-level fuzzy inference system 37
2.4.4.1
Fuzzification interface
Figure 2.2 illustrates the intended FISs. In FIS1 (innovativeness), we define three linguistic input variables for each firm. They are ‘the number of new lines of products and services’ (INN1), ‘change intensity in product or service lines’ (INN2), and ‘managers’ emphasis on tried and true products and services vs. on R&D, technological leadership and innovation’ (INN3). In FIS2 (risk-taking), we define three linguistic input variables for each firm: ‘proclivity for risk taking in projects’ (RIS1), ‘owning to the nature of environment’ (RIS2), and ‘dealing with uncertainty’ (RIS3). In FIS3 (proactiveness), we define two linguistic input variables: ‘initiating actions vs. responding to competitors actions’ (PRO1), and ‘avoiding vs. adopting competitive posture’ (PRO2). The fuzzification of the output variables INN (degree of innovativeness), RIS (degree of risk-taking), PRO (degree of proactiveness), and ENT (degree of entrepreneurship) are presented. To develop these membership functions, we used the knowledge of three academic experts. To fuzzify the input and output variables, the following fuzzy subsets (linguistic values) are used: Low (L), Medium (M), and High (H). We also use triangular and trapezoidal membership functions. The various INN1, INN2, INN3, INN, RIS1, RIS2, RIS3, RIS, PRO1, PRO2, PRO, and ENT values, which are denoted by inn1 INN1 , inn 2 INN 2 , inn3 INN 3 , inn INN , ris1 RIS1 , ris 2 RIS 2 , ris3 RIS 3 , ris RIS , pro1 PRO1 , pro2 PRO 2 , pro PRO , and ent ENT respectively. These construct the base variable values within a context that is defined as x X . 2.4.4.2
Knowledge base
The membership functions of inputs and outputs (Figure 2.3) were designed by three academic experts based on their knowledge of the system and their experience. However, the main purpose of the knowledge base is to provide a fuzzy rule base needed for the fuzzy processor.
38
Figure 2.3a. FIS1
Figure 2.3b. FIS2
Figure 2.3c. FIS3
Figure 2.3d. FIS4
Figure 2.3 Intended fuzzy inference systems (FIS1, FIS2, FIS3 and FIS4)
2.4.4.3
Fuzzy rule base
The rule base of our study contains 90 rules ( 33 27 rules for innovativeness, 33 27 rules for risk-taking, 32 9 rules for proactiveness and 33 27 rules for entrepreneurship), which include all variations of the linguistic values. The rules were constructed on the basis of the knowledge of three academic experts, and have the following form: Level 2 (innovativeness) IF the number of new lines … AND change intensity in product … AND managers’ emphasis on tried … THEN innovativeness
is is is is
inn1 INN1 inn 2 INN 2 inn3 INN 3 inn INN
39
Level 2 (risk-taking) IF proclivity for risk taking in projects AND owning to the nature of environment AND dealing with uncertainty THEN risk-taking
is is
ris1 RIS1 ris 2 RIS 2
is is
ris3 RIS 3 ris RIS
Level 2 (proactiveness) IF initiating actions vs. responding AND avoiding vs. adopting competitive THEN proactiveness
is is is
pro1 PRO1 pro2 PRO 2 pro PRO
Level 1 (entrepreneurship) IF innovativeness AND risk-taking AND proactiveness THEN entrepreneurship
is is is is
inn INN ris RIS pro PRO ent ENT
Table 2.1 shows an example of the rule base for innovativeness (dimension 1, level 2). Table 2.1 Fuzzy rule base for innovativeness (level 2) INN1
INN2
INN3
Fuzzy rule base output INN
L . . . M M . . . H
L . . . M M . . . H
L . . . L M . . . H
L . . . M M . . . H
Fuzzy rule base input
Rule No 1 . . . 13 14 . . . 27
2.4.4.4
Decision making unit
In this paper, the inference engine developed by Mamdani and Assilian (1975) was used by employing a compositional minimum operator. In the case of minimum inferencing, the entire strength of the rule is seen as the minimum membership value of the input variables’ membership values. (3) output min input1 , input2 , , inputN
40
2.4.4.5
The defuzzification interface
In this paper, we apply the most commonly used Center of Gravity (COG) defuzzification, which calculates the centre of the area of the combined membership function as:
y0
( y ) y dy ( y ) dy F
i
F
i
i
i
(4)
i
where y i is the representative value of the fuzzy subset member i of the output, and F ( yi ) is the confidence in that member (membership value) and y 0 is the crisp value of the output.
2.4.5 DEA-like methodology Considering INN1, INN2, INN3, RIS1, RIS2, RIS3, PRO1 and PRO2 as eight inputs and ENT as the-indigenous-output, we apply model (1) for 59 firms to obtain their relevant level of entrepreneurship. Because the relevant level of entrepreneurship of 11 firms is 1, we used model (2). The results are shown in Table 2.2.
41
Table 2.2 The results obtained by the methodologies Firm # 1 2 3 4 5 6 7 8 9 10 11 12 13 14 15 16 17 18 19 20 21 22 23 24 25 26 27 28 29 30 31 32 33 34 35 36 37 38 39 40 41 42 43 44 45 46 47 48 49 50 51 52 53 54 55 56 57 58 59
42
Final entrepreneurial degree of firms using the four methodologies
Item measures INN1 5 4.5 4.5 5 5.5 6 4 5 5 5 6.5 5.5 5 4 5 5 4.5 5.5 5 5 3.5 4.5 5 3.5 4.5 6.5 6 3.5 5 2.5 6.5 4.33 3.67 2.67 6.33 5.5 5.67 4.5 5.67 4.33 4.5 5.67 6.5 4 6 4.5 4.67 5.67 3.33 4.33 4.67 3.33 4.67 3.67 3.33 4.5 5 4.8 6.33
INN2 5 5 3.5 4.5 5.5 6 3.5 4.5 4.5 5.5 5.5 5 5.5 3.5 4.5 4 3 5 6 4 4 5 4 2 5.5 4.5 4.5 4 3.5 3 4.5 4 2.67 3.33 5.33 5.5 4.67 5.5 5.33 4.67 5 4.67 6.5 3.5 5.5 6.5 6.33 4.67 2.67 4.67 5.67 2.67 3.33 4.33 2.33 4.75 5.5 4.2 5.67
INN3 4 5 5.5 5 6 5.5 4 4.5 5.5 5 6 5 5 4 5.5 5 4.5 5.5 5.5 4 3 4.5 5.5 4 5 6.5 7 4 5.5 2.5 7 3.67 4.33 3.67 5.67 5 5.33 5.5 5.33 4.33 4 5.67 6 3.5 6.5 5.5 5.67 6.67 4.33 3.67 5.33 2.67 5.33 3.33 3.67 3.25 5.25 5.2 6.33
RIS1 4 5.5 5.5 5 4.5 3.5 4.5 5 4.5 5 6 5.5 6 4.5 4 4 5 5.5 4.5 4.5 3.5 3.5 4.5 4.5 5.5 5.5 5.5 4.5 4.5 4 5.5 3.33 4.33 5.33 4.67 6 4.67 4.5 5.33 4.67 5 4.67 5.5 5 5.5 5.5 5.33 4.33 3.67 4.33 4.67 5.33 4.33 5.33 4.33 4.25 5.25 3.6 6.33
RIS2 4.5 5.5 3.5 4.5 5 4.5 4.5 4.5 5 5.5 6.5 5 5.5 4.5 3.5 4.5 5.5 4 5 5 4 4 3.5 4 6 4.5 5.5 4 4 3.5 5 3 4.67 4.67 5.67 6 5.67 5 4.67 4.33 4.5 4.67 5 4.5 4 4.5 4.67 4.67 4.33 4.33 3.67 3.33 3.67 3.67 4.67 4.5 4.75 4.2 5.33
RIS3 4.5 5.5 5 5 5 4 5 4 5.5 5.5 6 4.5 5 4.5 3.5 5 6 5.5 5 4.5 3 3.5 3.5 5.5 5.5 5.5 5.5 4.5 4.5 4.5 5.5 3.33 3.67 4.67 5.67 5.5 4.33 4.5 3.67 4.33 4.5 5.33 5.5 4 6.5 4 4.67 4.33 5.33 4.33 5.67 4.67 4.33 4.33 3.67 4.75 4.5 4.4 6
PRO1 5 4.5 3.5 6 4.5 4.5 5.5 5 5 4.5 5.5 6.5 4.5 4.5 5 3 4 6.5 6.5 5.5 2.5 5 4.5 6.5 4.5 7 6.5 4.5 4.5 4 6 3.67 5.33 3.67 5.67 5.5 4.67 5 4.67 5 5.5 4.67 6.5 4.5 7 4.5 5.67 4.33 4.67 3.67 3.67 3.33 4.67 4.33 5.33 3 5.25 4.2 5.67
PRO2 5.5 4 4 5.5 4.5 5 5 3.5 5.5 4.5 5.5 6.5 3.5 4 4.5 3.5 4.5 6.5 6 3.5 3 6 5 5.5 3.5 6 6 5 6.5 3.5 6 4.33 5.67 4.33 5.33 4.5 5.33 5 5.67 4.67 4.5 5.67 6 4 6.5 6 5.67 3.67 5.33 4.33 5.33 4.33 5.67 4.67 3.67 3.75 4.75 3.8 4.67
NAIVE 4.750 4.861 4.306 5.139 5.000 4.861 4.583 4.472 5.083 5.000 5.889 5.556 4.889 4.194 4.472 4.139 4.583 5.611 5.528 4.500 3.250 4.611 4.472 4.611 4.889 5.833 5.861 4.306 4.833 3.472 5.778 3.740 4.427 4.038 5.538 5.389 5.038 4.944 5.057 4.574 4.722 5.132 5.972 4.139 6.028 5.139 5.372 4.704 4.296 4.184 4.798 3.721 4.574 4.240 3.944 4.014 5.028 4.267 5.722
FUZZ 0.578 0.722 0.554 0.658 0.749 0.816 0.444 0.613 0.648 0.724 0.873 0.739 0.736 0.390 0.640 0.427 0.483 0.740 0.746 0.570 0.352 0.616 0.591 0.441 0.738 0.825 0.789 0.399 0.588 0.364 0.825 0.413 0.432 0.366 0.827 0.774 0.725 0.741 0.754 0.518 0.598 0.725 0.842 0.386 0.819 0.751 0.766 0.636 0.421 0.439 0.476 0.359 0.561 0.354 0.435 0.435 0.736 0.511 0.874
STAT 3.850 3.895 3.441 4.143 4.014 3.927 3.694 3.587 4.092 4.019 4.731 4.494 3.914 3.369 3.598 3.311 3.672 4.533 4.467 3.609 2.620 3.746 3.601 3.712 3.912 4.689 4.703 3.477 3.905 2.797 4.639 3.028 3.573 3.245 4.456 4.327 4.058 3.982 4.085 3.688 3.809 4.135 4.819 3.330 4.857 4.159 4.336 3.755 3.460 3.380 3.873 3.003 3.687 3.428 3.160 3.238 4.047 3.421 4.584
DEA 0.8843 0.9109 0.8689 0.9033 0.9496 0.9231 0.8526 0.8336 0.9200 0.9402 1.1138 1.0426 0.9706 0.7633 0.8378 0.8082 0.9726 1.0000 0.9945 0.8750 0.6780 0.9259 0.8130 0.9294 0.9661 1.0390 1.0556 0.8000 1.0000 0.7123 1.0385 0.6928 0.8932 0.8613 0.9738 0.9853 0.9265 0.9076 0.9380 0.8096 0.8718 0.9240 1.1157 0.8050 1.1286 1.0000 0.9738 0.9735 0.8680 0.7685 0.9450 0.8613 0.8723 0.8779 0.8333 0.8077 0.9000 0.7902 1.0550
Table 2.3 The ranking results of the methodologies Rank 1 2 3 4 5 6 7 8 9 10 11 12 13 14 15 16 17 18 19 20 21 22 23 24 25 26 27 28 29 30 31 32 33 34 35 36 37 38 39 40 41 42 43 44 45 46 47 48 49 50 51 52 53 54 55 56 57 58 59
Firm # 45 43 11 27 26 31 59 18 12 35 19 36 47 46 4 42 9 39 37 57 5 10 38 13 25 2 6 29 51 1 41 48 22 24 7 17 53 40 20 8 15 23 33 3 28 49 58 54 14 50 16 44 34 56 55 32 52 30 21
NAIVE 6.028 5.972 5.889 5.861 5.833 5.778 5.722 5.611 5.556 5.538 5.528 5.389 5.372 5.139 5.139 5.132 5.083 5.057 5.038 5.028 5.000 5.000 4.944 4.889 4.889 4.861 4.861 4.833 4.798 4.750 4.722 4.704 4.611 4.611 4.583 4.583 4.574 4.574 4.500 4.472 4.472 4.472 4.427 4.306 4.306 4.296 4.267 4.240 4.194 4.184 4.139 4.139 4.038 4.014 3.944 3.740 3.721 3.472 3.250
Firm # 59 11 43 35 31 26 45 6 27 36 47 39 46 5 19 38 18 12 25 13 57 37 42 10 2 4 9 15 48 22 8 41 23 29 1 20 53 3 40 58 17 51 7 24 50 55 56 33 16 49 32 28 14 44 34 30 52 54 21
FUZZ 0.874 0.873 0.842 0.827 0.825 0.825 0.819 0.816 0.789 0.774 0.766 0.754 0.751 0.749 0.746 0.741 0.740 0.739 0.738 0.736 0.736 0.725 0.725 0.724 0.722 0.658 0.648 0.640 0.636 0.616 0.613 0.598 0.591 0.588 0.578 0.570 0.561 0.554 0.518 0.511 0.483 0.476 0.444 0.441 0.439 0.435 0.435 0.432 0.427 0.421 0.413 0.399 0.390 0.386 0.366 0.364 0.359 0.354 0.352
Firm # 45 43 11 27 26 31 59 18 12 19 35 47 36 46 4 42 9 39 37 57 10 5 38 6 13 25 29 2 51 1 41 48 22 24 7 40 53 17 20 23 15 8 33 28 49 3 54 58 50 14 44 16 34 56 55 32 52 30 21
STAT 4.857 4.819 4.731 4.703 4.689 4.639 4.584 4.533 4.494 4.467 4.456 4.336 4.327 4.159 4.143 4.135 4.092 4.085 4.058 4.047 4.019 4.014 3.982 3.927 3.914 3.912 3.905 3.895 3.873 3.850 3.809 3.755 3.746 3.712 3.694 3.688 3.687 3.672 3.609 3.601 3.598 3.587 3.573 3.477 3.460 3.441 3.428 3.421 3.380 3.369 3.330 3.311 3.245 3.238 3.160 3.028 3.003 2.797 2.620
Firm # 45 43 11 27 59 12 26 31 18 29 46 19 36 35 47 48 17 13 25 5 51 10 39 24 37 22 42 6 9 2 38 4 57 33 1 54 20 53 41 3 49 34 52 7 15 8 55 23 40 16 56 44 28 58 50 14 30 32 21
DEA 1.1286 1.1157 1.1138 1.0556 1.0550 1.0426 1.0390 1.0385 1.0000 1.0000 1.0000 0.9945 0.9853 0.9738 0.9738 0.9735 0.9726 0.9706 0.9661 0.9496 0.9450 0.9402 0.9380 0.9294 0.9265 0.9259 0.9240 0.9231 0.9200 0.9109 0.9076 0.9033 0.9000 0.8932 0.8843 0.8779 0.8750 0.8723 0.8718 0.8689 0.8680 0.8613 0.8613 0.8526 0.8378 0.8336 0.8333 0.8130 0.8096 0.8082 0.8077 0.8050 0.8000 0.7902 0.7685 0.7633 0.7123 0.6928 0.6780
43
2.5 Comparison In this section, we compare the results of the afore-mentioned methodologies and discuss the similarities and differences. Based on their advantages and disadvantages, we can assess the situations where a particular methodology is most appropriate. As a first step in comparing the four methodologies, we look at the correlations between their final scores (see Table 2.4). Table 2.4 The correlation between the results of the four methodologies 1 2 3 1. Naive methodology 2. Fuzzy logic methodology 0.898** 3. Statistical methodology 1.000** 0.896** 4. DEA methodology 0.912** 0.797** 0.910**
Average 0.936 0.863 0.935 0.873
N= 59; **p < 0.01; * p < 0.1
As it can be seen, there are significant correlations between all four methodologies. While naïve and statistical methodologies show the highest degree of correlation (1.00), DEA-like and fuzzy logic methodologies have the lowest correlation compare to the other methodologies (0.797). There are some important differences between the methodologies with regard to how they rank the firms (section 2.5.1), the classification (section 2.5.2), the vulnerability of the results (section 2.5.3) and the data-set limitations (section 2.5.4).
2.5.1 Ranking the firms As mentioned before, naïve and statistical methodologies obtain the final score in the same way: both use a weighted-sum of item scores. However, while a statistical methodology applies the loadings as the weights, a naïve methodology applies equal weights to all items. Statistical and DEA-like methodologies are also relatively similar. Because of the similarities, we focus on the comparison between FIS, statistical and DEA-like methodologies. FIS vs. statistical As it can be seen from Table 2.3, there are some differences in the ranking of firms, for instance if we compare firms 45 and 59. When using fuzzy logic, firm 59 comes in first place and firm 45 in seventh. By contrast, a statistical methodology places firm 59 in seventh place and puts 44
firm 45 first. Here, we discuss some of the reasons with regard to this difference. As mentioned before, the statistical methodology applies a linear function to obtain the final average score of a firm, which implies that, using statistical methodology, a linear trade-off between the item or dimension measures is assumed, and a given firm can compensate its lack of a specific item or dimension by attaining a higher value with regard to another item. For example, a firm can compensates one unit shortage of its INN 1 INN 1 ‘INN1’ measure by having extra 0.94 ( WWINN ) unit of INN2 or 1.16 ( WWINN ) 2 3 unit of INN3 or even by having some extra units of other items (risktaking and proactiveness). The linear compensation between dimensions is not consistent with the theoretical foundations of entrepreneurship. For example, as mentioned by Lumpkin and Dess (1996) and Shane and Venkataraman (2000), innovation is the essence of entrepreneurship. Theoretically speaking, therefore, we may conclude that there is no linear substitution between items, and especially between dimensions. Fuzzy logic is able to look at this crucial issue in a different way. This shows itself in the rule-making phase. For example, in the rule list of the first-level system, regardless the linguistic values of risk taking (RIS) and proactiveness (PRO), whenever the innovativeness (INN) is ‘low’ the consequence (level of entrepreneurship of the firm) is not ‘high’. This implies that experts implicitly consider this a necessary condition. This is the main reason for the differences in ranking. To examine this case in greater detail, see Table 2.5. Table 2.5 The detail data of two selected cases for comparison purpose (firms 45 and 59)* INN SFirm Measures rank 45 (6, 5.5, 6.5) 4 59 (6.3, 5.67, 6.33) 2
RIS FSMeasures rank rank 8 (5.5, 4, 6.5) 13 2 (6.33, 5.33, 6) 2
PRO FS- FMeasures rank rank rank 12 (7, 6.5) 1 1 2 (5.67, 4.67) 24 2
ENT SFrank rank 1 7 7 1
*S-Rank = ranked by statistical methodology; F-rank = ranked by fuzzy logic methodology
As it can be seen, firm 59 has a higher ranking than firm 45 in terms of its innovativeness (INN) and risk-taking behavior (RIS) in both methodologies, and what gives firm 45 its higher ranking in the case of the statistical methodology is merely only its superior performance with regard to proactiveness (PRO). In fact, the superior performance of firm 45 in two item measures of proactiveness compensates for its inferior 45
performance with regard to the other two dimensions. Therefore, because of the linear relationship in the statistical methodology, in the final ranking, firm 45 wins. By contrast, the FIS does not allow firm 45 to take advantage of this superiority. In the proposed FIS, which is based on the rules made by experts, not having some necessary and more important items and/or dimensions cannot be compensated in this way. For instance, as it in the present case, having a level of proactiveness (PRO) that is equal to or higher than 0.8 is enough for a firm to be considered ‘high’ (with membership degree of 1) in PRO, which means that an additional amount of PRO higher than 0.8 cannot compensate for the lack of other dimensions related to INN and/or RIS. Figure 2.4 shows the activated rules that determine the level of entrepreneurship of these two firms.
a. the activated rules for firm 45
b. the activated rules for firm 59
Figure 2.4 Rules output for two firms 45 and 59
In fact, as mentioned before, scoring higher in terms of proactiveness (PRO) does not guarantee the superiority of firm 45 in the final ranking. Instead, what makes firm 59 superior in the final ranking based on the FIS methodology is its superior score on innovativeness, which activates some of the most powerful rules, such as rules 26 and 27. Statistical vs. DEA-like The proposed DEA-like methodology proposed in this paper is similar to the statistical methodology, as both use linear functions to calculate the level of entrepreneurship of a firm. However, the difference between the 46
two methodologies is that, while the statistical methodology uses the same items’ weights for all firms, the DEA-like methodology uses different item’ weights. In other words, the statistical methodology applies a single linear function, while the DEA-like methodology applies a different linear function measuring a firm’s level of entrepreneurship. This means that the DEA-like methodology uses the best weights in favor of each firm. As a result, having high score(s) on one or more items guarantees a high ranking when using a DEA-like methodology. For example, firm 29 has an efficiency score of 1 and is ranked in the 10th place because its PRO2 score is 6.5, which is the highest score among all the firms. Meanwhile, this firm is ranked 27th in the statistical methodology.
2.5.2
Classification
Another difference between the methodologies lies in their classification potential. Making the membership functions for the dimensions and aggregated entrepreneurship in FIS provides us with a logical framework to classify the firms, while no such framework is available in the case of the naïve and statistical methodologies. DEA-like methodology also has a robust framework to classify firms as either being efficient or inefficient. However, fuzzy logic is better than DEA-like methodology in classifying the firms, because it can classify them into three groups and, even if we have more than three sub-functions for entrepreneurship (here there are three), there may be more classes for the firms. Although one may argue that we can determine some cut-off points to classify firms in naïve and statistical methodologies, determining these cut-off points poses a challenge. If one believes that it is possible to classify firms based on the cut-off points, one also assumes that we can actually determine these cut-off points for other dimensions as well. This kind of thinking would result in the application of fuzzy logic. Considering the results obtained from FIS, based on the membership function built for entrepreneurship (refer to Figure 2.3.d), we can classify firms whose final score is less than 0.5 as ‘firms with a low level of entrepreneurship’. Firms with a final score between 0.5 and 0.8 can be classified as ‘firms with a medium level of entrepreneurship’ and, finally, firms with a final score higher than 0.8 as ‘firms with a high level of entrepreneurship’. According the final results obtained from DEA-like methodology, we can divide the firms into two groups: efficient (entrepreneurial) (those with final score equal or more than 1) and inefficient (non-entrepreneurial) (those with final score less than 1). 47
Table 2.6 shows the classification based on two methodologies (FIS and DEA-like). Table 2.6 Classification of the firms based on the final degree of their entrepreneurship FIS methodology classes Low level firms (total=19) Medium level firms (total=32) High level firms (total=8) 17; 51; 7;24;50;55;56;33;16; 27;36;47;39;46;5;19;38;18;12; 59;11;43;35;31; 49;32;28;14;44;34;30;52;54 25;13;57;37;42;10;2;4;9;15;48; 26;45;6 21 22;8;41;23;29;1;20;53;3;40;58 DEA-like classes Entrepreneurial Non-entrepreneurial 45; 43; 11; 27; 59; 12; 26; 1;2;3;4;5;6;7;8;9;10;13;14;15;16;17;19;20;21;22;23 31; 18; 29; 46 ;24;25;27;28;30;32;33;34;35;36;37;38;39;40;41;42; 44;47;48;49;50;51;52;53;54;55;56;57;58;59
This procedure can be also applied at the level of dimensions and can help incubators, venture capitalists, corporate venturing units, angel investors, investment banks and governments select the best firms in terms of investment opportunities.
2.5.3 Post analysis (vulnerability) Undoubtedly, one of the most important features of a methodology is the stability of its results. As mentioned before, the statistical methodology calculates the final average score of each firm using a linear function, in which the weight of each item is its loading in factor analysis. Therefore, the final average score depends on the data set, which means that, if we add the data of another firm to the data set, new loadings (weights) will result, which in turn affect the final score for the individual firms. Therefore, there is a chance that firms will end up being re-ranked differently each time a new firm is added. If two datasets are applied, one to assess the model (weights) and another for which the degree of EO has to be assessed, this problem can be circumvented. However, such a methodology requires a lot of data. A DEA-like methodology has the same weakness in this respect. While using fuzzy logic, which does not depend on the data set, adding new firms does not change the previous ranking of firms. For example, suppose a new firm with the following measures - INN1:6; INN2:6; INN3:6; RIS1:5; RIS2:5; RIS3:5; PRO1:4; PRO2: 4 - is added to the data set as the 60th firm. Using the statistical methodology, we should obtain the loadings 48
(weights) via a new factor analysis and calculate the final average score of the firms and rank them. If we do this, the new ranking result is, to some extent, different from the previous one. The new firm is ranked 23rd and the position of 15% of all the firms changes (firms 13, 25, 29, 7, 40, 53, 20, 23, 15). On the other hand, fuzzy logic does not encounter this problem because it is not sensitive to the data set. Using the proposed methodology, the new firm is ranked 26th, while the position of the other firms remains as it was before. With the naïve methodology, we apply equal weights for all items, which means that adding one or more firms does not affect the weights and consequently the final scores and rankings of the other firms. On the other hand, the fuzzy logic methodology relies on expert knowledge, which means the experts may influence the rules, which will consequently affect the rankings. The other methodologies do not encounter this problem. We may, however, consider this characteristic of fuzzy logic as an advantage, as we can adjust the rules in certain realworld situations.
2.5.4 Data-set limitation The statistical methodology requires a large data set to calculate the loadings (weights). The DEA-like methodology also has this limitation. As an experimental limitation which comes from DEA literature, we should have at least the following number of DMUs (firms), to calculate the efficiency (entrepreneurial) score of the DMUs (firms). Minimum number of (DMUs) firms = 3 (the number of inputs and outputs). In this paper, for instance, we should have at least 29 firms in order to apply DEA-like methodology with accuracy. By contrast, fuzzy logic and naïve methodologies can be applied even to a population with only two firms.
2.6 Conclusions, implications and future research 2.6.1 Conclusion The construct entrepreneurial orientation for measuring the level of entrepreneurial behavior at firm level has received a great deal of interest and has been applied in numerous studies over the ten years (Rauch et al., 2009). Despite its popularity, various scholars (Zahra, 1993; George, 2006) have raised concerns with regard to the measurement and algorithm used to analyze the construct, which in turn affects the conclusions drawn 49
with regard to a firm’s entrepreneurial orientation. In this article, we assess the extent to which different algorithms affect the calculation of the overall entrepreneurial behavior of a firm, focusing on two types of criticism: the redundancy in the items (Zahra, 1993) and the question whether a construct is of a reflective or formative nature (George, 2006, Stetz et al., 2000). Our approach uses three steps to assess the level of entrepreneurship of firms. Firstly, the meaning of entrepreneurial character has to be defined and different dimensions of the construct have to be identified. Secondly, the measurement of the construct has to be described. And thirdly, the algorithm used to assess the overall entrepreneurial character of a firm has to be selected. This article focuses on the third step, the algorithm used to assess the overall entrepreneurial character of a firm. We have compared the results for four different algorithms: the traditional statistical methodology, a fuzzy-logic methodology, a DEA-like methodology and finally a naïve methodology. Below, we summarize the characteristics of these methodologies (Table 2.7). Table 2.7 Characteristics of the methodologies Characteristic1
Naïve Compensation between items/dimensions (-) Having a framework to classification (+) Vulnerable to add or remove some firms (-) Requires experts' knowledge (-) Data-set limitation (-) Ability to consider the effect of one or more variables in presence of the others (+) Dimensions/items' weights are independent from the data (+) Ability to consider subjective items that cannot converted to objective measures (+)
Yes
Methodology Fuzzy Statistical logic No Yes
DEAlike Yes
No
No
No
Yes
No
No
Yes
Yes
No No No
Yes No Yes
No Yes2 No
No Yes3 No
Yes
Yes
No
No
No
Yes
No
No
1. characteristics considered as advantage are marked by (+) and as disadvantage by(-) 2. a minimum number of subjects and items/variables are needed 3. a minimum number of 3 times of the number of inputs and outputs
As it can be seen from Table 2.7, the fuzzy logic and statistical methodology have the most and least advantages respectively. 50
2.6.2 Managerial implications of the findings It is important for managers to be able to assess explicitly the level of entrepreneurship of their firm. Incubators, corporate venturing units and investment banks need more solid measures than expert intuition to assess the entrepreneurial nature of firms and their founders before they invest in these firms. Our comparative study has revealed significant differences between four methodologies that can be used to assess the level of entrepreneurship of firms. These differences originate, for example, from different ways to weight the effect of items on specific dimensions (and in turn of the dimensions on the overall score) and from the fact that some methodologies allow for a linear compensation of values, while other methodologies do not. It is relevant to know when (in what circumstances) a particular methodology can be used: When an expert committee is evaluating a limited number of firms, a simple naïve methodology (adding up scores) is the most appropriate. The results of this lie in between that the other methodologies and it can be used in case of small populations. The disadvantage of this methodology has to do with the linear compensation it allows, which can tilt the conclusions. When a committee is heterogeneous in nature and wants to assess a model before assessing companies and see whether multiple interdependencies and contingencies are apparent in the criteria used to assess entrepreneurial orientation (EO), although a limited number of cases are available, fuzzy logic would appear to be the best option. When much data is available and/or a separate dataset was used to design a model, a statistical methodology is the most appropriate. A disadvantage of this methodology is the linear compensation it allows. When it is impossible to determine the same item/dimension weight for different firm, the best methodology would be a DEA-like one. However, again, a disadvantage of this methodology is the linear compensation it allows.
2.6.3 Future research Firstly, the methodologies discussed in this paper have to be applied to other different industries to draw a comparison and to determine the most suitable methodology in different situations. Secondly, in this paper we propose and compare different methodologies to determine the level of entrepreneurship of a firm. Future research should apply these methodologies to assess the relationship between the level of 51
entrepreneurship and other variables, such as performance, growth, etc. Thirdly, we can also use these methodologies in real-world situations where firms need to be ranked according to their level of entrepreneurship. Finally, we adopted a specific model of EO, while, in future studies, we could consider different theoretical models and compare the results when applying the proposed methodologies.
2.7 References Andersen, P., & Petersen, N.C. (1993). A procedure for ranking efficient units in data envelopment analysis, Management Science, 39(10), 1261–1264. Audretsch, D.B. (2002). The dynamic role of small firms: evidence from the US, Small Business Economics, 18(1-3), 13-40. Banker, R.D., Conrad, R.F., & Strauss, R.P. (1986). A comparative application of DEA and translog methods: an illustrative study of hospital production, Management Science, 32 (1), 30-44. Bettis, R. A., &. Hitt, M. A. (1995). The New Competitive Landscape, Strategic Management Journal, 16 (Summer), 7-19. Brown, T. E., Davidsson, P., & Wiklund, J. (2001). An operationalization of Stevenson’s conceptualization of entrepreneurship as opportunitybased firm behavior, Strategic Management Journal, 22(10), 953–968. Celebi, D., & Bayraktar, D. (2007). An integrated neural network and data envelopment analysis for supplier evaluation under incomplete information, Expert Systems with Applications, 35(4), 1698–1710. Charnes, A., Cooper W.W., & Rhodes, E. (1978). Measuring the efficiency of decision making units, European Journal of Operational Research, 2, 429–444. Charnes, A., Cooper, W., Lewin, A., & Seiford, L. (1994). Data Envelopment Analysis: Theory, Methodology and Applications. Kluwer Academic Press. Cheng, C-H., Chen, Y-S. & Wu, Y-L. (2009). Forecasting innovation diffusion of products using trend-weighted fuzzy time-series model, Expert Systems with Applications, 36(2), 1826–1832. Cooper, W. W., Seiford, L. M., & Tone, K. (2007). Data Envelopment Analysis: A comprehensive text with models, applications, references and DEA-Solver software. (second edition). Kluwer Academic Publishers, Boston. Covin, J. G., & Slevin, D. P. (1988). The influence of organization structure on the utility of an entrepreneurial top management style, Journal of Management Studies, 25, 217-234. 52
Covin, J. G., Green, K. M., & Slevin, D. P. (2006). Strategic Process Effects on the Entrepreneurial Orientation–Sales Growth Rate Relationship, Entrepreneurship Theory and Practice, 30 (1), 57-81. Covin, J.G. & Slevin, D.P. (1989). Strategic management of small firms in hostile and benign environments, Strategic Management Journal, 10(1), 75–87. Covin, J.G. and Slevin, D.P. (1986). The development and testing of an organizational-level entrepreneurship scale. In: Ronstadt, R., Hornaday, J.A., Peterson, R. and Vesper, K.H., Editors, 1986. Frontiers of Entrepreneurship Research -1986, Babson College, Wellesley, MA, pp. 628–639. D'Aveni, R.A. (1994). Hypercompetition: Managing the dynamics of strategic maneuvering. New York: Free Press. Diamantopoulos, A., & Winklhofer, H. (2001). Index construction with formative indicators: an alternative to scale development, Journal of Marketing Research, 38(2), 269-277. Dillman, D. A. (1978). Mail and Telephone Surveys: The Total Design Method. New York: John Wiley & Sons, Inc. George, B.A. (2006). Entrepreneurial orientation:A theoretical and empirical examination of the consequences of differing construct representations. In proceedings of Babson College Entrepreneurship Research Conference. Bloomington, Indiana, June 8-10. Gibb, A., & Davies, L. (1990). In pursuit of frameworks for the development of growth models for the small business, International Small Business Journal, 9(1), 15–31. Jang, J. S. R. (1993). ANFIS: Adaptive-Network-Based Fuzzy Inference System, IEEE Transactions on Systems, Man and Cybernetics, 23(3), 665-685. Knight, G.A. (1997). Cross cultural reliability and validity of a scale to measure firm entrepreneurial orientation, Journal of Business Venturing, 12(3), 213-225. Kreiser, P.M., Marino, L.D. & Weaver, K.M. (2002). Assessing the relationship between entrepreneurial orientation, the external environment, and firm performance scale: A multi country analysis. In Frontiers of Entrepreneurship Research (pp. 199-208). Wellesley, MA: Babson College. Lee, C.-C. (1990). Fuzzy logic in control systems: fuzzy logic controllerpart 1, IEEE Transactions on Systems, Man, and Cybernetics, 20(2), 404–418. Littunen, H. Networks and Local Environmental Characteristics in the Survival of New Firms, Small Business Economics, 15(1), 59-71 53
Lumpkin, G. T., & Dess, G. G. (1996). Clarifying the entrepreneurial orientation construct and linking it to performance, Academy of Management Review, 21(1), 135-172. Malhotra, J., & Birks, D. (2000). Marketing Research: An Applied Approach, European ed., Prentice Hall/Pearson Education, London. Mamdani, E.H. & Assilian, S. (1975). An experiment in linguistic synthesis with a fuzzy logic controller, International Journal of Man– Machine Studies, 7(1), 1-13. Miller, D. (1983). The correlates of entrepreneurship in three types of firms, Management Science, 29 (7), 770-791. Miller, D., & Friesen, P.H. (1982). Innovation in conservative and entrepreneurial firms: two models of strategic momentum, Strategic Management Journal, 3(1), 1-25. Ragin, C.C. (2000). Fuzzy-set social science, The University of Chicago Press, Ltd., London. Rauch, A., & Frese, M. (2009). Entrepreneurial Orientation, in: A. Bausch and B. Schwenker (eds.), Handbook Utility Management, SpringerVerlag Berlin Heidelberg, 89-103. Rauch, A., Wiklund, J., Lumpkin, G.T. & Frese, M. (2009). Entrepreneurial orientation and business performance: An assessment of past research and suggestions for the future, Entrepreneurship Theory and Practice, 33(3), 761-787. Ray, S.C., (1991). Resource-use efficiency in public schools: a study of Connecticut data, Management Science, 37 (12), 1620-1628. Rezaei, J. & Dowlatshahi, S. (2010). A rule-based multi-criteria approach to inventory classification, International Journal of Production Research, 48(23), 7107-7126. Sekaran, U. (2003). Research methods for business: A skill building approach. Fourth Edition. New York, Shane, S., & Venkataraman, S. (2000). The promise of entrepreneurship as a field of research, Academy of Management Review, 25(1), 217–226. Sherman, H. D., & Gold, F. (1985). Bank branch operating efficiency: Evaluation with data envelopment analysis, Journal of Banking Finances, 9 (2), 297-315. Sherman, H. D., & Ladino, G. (1995). Managing bank productivity using data envelopment analysis (DEA), Interfaces, 25(2), 60-73. Stetz, P.E., Howell, R., Stewart, A., Blair, J.D., & Fottler, M.D. (2000). Multidimensionality of entrepreneurial firm-level processes: Do the dimensions covary? In R.D. Reynolds, E. Autio, C.G. Brush, W.D. Bygrave, S. Manigart, H.J. Sapienza, and D.L. Sexton (Eds.), 54
Frontiers of entrepreneurship research (pp. 459-469). Wellesley, MA: Boston College. Wang, W-P. (2009). Evaluating new product development performance by fuzzy linguistic computing, Expert Systems with Applications, 36 (6), 9759–9766. Wiklund, J., & Shepherd, D. (2003). Knowledge-based resources, entrepreneurial orientation, and the performance of small and medium-sized businesses, Strategic Management Journal, 24(13), 1307–1314. Wiklund, J., & Shepherd, D. (2005). Entrepreneurial orientation and small business performance: a configurational approach, Journal of Business Venturing, 20(1), 71-91. Wu, H-Y., Chen, J-K., & Chen, I-S (2010). Innovation capital indicator assessment of Taiwanese Universities: A hybrid fuzzy model application, Expert Systems with Applications, 37 (2), 1635–1642. Yen, J., & Langari, R. (1999). Fuzzy Logic Intelligence, Control, and Information. Prentice Hall Publishing Company. Zadeh, L. A. (1988). Fuzzy logic, IEEE Computer, 21(4), 83-93. Zadeh, L.A. (1965). Fuzzy sets, Information and Control, 8, 338–353. Zadeh, L.A. (1999). From computing with numbers to computing with words – from manipulation of measurements to manipulation of perceptions, IEEE Transactions on Circuits and Systems, 45 (1), 105– 119. Zadeh, L.A. (2001). A new direction in AI – toward a computational theory of perceptions, AI Magazine, 22 (1), 73–84. Zadeh, L.A. (2008). Is there a need for fuzzy logic?, Information Sciences, 178 (13), 2751–2779. Zahra, S. A. (1993). Environment, corporate entrepreneurship, and financial performance: a taxonomic approach, Journal of Business Venturing, 8(4), 319-340.
55
56
3 A Multi-Variable Approach to Supplier Segmentation1 Abstract – The aim of this paper is to develop a new approach to supplier segmentation that considers the various variables used in existing literature to segment suppliers. A literature review reveals a serious problem from a management perspective. The problem is that many different supplier segmentation methods have been proposed in the last three decades, each of which uses different segmentation variables and hence results in different segments. An overarching supplier segmentation method, considering various segmentation variables, is lacking. Based on an extensive literature review, we have analyzed the current methods and we conclude that the literature on supplier segmentation can be divided into three different schools of thoughts. By clearly identifying the deficiencies of the existing theory on supplier segmentation, we developed a new approach. As the basis for this new approach, we developed three requirements to make an overarching approach to supplier segmentation. Firstly, supplier segmentation should be based on their long-term potential, which we propose to assess in terms of supplier capabilities and willingness to cooperate. Secondly, other functional areas beyond purchasing have to be considered when segmenting suppliers. Thirdly, supplier segmentation should be viewed as a step in a longitudinal process that includes selecting suppliers, segmenting them, managing the relationship with them and actively developing their role over time. We illustrate the proposed approach by segmenting the suppliers of a company in the food industry. Keywords: Supplier Segmentation; Supplier Management; Supplier Development; Supplier Selection; Buyer-Supplier Relationship; Supply Chain Management (SCM).
3.1 Introduction Faced with a competitive global market, firms have downsized, focused on core competencies and attempted to achieve competitive advantage by managing their relationships with suppliers more effectively (Tan et al., 1999). The relationships between buyers and suppliers in a supply chain 1
This chapter is based on: Rezaei, J., and Ortt, R., (2012). A multi-variable approach to supplier segmentation. International Journal of Production research 50(16), 4593-4611.
57
management (SCM) context are investigated in various recent studies. In most cases, the main objective is to evaluate suppliers based on specific criteria and using a variety of multi-attribute decision-making techniques designed to select the best available suppliers. For more information on supplier selection methods and criteria, see Wilson (1994), de Boer et al. (2001), Humphreys et al. (2003), Huang and Keskar (2007), Ho et al. (2010), and others. The relevant criteria can also be used to segment suppliers and are essential in creating prosperous buyer-supplier relationships (Spekman, 1988; Svensson, 2004). Generally speaking, supplier selection requires a buyer to choose a handful of qualitative and quantitative criteria and use them to select the most suitable suppliers. In supplier segmentation, which logically takes place after supplier selection, the buyer further classifies the selected suppliers. This classification or segmentation makes it possible to choose the most suitable strategies for handling different segments of selected suppliers. In the area of marketing, segmentation usually refers to the demand side of the market, the goal being for companies to segment groups of potential customers with similar wants and demands that may respond to a particular marketing mix (Smith, 1956; Kotler, 1991, pp. 262-263). When companies also work with potentially different suppliers, segmenting the supply side of the market can be very valuable as well. One of the fundamental problems is that different methods for supplier segmentation have been specified, all of which use different variables and neglect some other important variables. From a scientific perspective, the lack of an overarching framework including all the important variables represents a serious gap. From a management perspective, this is a problem, because it is hard to choose a method that contains all the important variables. Another fundamental problem is that supplier selection and supplier segmentation assume a static perspective: the assumption is that suppliers are selected and segmented at one point in time, which is accurate when it comes to selecting suppliers for individual transactions. In that case we refer to purchasing. In practice, however, a buyer-supplier relationship can involve many transactions and can evolve over time. In the course of a long-term relationship, suppliers and buyers may decide to share activities, for instance marketing or research and development. Supplier selection and segmentation are closely related to supplier management. Companies first select suppliers, then segment them, adopt a strategy to cope with each segment and finally may decide to adapt this strategy over time as the relationship evolves. 58
The main objective of this paper is to review and discuss supplier segmentation approaches and to present a multi-variable approach. The paper contributes to this objective in the following ways: (1) by reviewing, summarizing and classifying the main methods of supplier segmentation; (2) by providing a comprehensive definition of supplier segmentation; (3) by presenting a new and more comprehensive (multi-variable) approach to supplier segmentation; and (4) by indicating, with a flowchart, the position of supplier segmentation among other supplier-related activities and their interdependency suggesting the practical steps to achieve an effective supplier segmentation process inline with other supplier-related activities. This process and the value of our new approach is illustrated in a realworld case involving a broiler company. In Section 3.2, the main approaches to supplier segmentation are described in detail in the literature review. In Section 3.3, a new and more comprehensive approach to supplier segmentation is formulated, based on three requirements. In section 3.4, we illustrate how the conceptual framework can be used in a real case. In Section 3.5, the conclusions, results, and future research directions are presented.
3.2 Literature review Many researchers have studied supplier segmentation. We found ten major references in supplier segmentation, all of which are summarized in Table 3.1, as a result of a literature search. We classify existing studies into three groups (referred to as methods): (1) the process method, (2) the portfolio method and (3) the involvement method to supplier segmentation.
3.2.1 The process method to supplier segmentation Parasuraman (1980) is one of the first researchers who introduce the concept of supplier segmentation. His main idea was to identify distinguishable segments of potential suppliers for each item to be purchased by an industrial company, based on characteristics that are closely related to the key characteristics of the company’s own customer segments. He proposed a stepwise procedure to implement this approach: Step 1: Identify the key features of customer segments Step 2: Identify the critical supplier characteristics Step 3: Select the relevant variables for supplier segmentation, and Step 4: Identify the supplier segments. Parasuraman’s approach is a process by which supplier segments can be identified. To put it differently, it does not specify the segmentation variables (step 3) but it describes how to find these variables and then 59
form the segments. By contrast, the other nine approaches do specify segmentation variables in advance and thereby distinguish specific segments. It would appear that Parasuraman, being one of the first authors describing supplier segmentation, understood that this type of segmentation should include the entire supply chain process. This contribution indicates how supplier segmentation is a logical step after customer segmentation. We refer to this approach of supplier segmentation as the process method.
3.2.2 The portfolio method to supplier segmentation Kraljic (1983), another pioneer in the area of supplier segmentation, introduced the first comprehensive portfolio approach to purchasing and supply segmentation. To classify the materials or components that a firm purchases, he considered two variables: profit impact and supply risk. The profit impact of a given supply item can be defined in terms of the volume purchased, the percentage of total purchase cost or the impact on product quality or business growth. Supply risk is assessed in terms of the availability and number of suppliers, competitive demand, make-or-buy opportunities, storage risks and substitution possibilities. Based on these two variables, materials or components can be divided into four supply categories: (1) non-critical items (supply risk: low; profit impact: low), (2) leverage items, (supply risk: low; profit impact: high), (3) bottleneck items (supply risk: high; profit impact: low), and (4) strategic items (supply risk: high; profit impact: high). Each category requires a specific supplier strategy. Kraljic’s approach is different from the one proposed by Parasuraman. Kraljic pre-specifies the segmentation variables and the types of segments that can be formed. Although both Kraljic (1983) and Parasuraman (1980) believed that supplier management should be tailored to the supplier segmentation, they do so in completely different ways.
3.2.3 The involvement method to supplier segmentation Dyer et al. (1998) compared the supplier-automaker relationships in the US, Japan and Korea and, based on the differences between outsourcing strategies, developed a strategic supplier segmentation. According to the authors, firms should determine their core competencies, relevant core activities and non-core activities. Resources that relate to core activities are strategic resources, while those that relate to non-core activities are non-strategic resources. Based on this classification, the authors suggest two types of buyer-supplier relationships: 60
1. Durable arm’s length (quasi-market) relationships are suitable for the first class of inputs or resources that are necessary but non-strategic. 2. Strategic Partnerships (quasi-hierarchies) are suitable for the second class of inputs or strategic inputs that are important in differentiating the buyer’s final product. With this method, the level of involvement determines the type of the relationship. There are other classifications that use the level of involvement and coordination between buyer and supplier. Ellram (1991), for example, determined a continuum to classify relationships in the supply chain as: short-term contracts, long-term contracts, joint ventures and equity interests. Cox (1996) considered the relationships in a continuum from arm’s length to strategic alliance. However, Dyer et al. (1998) used involvement to classify suppliers in the most explicit way. An overview of the ten approaches to supplier segmentation is provided in Table 3.1. The information in columns 1-4 of Table 3.1 is selfexplanatory and is directly derived from the papers. The information in the fifth column, however, is our assessment of the theoretical approach in each paper, and therefore requires some explanation. A paper is assumed to adopt a process approach when it describes the process of finding segmentation variables without specifying them. A paper is assumed to adopt a portfolio approach when it focuses exclusively on the characteristics of the supplied items. Finally, a paper is assumed to adopt an involvement approach when it uses segmentation variables that focus on the strength of the relationships between buyers and suppliers. In practice, we found that many supplier segmentation methods consist of a combination of the portfolio and involvement methods. The other seven approaches to supplier segmentation, which appeared at later dates, can all in some way be considered successors of Kraljic (1983) or Dyer et al. (1998), because they adopt similar variables or methods.
61
Table 3.1 The approaches and methods to supplier segmentation Author(s’) approaches
Variables considered
Segments used in supplier relationships
Parasuraman Supplier segmentation is identified for each (1980) item based on characteristics that are closely related to the key characteristics of that item’s costumer segments* Kraljic Profit impact; Non-critical items; (1983) Supply risk Bottleneck items; Leverage items; Strategic items. Olsen and Difficulty of Non-critical; Ellram managing the Leverage; (1997) purchase situation; Bottleneck; Strategic importance Strategic. of the purchase Dyer et Resource allocation Durable arm’s-length; al.(1998) Strategic partnership. Bensaou Supplier’s specific Market exchange; (1999) investments; Captive buyer; Buyer’s specific Captive supplier; investments Strategic partnership. Kaufman et Technology; Commodity supplier; al. (2000) Collaboration Collaboration specialist; Technology specialist; Problem-solving supplier. Masella and Time frame; Short term and logistic; Rangone Content Long term and logistic; (2000) Short term and strategic; Long term and strategic. van Weele Profit impact; Partnership; (2000) Supply risk Competitive bidding; Securing continuity of supply; Systems contracting. Svensson Supplier’s Friendly; (2004) commitment; Transactional; Commodity’s Family; importance Business partner. Hallikas et Supplier dependency Non-Strategic; al. (2005) risk; Asymmetric (Captive Buyer dependency supplier); risk Asymmetric (Captive buyer); Strategic
Methodology Segmentation used method
Conceptual
Process
Conceptual
Portfolio
Conceptual
Portfolio
Empirical
Involvement
Empirical
Portfolio and Involvement
Empirical
Portfolio and Involvement
Conceptual
Portfolio and Involvement
Conceptual
Portfolio and Involvement
Empirical
Portfolio and Involvement
Empirical
Portfolio and Involvement
*As mentioned previously, Parasuraman did not determine specific variables for his model.
62
Table 3.1 shows that, with the exception of Parasuraman (1980) and Dyer et al. (1998), all approaches use only two segmentation variables. Parasuraman (1980) did not pre-specify segmentation variables, while Dyer et al. (1998) used only one segmentation variable on two levels. What the other eight approaches with two segmentation variables have in common is that they distinguish two levels per segmentation variable, which implies that they describe four supplier segments. Although their structure may be similar to a 2x2 matrix, their exact segmentation variables vary considerably, which is a problem and at the same time a sign. The problem is that buyers cannot know whether the approach they apply includes the most appropriate variables (Gelderman and van Weele, 2005), which reinforces the need for a unifying conceptual framework with dimensions that combine the segmentation variables from different methods. Although we agree with Olsen and Ellram (1997) that these dimensions should not be too complex, the complexity of the dimensions should not be reduced at the expense of important variables that are required to operationalize these dimensions. Another important weakness of existing literature is that, in most cases the supplier side is neglected (Gelderman and van Weele, 2003, 2005).
3.2.4 Evolution of supplier segmentation methods The references are ordered in Table 3.1 using the year of their publication. The order of these papers indicates that the process and portfolio approaches appeared in the early 1980’s and the involvement approach emerged much later, in the late 1990’s. Since the late 1990’s, all papers can be classified as a mixture of the portfolio and involvement methods. This allows us to the following two interesting observations regarding the evolution of supplier segmentation literature: 1. The “pure” methods (process, portfolio, and involvement) appeared first and the combination methods (portfolio-involvement) appeared later. An analysis of the references cited in the three papers that introduced these methods, confirms this notion. Parasuraman (1980) (the process approach), Kraljic (1983) (the portfolio approach) and Dyer et al. (1998) (the involvement approach) do not refer to each other’s work. In terms of evolution, it appeared that the three methods developed independently and not as variations or improvements of each other. 2. From the three main references cited and the resulting segmentation methods, it would appear that Kraljic (1983) had the greatest impact on subsequent approaches. Most other authors developed portfolio methods similar to Kraljic’s. His segmentation variables (profit impact and supply 63
risk) re-appeared later (see, for example, van Weele, 2000). Kraljic’s method is also dominant in terms of the number of citations. It is interesting to note, however, that all of the later papers that followed Kraljic’s method also adopted the idea that involvement is an important aspect in supplier segmentation, which suggests that the involvement approach also had a lasting impact on supplier segmentation. Kraljic’s basic approach, as adopted by subsequent authors, evolved over time, for example by adding involvement-related aspects, for example by Masella and Rangone (2000), whose approach we categorized as portfolioinvolvement, and who viewed the nature of relationship between buyer and supplier as one dimension of their segmentation approach. One level of that dimension was strategic integration, which refers to arrangements that involve, for example, joint development of new product and technology. This approach to segmentation in fact shows a transition from the focus of the Kraljic's approach on purchasing and arm's length relationship towards an approach that includes more functional areas as well as a strategic integration between buyer and supplier. As another evolution in Kraljic's approach, we refer to Hallikas et al.'s approach (2005), which considered the management of risk involved in buyersupplier relationship through collaborative learning, while the strategy suggested by Kraljic with regard to handling supply risk focuses on diversity, which means changing suppliers. The evolution in Kraljic’s approach towards including involvement-related aspects can be seen in multiple publications, for instance the interdependency between buyer and supplier suggested by Bensaou (1999), partnership by Kaufman et al. (2000) and van Weele (2000), and supplier's commitment as one dimension of the segmentation by Svensson (2004). 3. Whereas the first two “pure” approaches (the process and portfolio methods), were static by nature, the involvement method, which appeared much later, seemed to adopt a more dynamic perspective. The involvement method focuses on the relationships between suppliers and looks at the evolution of buyer-supplier relationships over time. The evolution in supplier segmentation theory took place within a business context where the role of purchasing had changed fundamentally. Adapting Ellram and Carr (1994), we can view the evolution of the role of purchasing, albeit in a somewhat stylized and simplified way, as follows: • Passive role: In 1970s, the purchasing function had a passive role in the business organization. It was viewed as an administrative rather than a strategic function. • Strategic role: In 1980s, the role of purchasing shifted from passive to strategic. 64
• Integrative role: In 1990s, the purchasing function received more attention as a more significant contributor to the firm’s success compared to some other functions. If we look at the inception of each of the three methods, we can see that the process method (Parasuraman, 1980) and portfolio method (Kraljik, 1983) were introduced when purchasing was viewed as a strategic function, while the involvement method (Dyer et al., 1998) appeared when the purchasing function began to assume a more integrative role. The term ‘supply chain management’ (SCM) originated in the early 1980s, when Oliver and Webber (1982) first coined the term to refer to the integration of different business functions. However, it was not until much later in the 1990s and 2000s, that the area of SCM received real attention. In contrast to the process and portfolio methods, which focus on supplier selection and assume an arm's length relationship between buyer and supplier, the involvement method considers the strategic partnership between buyers and suppliers that is common in SCM (Lambert, 2008). Therefore, the involvement method of supplier segmentation is also congruent with the SCM concept.
3.3
A New Approach to Suppler Segmentation
This section focuses on developing a new approach, in which we integrate the variables used by portfolio and involvement segmentation methods. In addition, we extend the previous methods to include variables and functional areas that thus far as missing in contemporary segmentation literature. Furthermore, our approach provides a practical vision for an effective transition from supplier segmentation towards supplier management. Our approach is a process-driven scheme for supplier segmentation. The meaning of the word “process” is different from the way it is used in Parasuraman's (1980) process method. There are several elements that form the basis for our new approach to supplier segmentation. They are explained in the following sections:
3.3.1 Supplier selection and segmentation variables Supplier segmentation should reflect supplier selection criteria, which will determine which suppliers have the potential to be selected. We therefore refer to these criteria as supplier potential criteria. In general, there are three kinds of supplier selection criteria: ‘element of exchange’-related criteria, supplier-related criteria and relationship-related criteria (there are other classifications of supplier selection criteria, see for example Sen et 65
al., 2008, 2009). ‘Element of exchange’-related criteria refer to characteristics of the goods or activities that are provided by a supplier, while supplier-related criteria refer to the characteristics of the supplier and relationship-related criteria refer to the characteristics of the buyersupplier relationship. Since suppliers can perform differently with regard to the desired criteria, they need to be managed accordingly. Using these to segment suppliers helps the buyers manage their suppliers more effectively. Table 3.1 shows that most of the variables used by the supplier segmentation methods come from the ‘element of exchange’-related criteria (specifically those criteria related to material assets). In other words, the variables used by the previous supplier segmentation methods are a specific sub-set of supplier selection criteria. As we discussed before, this has to do with the fact that, historically, the focus with regard to supplier segmentation has been on purchasing. Contrary to supplier segmentation literature, which is still in its infancy, supplier selection literature is well-developed and well-researched. The supplier segmentation methodology and research can then be improved by considering the available literature on supplier selection. By using the ‘element of exchange’-related criteria and supplierrelated criteria the buyer evaluates different capabilities of the suppliers in different areas. For example, ‘quality’ (from ‘element of exchange’-related criteria) may reflect the ability of the supplier to produce/offer good products/services. Relationship-related criteria, on the other hand, include criteria that are related to the willingness of the exchange partners to start and maintain the relationship. For example, relationship closeness may indicate the extent to which the partners are willing to work closely together. It is important to note that the idea of forming capability and willingness dimensions arose from the need for an overarching model to sort out an overwhelming number of different variables in supplier segmentation and selection literature. In addition, we believe that taking the supplier potential into account is important when it comes to managing and developing suppliers more efficiently. For example, Kraljic (1983) divided buying items into four categories and then segmented suppliers based on these items, indicating that the various suppliers ought to be managed in particular ways. The question is, however, how suppliers with different capabilities that fall into the same segment should be treated. Here, as an example, we cite some important reasons that have been mentioned in existing literature to explain why considering suppliers’ capabilities and willingness is important. Geldermann and van Weele 66
(2003), who conducted case studies to study the measurement issues of Kraljic's model, found that experienced portfolio users always included some additional information (apart from the two dimensions suggested in Kraljic's model), one of which is the capacities (can be considered as supplier's capability) and the intention (can be considered as supplier's willingness) of individual suppliers. Having a long-term relationship with suppliers requires the consideration of supplier capabilities (Talluri and Narasimhan, 2004), which are also the main factor involved in a strong and close buyer-supplier collaboration (de Leeuw and Fransoo, 2009). In addition, the first and most important step in developing suppliers is to evaluate their capabilities (Krause et al., 2001; Wynstra et al., 2001). Trust (categorized as willingness) in long-term relationships can overcome a lot of the difficulties in relationships in the supply chain, such as abuse of power, conflicts and low profitability (Sullivan and Peterson, 1982). Trust can reduce perceived relational risk (Das and Teng 2000) and help maintain the stability of the supply chain in the long term (Handfield and Bechtel, 2002; Chen and Paulraj, 2004). We now define ‘supplier potential’ as the buyer’s perception of supplier capabilities and supplier willingness to engage and maintain a partnership to achieve mutual objectives. Therefore, we use two dimensions (capability and willingness) to assess the potential of a supplier for a particular buyer. Adopting Day’s (1994) definition of capabilities, we define supplier’s capabilities as follows: Supplier’s capabilities are complex bundles of skills and accumulated knowledge, exercised through organizational processes that enable firms to coordinate activities and make use of their assets in different business functions that are important for a buyer. We define supplier's willingness as follows: Supplier’s willingness is confidence, commitment and motivation to engage in a (long-term) relationship with a buyer. We can now present our first requirement for supplier segmentation: Requirement 1. Supplier segmentation should rely on supplier potential, which in turn is driven and defined by supplier selection criteria. Effective supplier segmentation should be based on a supplier’s capabilities and willingness. Using the definition of potential, in terms of supplier capabilities and supplier willingness, we can segment potential suppliers in a matrix into four categories. These categories include high/low capabilities and high/low willingness, as shown in Figure 3.1 (it is also possible to consider three levels (low, medium and high) or even more for capabilities 67
and willingness depending on the complexity and availability of the relevant data.
High
SM2
SM4
Low
SM1
SM3
Willingness
Low
High Capabilities
Figure 3.1 Supplier segmentation based on supplier potential
Let us now take another look at the variables included in Table 3.1. Many of these variables can be translated into the dimensions of capabilities or willingness. A review of literature of buyer-supplier relationships and supplier selection (e.g. Dickson, 1966; Weber et al., 1991; Swift, 1995; Choi and Hartley, 1996; Kannan and Tan, 2002; Smeltzer, 1997; Huang and Keskar, 2007; Handfield et al., 2002; Humphreys et al. 2003; Chan, 2003; Ho et al.; 2010) reveals that there are other variables that have not been considered in existing literature on supplier segmentation. We establish a relatively complete list of these variables under two the headings capabilities and willingness, as shown in Tables 3.2 and 3.3. It is important to note that some of the variables that are in the list of capabilities variables are not capabilities as such but proxies of capabilities. For example “price” itself is not a capability, but a low price means that a company is able to offer its products or services at a low price. The capability to reduce costs is manifested in lower prices. Note also that there is no one-to-one translation of some of the segmentation variables included in Table 3.1 to the capabilities and willingness categories presented in Tables 3.2 and 3.3.
68
Table 3.2 Variables of suppliers’ capabilities for possible supplier segmentation
Capability variables Price/cost
Supporting references Dickson, 1966; Weber et al., 1991; Kannan and Tan, 2002; Day, 1994; Choi and Hartley, 1996; Swift, 1995; Chan, 2003; Rezaei and Davoodi, 2011 Profit impact of supplier Chio and Hartley, 1996; van Weele, 2000; Kraljic, 1983 Delivery Dickson, 1966; Weber et al., 1991; Kannan and Tan, 2002; Day, 1994; Choi and Hartley, 1996; Swift, 1995; Tan et al., 2002; Chan, 2003; Rezaei and Davoodi, 2011 Quality Dickson, 1966; Weber et al., 1991; Tan et al., 2002; Chan, 2003; Rezaei and Davoodi, 2011 Reserve capacity Kannan and Tan, 2002 Industry knowledge Kannan and Tan, 2002 Production, manufacturing/ Dickson, 1966; Weber et al., 1991; Day, transformation facilities and 1994 capacity Geographic location/proximity Dickson, 1966; Weber et al., 1991; Kannan and Tan, 2002; Swift, 1995 Design capability Chio and Hartley, 1996; Chan, 2003 Technical capability Dickson, 1966; Weber et al., 1991; Chio and Hartley, 1996; Swift, 1995; Chan, 2003 Technology monitoring Day, 1994 Management and organization Dickson, 1966; Weber et al., 1991 Supplier process capability Kannan and Tan, 2002 Reputation and position in Dickson, 1966; Weber et al., 1991; industry Chio and Hartley, 1996; Swift, 1995 Financial position Dickson, 1966; Weber et al., 1991; Kannan and Tan, 2002; Day, 1994; Choi and Hartley, 1996; Swift, 1995; Chan, 2003 Performance awards Chio and Hartley, 1996 Performance history Dickson, 1966; Weber et al., 1991; Chan, 2003 69
Cost control Technology development Repair service After sales support Packaging ability Reliability of product Operational controls Training aids Labor relations record Impact on energy utilization Ease of maintenance design Communication system Desire for business Human resource management Amount of past business Warranties and claims
Day, 1994 Day, 1994 Dickson, 1966; Weber et al., 1991 Chio and Hartley, 1996 Dickson, 1966; Weber et al., 1991 Chio and Hartley, 1996; Swift, 1995 Dickson, 1966; Weber et al., 1991 Dickson, 1966; Weber et al., 1991 Dickson, 1966; Weber et al., 1991 Swift, 1995 Swift, 1995 Dickson, 1966; Weber et al., 1991 Dickson, 1966; Weber et al., 1991 Day, 1994 Dickson, 1966; Weber et al., 1991 Dickson, 1966; Weber et al., 1991; Swift, 1995 Market sensing Day, 1994 Customer linking Day, 1994 Environmental health and safety Day, 1994 Innovation Spina et al., 2002 Supplier’s order entry and Kannan and Tan, 2002 invoicing system including EDI Public disclosure of Handfield et al., 2002, Humphreys et environmental record al. 2003 Availability of clean Noci, 1997; Humphreys et al. 2003 technologies Hazardous waste management Noci, 1997; Handfield et al., 2002; Humphreys et al. 2003 Pollution reduction capability Handfield et al., 2002; Humphreys et al. 2003 ISO 14000 and 14001 Handfield et al., 2002; Humphreys et certification al. 2003 Recycling and reverse logistics Handfield et al., 2002; Humphreys et program al. 2003 Environmentally friendly Handfield et al., 2002 product packaging Hazardous air emissions Noci, 1997; Handfield et al., 2002; management Humphreys et al. 2003
70
Table 3.3 Variables of suppliers’ willingness for possible supplier segmentation
Willingness variables Commitment to quality Honest and frequent communications/ communication openness Commitment to continuous improvement in product and process Relationship closeness
Supporting references Kannan and Tan, 2002; Svensson, 2004 Kannan and Tan, 2002; Chio and Hartley, 1996; Smeltzer, 1997
Kannan and Tan, 2002; Svensson, 2004; Urgal-González, and García-Vázquez, 2007 Chio and Hartley, 1996; Kaufman et al., 2000; Chan, 2003 Open to site evaluation Kannan and Tan, 2002 Attitude Dickson, 1966; Weber et al., 1991 Bidding procedural compliance Dickson, 1966; Weber et al., 1991 Reciprocal arrangements Dickson, 1966; Weber et al., 1991; Kaufman et al., 2000 Prior experience with supplier Swift, 1995 Impression Dickson, 1966; Weber et al., 1991 Ethical standards Kannan and Tan, 2002 Willingness to co-design and Spina et al., 2002; Tan et al, 2002 participate in new product development Willingness to integrate supply Kannan and Tan, 2002 chain management relationship Mutual respect and honesty Smeltzer, 1997 Willingness to share Kannan and Tan, 2002; Smeltzer, 1997; information, ideas, technology, Tan et al, 2002 and cost savings Consistency and follow- Smeltzer, 1997 through Supplier’s effort in eliminating Kannan and Tan, 2002 waste Supplier’s effort in promoting Kannan and Tan, 2002 JIT principles Dependency Hallikas et al., 2005; Kaufman et al., 2000 Willingness to invest in Urgal-González, and García-Vázquez, specific equipment 2007 Long term relationship Chio and Hartley, 1996 71
The variables summarized in Tables 3.2 and 3.3 further enhance the practicality of the use of supplier capabilities and willingness as a basis for supplier segmentation. It is clear that, for different functions, different capabilities and willingness may be considered relevant. For example, while buyers may consider ‘purchasing price’ one of the variables to segment suppliers who provide materials, it may be less relevant when it comes to segmenting suppliers who partner in buyer’s new product development project. However, the number of relevant variables for each function would be still a large number. As such, selecting the most relevant variables to segment the suppliers for each function is an important step in practice. Several factors may be considered when selecting the most relevant variables, including firm strategy, product life cycle, industry competition, etc. In practice, the final variables are usually selected by a panel of experts/decision-makers (DM). Because different DMs may have different ideas about the most relevant variables, a group decision-making methodology (e.g. the Delphi method (Linstone and Turoff, 1975); the Nominal Group Technique (Delbecq et al., 1975); Consensus Support System (Alonso et al., 2010)) will help produce a consensus concerning the most relevant variables. 3.3.2 Partnership and collaboration in other activities and functional areas To leverage their company's skills and resources effectively, managers should concentrate on some of their own core competencies and strategically outsource other functions and activities. Firms can benefit from this combined approach in several ways, including maximizing their returns on internal resources by focusing on the functions they perform best and use their suppliers' capabilities to the fullest, which increases their ability to respond to customer needs (Quinn and Hilmer, 1995). As our literature review indicates, almost all existing supplier segmentation studies focus entirely on the purchasing function. Our approach takes into account the possibility that suppliers enter into a partnership and collaborate in other business activities and functions with a buyer in the supply chain. These activities and functions, as described by Lambert (2008) and Mentzer (2004), include: production, finance, logistics, marketing and sales, and R&D. Croom et al. (2000) describe a similar list of functions based on "what" is exchanged between suppliers and buyers in the supply chain (e.g. material assets, financial assets, human resource assets, technological assets, information, and knowledge). Gadde and Snehota (2000) also argue that most relevant studies focus on the 72
importance of buying products (material assets), although the role and value of a buyer-supplier relationship should be assessed well beyond its product/service content. For each function, the capabilities of a supplier and its willingness to cooperate should be assessed. If we consider the willingness/capability matrix as an X-Y-Z plane grid (Figure 3.2), we can consider different options for all functions that are shared by the participants in the supply chain. SM4 SM2
SM3
Functions
SM1
Willingness
Capabilities
Figure 3.2 Different supplier segmentation based on three dimensions
Within the context of SCM, companies should coordinate the traditional business functions and activities within the company and across the supply chain partners. Based on the discussions presented above, the following requirement is developed: Requirement 2. Effective supplier segmentation should go beyond the mere purchasing function and should include other activities and functional areas, such as production, finance, logistics, marketing and sales, and R&D. These activities and functions are not equally important to each individual buyer. For example, while the marketing function is perhaps the most important function when it comes to running a restaurant, purchasing and/or R&D can be the most important functions for a car manufacturer. Therefore, firms should determine the relative importance of their functional areas and segment their suppliers on the basis of their potential suppliers’ capability and willingness regarding each function desire to share with a supplier. 73
3.3.3
Supplier management and supplier development
Ultimately, supplier segmentation should provide a solid basis for supplier management and supplier development over time. Supplier management and development transcend individual orders. The buyer can benefit from a structural approach to developing and maintaining the relationship with different supplier segments (Lambert, 2008), as there is no single ideal relationship for each situation (Lambert et al., 1996). While the buyer may decide to have close relationships with suppliers that belong to a specific segment, an arm's length relationship may be preferred for other segments. In addition, some selected suppliers may lack the adequate capability to perform well in some functional areas (Morgan, 1993; Krause and Ellram, 1997a). Here, the buyer is faced with two possibilities: (1) find alternative suppliers; (2) help supplier improve their performance in the areas in question. Supplier segmentation should provide a suitable framework for the buyer within which to make the best choice of supplier. Supplier management refers to managing the relationships with suppliers over time and can be defined as the communication, evaluation and relationship-building efforts involving suppliers (Anderson et al., 1998). After the suppliers have been selected and segmented by the buyer, the relationships with the various suppliers should then be managed. Supplier development is defined as any set of activities undertaken by a buying firm in coordination with a supplying firm to identify, measure and improve supplier performance and facilitate the continuous improvement of the overall value of goods and services supplied to the buying company's business unit. These activities include, but are not limited to, goal setting, plant visits, supplier audits, supplier training, performance measurement, supplier certification, supplier recognition and efforts to instill a philosophy of continuous improvement in the supplier (Krause et al., 1998). The aim of supplier development is to improve the capabilities and performance of the suppliers and consequently the overall performance of the buyer-supplier relationships. Based on recent studies (e.g. Doney and Cannon, 1997; Shin et al., 2000; Kannan and Tan, 2002, 2003, 2006; Kang et al., 2009), we also found that willingness may be a very important dimension that indicates how suppliers should be developed and managed. Based on the information discussed above, we present our last requirement as follows: Requirement 3. Supplier segmentation should be viewed as the basis of and driving force behind many subsequent activities associated with supplier management and supplier development. 74
This means that the new approach to supplier segmentation proposed in this paper is not a simple 2x2 matrix as found in most studies. Instead, we present a systematic approach that effectively links supplier selection and segmentation to supplier development and management. We believe that the supplier segmentation methods proposed in existing literature, especially the portfolio method, do not provide such a link within the context of SCM. Kraljic (1983, p.113), one of the main pioneers in the field of supplier segmentation, said the following: “The purchasing portfolio matrix plots company buying strength against the strength of the supply market …” “On items where the company plays a dominant market role and suppliers’ strength is rated medium or low, a reasonably aggressive strategy is indicated.”
Not only the above link that we pursue in our paper is missing from this major work in supplier segmentation, but also this work views the suppliers as the firm’s opponent or competitor (rather than as partners). Based on the approach introduced in this paper, the buyer and supplier can decide to develop and advance their relationships, allowing the supplier to move to a better segment. To some extent, this decision pertains to supplier management and supplier development. Existing literature on supplier development focuses mainly on supplier capabilities (e.g. Watts and Hahn, 1993; Hartley and Choi, 1996; Krause and Ellram, 1997a, 1997b; Krause et al., 1998; Dunn and Young, 2004; Humphreys et al. 2004, Wagner, 2006). Krause and Ellram (1997a), for example, define supplier development as “any effort of a buying firm with its supplier(s) to increase the performance and/or capabilities of the supplier and meet the buying firm's short- and/or long-term supply needs.” Based on an extensive literature review, Humphreys et al. (2004) identify the ways by which the buyer may improve supplier capabilities: to increase supplier performance goals; to train the supplier; to provide the supplier with equipment and technological support; to provide the supplier with investments; to exchange personnel; to evaluate supplier performance and to recognize supplier progress in the form of awards. As a result, the supplier moves from SM1 to SM3 or from SM2 to SM4 (see Figure 3.3).
75
SM2
SM4
SM1
SM3
High
Willingness Low
Low
High Capabilities
Figure 3.3 Supplier development based on supplier potential
We believe that, in addition a supplier’s performance and capabilities, increasing the level of supplier willingness is also important. For example, Kannan and Tan (2002) found that a supplier’s willingness to develop closer ties and share confidential information is likely to affect the buying firm’s business performance, which is one of the main purposes of supplier development. As a result of these improvements, the supplier moves from SM1 to SM2 or from SM3 to SM4. Keeping these in mind, we define supplier development as any effort to increase the capabilities and willingness of the supplier, which in turn results in improving the long-term relationships between buyers and suppliers and their long-term performance. In our approach, supplier development means any effort on the part of the buyer (or even the buyer and supplier together) to promote suppliers from SM1 to SM2 or SM3 or even to SM4 and from SM2 or SM3 to SM4. After considering all the requirements and their related elements in our new approach to supplier segmentation, we can now define supplier segmentation as follows: Supplier segmentation is the identification of the capabilities and willingness of suppliers by a particular buyer in order for the buyer to engage in a strategic and effective partnership with the suppliers with regard to a set of evolving business functions and activities in the supply chain management. This definition takes into account an effective supplier selection methodology as well as an effective partnership with suppliers in terms of 76
supplier management and development, thus providing the connection discussed earlier. 3.3.4
The practical steps of supplier segmentation
Based on the new supplier segmentation approach, we propose a mechanism to segment suppliers in practice. The following practical steps are involved: Step 1. Determine the functions and activities that the buyer tends to carry out either internally or externally; Step 2. Determine the relative weight of functions the buyer wants to delegate to suppliers; Step 3. Select the suitable suppliers for the different functions and activities (supplier selection); Step 4. Categorize the buyer’s suppliers based on different functions determined in step 1; Step 5. Segment the suppliers based on their capabilities and willingness for each function separately (supplier segmentation); Step 6. Determine and implement the suitable strategy to manage each segment (supplier management); Step 7. Determine and implement the suitable strategy to develop the supplier relationships over time (supplier development); Step 8. Evaluate the performance of suppliers (supplier evaluation). The evaluation of suppliers can loop back to step 1, 3 or 5 in the future as the relationships change or evolve. Effective supplier segmentation should consider past and present partnerships with suppliers and provide suitable strategies to manage and develop existing and future suppliers. We present the practical steps of our approach to supplier segmentation and its relationship to other supplierrelated activities in Figure 3.4. This flowchart illustrates the dynamic nature of the proposed supplier segmentation approach. In other words, if we consider the concepts of supplier selection, segmentation, management, development, and evaluation as a single integrated closed chain, it becomes clear why it is necessary to update the status of suppliers or their segments.
77
Determine the functions undertaken in the firm
Perform the functions in the buyer’s firm
Does the Buyer want to do this function internally?
Yes
No Rank order the importance of the functions
Select the firm’s suppliers for these functions (Selection phase)
Segment the suppliers based on their capabilities and willingness (Segmentation phase) Determine the suitable strategy for each segment (Management phase)
Develop and promote the supplier to a more mature segment (Development phase) Evaluate the performance of suppliers (Evaluation phase)
Yes Yes No
Can an alternative supplier be found?
No
Can the supplier’s potential be improved?
No
Does the supplier satisfy buyer's function?
Yes
Figure 3.4 The conceptual framework for supplier-related activities for a buyer
3.4 Illustration of the proposed approach in a real-world situation In this section, we illustrate how the proposed conceptual framework can be used in practice, based on a case involving a company from the poultry 78
industry. This industry was chosen since concentration downstream in this industry has resulted in concentration upstream (Ryder and Fearne, 2003), which means that many food companies have become more reliant on external suppliers (van der Valk and Wynstra, 2005) to satisfy the fastchanging customer requirements. The input materials are mostly perishable and the quality of the final product is highly dependent on the suppliers. Furthermore, because the final product should be sold and delivered on time, marketing and sales are crucial activities in this industry. As such, companies operating in this industry need to segment their selected suppliers in order to manage them adequately. In addition, with respect to the potential transmission of diseases from the suppliers' products, they should be frequently evaluated. These characteristics require a dynamic system for selecting, segmenting, managing, developing and evaluating suppliers. A simplified map of the company's supply chain is presented in Figure 3.5. Farm
Feed Company
Fast Food Outlet Breeding Company
Hatchery Broiler Company Processing Plant
Chemical Manufacturer
Medications Company Retailer Outlet
Raw material
Equipment Manufacturer
Figure 3.5 Supply chain of the broiler company
The selected company (ABC Company) does not share production, finance and logistics functions with its suppliers and does not carry out any R&D activities, while for the other functions (purchasing, and marketing & sales) the company relies on its supply chain partners. Based on the proposed conceptual framework, we should segment the suppliers 79
of each of these two functions separately, considering different criteria for their capabilities and willingness.
3.4.1 Supplier segmentation for purchasing function ABC Company is a broiler company that buys newly hatched chicks and other materials, such as fodder, medication and equipment, from 43 suppliers, raising chicks to market weight and selling them after some processing. To segment the suppliers, some criteria regarding their capabilities and some criteria regarding their willingness are needed. Interviewing the manager of the company yielded six criteria for capabilities and six for willingness that have been applied to the suppliers who provide newly hatched chicks, fodder, medications and equipment as follows. The criteria were selected from the criteria presented in Tables 3.2 and 3.3. The capabilities-related criteria are price, delivery, quality, reserve capacity, geographical location and financial position. During the interview with the manager of the company, we found that, because demand for the final product is relatively elastic and the selling price is highly dependent on the purchasing price of the input materials, price is an important segmentation variable. The quality of the final product is also highly dependent on input materials, which is why quality is selected by the manager as a segmentation variable. Delivery, reserve capacity and geographical location are important because most the input materials are highly perishable and customer demand also fluctuates. The financial position of the supplier is important because credit purchase is highly preferred by the buyer. The manager believes that, in this industry, these supplier capabilities are crucial to a broiler company. The willingnessrelated criteria are commitment to quality, communication openness, reciprocal arrangement, willingness to share information, supplier’s effort in promoting JIT principles and willingness to maintain a long-term relationship. The willingness criteria selected by the manager are important to make a close relationship in order to guarantee meeting the desirable requirements the buyer needs to satisfy its customers. We used score sheets to assess the suppliers with respect to different capabilities and willingness criteria (1: very low to 5: very high), based on the interview with the manager. The scores were then equally rated and averaged, which provided us with two indexes. The results are presented in Figure 3.6.
80
SM2
SM4
SM1
SM3
Figure 3.6 Supplier segments (purchasing)
The number of suppliers categorized in each segment is as follows. Suppliers with low capabilities and low willingness (SM1): 3; suppliers with low capabilities and high willingness (SM2): 6; suppliers with high capabilities and low willingness (SM3): 2; and suppliers with high capabilities and high willingness (SM4): 32. Note that some points in Figure 3.6 overlap and represent more than one supplier.
3.4.2 Supplier segmentation for marketing & sales Eight suppliers provide marketing and sales services to the ABC Company. They deliver the raised chicken to processing plants and sell the finished products to fast-food, restaurants and retailers. Based on the interview with the manager, yielded four important criteria for capabilities (price, geographical location, market knowledge and financial position) and three for willingness (honest and frequent communications, willingness to share information and a long-term relationship). We found 81
that, as storing the final product is very expensive, pricing is very crucial when it comes to selling the final product on time. The geographical location of the suppliers is also considered because of the importance of the market coverage. Market knowledge and the financial position of the suppliers are important to the company because they affect its market share and liquidity respectively. The willingness variables are also considered relevant because the information suppliers can provided about the market in the long term affects the company's overall performance. The same score sheets are used to assess the suppliers with respect to different criteria (1: very low to 5: very high). The score sheets were completed during an interview with the manager. The scores of each dimension (capabilities and willingness) were then equally rated and averaged providing two indexes. The results are presented in Figure 3.7. The number of suppliers categorized in each segment is as follows. Suppliers with low capabilities and low willingness (SM1): 0; suppliers with low capabilities and high willingness (SM2):1; suppliers with high capabilities and low willingness (SM3): 1; and suppliers with high capabilities and high willingness (SM4): 6.
SM2
SM4
SM1
SM3
Figure 3.7 Suppliers segments (marketing & sales)
82
This segmentation indicates how the firm can manage its suppliers differently by considering their capabilities and willingness. It also provides an adequate basis for developing the suppliers. For instance, suppliers who are placed in SM1 are neither capable nor willing to have a relationship with the firm. The firm may decide to try and develop the supplier. However, in some cases, there is no possibility or feasibility to improve the supplier. The firm may then terminate its relationship with these suppliers in favor of better alternatives. However, the firm may have a completely different strategy towards handling the suppliers in the SM2 segment. The firm may try to develop the capabilities of these suppliers. However, if that is not possible in the short term and there are several alternative suppliers, the firm may replace these suppliers with more capable ones. With regard to handling the suppliers segmented in SM3, the buyer should focus on improving and strengthening the relationship, as they are capable suppliers. The suppliers segmented in SM4 are the most valuable and the firm should invest in those relationships. We also asked the company manager to rank the relative importance of the two functions (purchasing, and marketing and sales) they share with their suppliers. He thinks that, in this industry, marketing and sales are more important than purchasing, which means that, based on our approach, the company should focus more on managing the relationships the company has with the suppliers who market and sell the company's final product. We discussed the results of the segmentation with the manager of the company we studied. He was very satisfied with the results and has already started to implement the proper strategies for each segment. To benefit from the dynamic feature of the proposed framework, the company also planned to follow the supplier-related phases we already talked about in section 3.3.4 and conduct the segmentation phase twice a year. The results obtained in the real-world study demonstrate the main advantages of our proposed approach as follows: It does not restrict the DM to using a pre-defined limited number of segmentation variables, but instead allows the DM to use the most relevant variables within a given situation, It not only segments the suppliers for each function, which in turn calls for different supplier relationship management and supplier development strategies, but also determines the relative importance of the segmentation for different functions.
83
It takes into account the inherent connections that exist between supplier-related activities in SCM framework, and facilitates the implementation of supplier segmentation in a dynamic fashion.
3.5 Discussion, Conclusion and Future Research Directions Supplier relationships are crucial to the success of many companies. From a buyer’s perspective, this paper identifies four related-supplier activities: selection, segmentation, management and development. Suppliers have to be selected before they are segmented and strategies can then be adopted to manage the relationships with these suppliers over time. From a managerial perspective, it is obvious that the four activities (selection, segmentation, management and development) are closely connected. By contrast, the way these four topics are views in scientific literature varies considerably. This can be explained by the way ideas about supplier relationships have evolved in recent decades. One of the aims of this paper is to integrate the supplier-related activities into a unifying framework. Existing studies present a fragmented and incomplete picture and there is no unifying framework or theme. A review of supplier selection literature revealed many selection methods. Along with a comprehensive set of selection variables, have been identified. In terms of scientific contributions, supplier selection is the most mature activity in the field of buyer-supplier relationships. Supplier selection literature roughly goes back to the 1970s (see for example: Dickson, 1966; Berens, 1971-1972; Håkansson and Wootz, 1975). In this paper, our primary focus has been on supplier segmentation literature that was published much later (in the 1980s). Ten different segmentation approaches were discussed and categorized in three methods or schools of thought (the process method, the portfolio method and the involvement method). A major contribution of this paper is the development of new and broader approach to supplier segmentation, embedded in the concept of SCM and developed on the basis of three main elements of buyer-supplier relationships, which we translated into three important requirements, which increased our knowledge of supplier segmentation, for instance by allowing us to propose a new definition for supplier segmentation, which may serve as a basis for future research in supplier segmentation and related issues. The essence of these requirements included three findings: Firstly, all supplier-related activities must be integrated to optimize the overall buyersupplier relationships. Secondly, the exclusive focus on purchasing should 84
be widened to include other functions and activities of the buying firm. Thirdly, the supplier-buyer relationships, within the supplier segmentation context, should be managed over time. Furthermore, these relationships should become the basis for effective supplier management and development by the buying firm over time. On the basis of these ideas and insights, we categorized all the variables we found in supplier selection and segmentation literature into two distinct dimensions (capabilities and willingness). The variables reflecting the suppliers’ capabilities and those reflecting the suppliers’ willingness to engage in a relationship with a buying company have been described in detail. Using these two dimensions allowed us to identify four quadrants of supplying companies, which were used to sketch the changing position of suppliers over time from the buyer's perspective. The two-dimensional supplier segmentation was further extended to a three-dimensional supplier segmentation by allowing suppliers and buyers to work together in activities and functional areas other than purchasing. The suppliers can be categorized separately on the basis of their willingness and capabilities with regard to each of the functional areas. We also explained how the proposed approach for supplier segmentation could be used in practice. The practical steps showed how a buying company can carry out various necessary activities in order to effectively manage its supplier-related activities. Within this framework, we attempted to assist the buyer to make the most robust and logical connection between the most important decisions buyers have to make in the relationships with their suppliers. This framework provides buyers with a much greater understanding of how to develop and maintain relationships with their suppliers. A real case study was used to illustrate our approach in practice. We think that the proposed approach can be further developed in the future. First of all, segmenting suppliers cannot by itself result in a good supplier management and development strategy without considering the buyer potential as well. Undoubtedly, the suitable approach to dealing with a supplier with low capabilities and high willingness is different for a buyer with high capabilities and high willingness compared to a buyer with low capabilities and low willingness. Indeed, considering the potential of the buyer and supplier simultaneously and combining the two potentials may result in more effective buyer-supplier strategies. Therefore, we believe that an appropriate approach should consider (1) the conditions and circumstances of suppliers, and (2) the conditions and circumstances of buyers. Secondly, as the proposed framework contains multiple variables (criteria), it is suggested to apply some multi-criteria 85
decision-making methodologies to aggregate these variables (criteria) when constructing the dimensions (see for example Lee and Drake, 2010). A third suggestion is to integrate supplier segmentation with other supplier-related optimization problems, such as ‘lot-sizing and supplier selection’ (Rezaei and Davoodi, 2008; 2011) and pricing (Rezaei and Davoodi, 2011). Another future research would be developing proper strategies for handling the suppliers in each segment in addition to proper strategies for upgrading suppliers. Finally we think longitudinal studies in a firm can provide the information needed to assess the dynamic aspects of the proposed approach.
3.6 References Alonso, S. Herrera-Viedma, E. Chiclana, F. and Herrera, F. 2010. A web based consensus support system for group decision making problems and incomplete preferences. Information Sciences, 180(23), 44774495. Anderson, R.D., Jerman, R.E. and Crum, MR., 1998. Quality management influences on logistics performance. Transportation Research Part E, (Logistics and Transportation Review), 34 (2), 137-148. Bensaou, B.M., 1999. Portfolios of buyer-supplier relationships. Sloan Management Review, 40(4), 35-44. Berens, J.S., 1971-72. A decision matrix approach to supplier selection. Journal of Retailing, 47 (4), 47-53. Chan, F.T.S., 2003. Interactive selection model for supplier selection process: an analytical hierarchy process approach. International Journal of Production Research, 41 (15), 3549-3579. Chen, I.J. and Paulraj, A., 2004. Understanding supply chain management: critical research and a theoretical framework. International Journal of Production Research, 42 (1), 131-163. Choi, T.Y. and Hartley, J.L., 1996. An exploration of supplier selection practices across the supply chain. Journal of Operations Management, 14 (4), 333–343. Cox, A., 1996. Relational competence and strategic procurement management. European Journal of Purchasing and Supply Management, 2 (1), 57–70. Croom, S., Romano, P. and Giannakis, M., 2000. Supply chain management: an analytical framework for critical literature review. European Journal of Purchasing & Supply Management, 6 (1), 67-83. Das T.K. and Teng B.S., 2000. A resource-based theory of strategic alliances. Journal of Management, 26 (1), 31–61. 86
Day, G.S., 1994. The capabilities of market-driven organizations. The Journal of Marketing, 58 (4), 37-52. de Boer, L., Labro, E. and Morlacchi, P., 2001. A review of methods supporting supplier selection. European Journal of Purchasing & Supply Management, 7 (2), 75-89. de Leeuw, S. and Fransoo, J., 2009. Drivers of close supply chain collaboration: one size fits all?. International Journal of Operations & Production Management, 29 (7), 720-739. Delbecq, A.l. Van de Ven A.H. and Gustafson, D.H. 1975. Group Techniques for Program Planning: A Guide to Nominal Group and Delphi Process, Glenview, IL: Scott, Foresman and Company. Dickson, G.W., 1966. An analysis of vendor selection systems and decisions. Journal of Purchasing, 2 (1), 5-17. Doney, P.M. and Cannon, J.P., 1997. An examination of the nature of trust in buyer-seller relationships. The Journal of Marketing, 61 (2), 35-51 Dunn, S.C. and Young. R.R., 2004. Supplier assistance within supplier development initiatives. The Journal of Supply Chain Management, 40(3), 19-29. Dyer, J.H., Cho, D.S. and Chu, W., 1998. Strategic supplier segmentation: the next ‘best practice’ in supply chain management. California Management Review, 40 (2), 57-77. Ellram, L.M. and Carr, A.S., 1994. Strategic purchasing: a history and review of the literature. International Journal of Purchasing and Materials Management, 30 (3), 2–8. Ellram, L.M., 1991. Supply chain management: the industrial organization perspective. International Journal of Physical Distribution and Logistics Management, 21 (1), 13–22. Gadde, L.E. and Snehota, I., 2000. Making the most of supplier relationships. Industrial Marketing Management, 29(4), 305–316. Gelderman, C.J. and van Weele, A.J., 2003. Handling measurement issues and strategic directions in Kraljic's purchasing portfolio model. Journal of Purchasing and Supply Management, 9 (5-6), 207-216. Gelderman, C.J. and van Weele, A.J., 2005. Purchasing portfolio models: a critique and update. Journal of Supply Chain Management, 41 (3), 19– 28. Håkansson, H. and Wootz, B., 1975. Supplier selection in an international environment: an experimental study. Journal of Marketing Research, 12 (1), 46-51. Hallikas, J., Puumalainen, K., Vesterinen, T. and Virolainen, V.M., 2005. Risk-based classification of supplier relationships. Journal of Purchasing & Supply Management, 11(2-3), 72–82. 87
Handfield R.B. and Bechtel C., 2002. The role of trust and relationship structure in improving supply chain responsiveness. Industrial Marketing Management. 31(4), 367–382. Handfield, R.B., Walton, S.V., Sroufe, R. and Melnyk, S.A., 2002. Applying environmental criteria to supplier assessment: A study in the application of the Analytical Hierarchy Process. European Journal of Operational Research, 141 (1), 70-87. Hartley, J.L., and Choi, T.Y., 1996. Supplier development: customers as a catalyst of process change. Business Horizons, 39 (4), 37-44. Ho, W., Xu, X. and Dey, P. K., 2010. Multi-criteria decision making approaches for supplier evaluation and selection: A literature review. European Journal of Operational Research, 202 (1), 2010, 16-24. Huang, S. H. and Keskar, H., 2007. Comprehensive and configurable metrics for supplier selection. International Journal of Production Economics, 105 (2), 510-523. Humphreys, P.K., Li, W.L. and Chan, L.Y., 2004. The impact of supplier development on buyer–supplier performance. Omega, 32(2), 131-143. Humphreys, P.K., Wong, Y.K. and Chan, F.T.S., 2003. Integrating environmental criteria into the supplier selection process. Journal of Materials Processing Technology, 138 (1-3), 349-356. Kang, M.P., Mahoney, J.T. and Tan, D., 2009. Why firms make unilateral investments specific to other firms: the case of OEM suppliers. Strategic Management Journal, 30 (2) 117-135. Kannan, V.R. and Tan, K.C., 2002. Supplier selection and assessment: their impact on business performance, The Journal of Supply Chain Management, 38(4), 11-21. Kannan, V.R. and Tan, K.C., 2003. Attitudes of US and European managers to supplier selection and assessment and implications for business performance. Benchmarking: An International Journal, 10 (5), 472-489. Kannan, V.R. and Tan, K.C., 2006. Buyer-supplier relationships: The impact of supplier selection and buyer-supplier engagement on relationship and firm performance. International Journal of Physical Distribution & Logistics Management, 36 (10), 755-775. Kaufman, A., Wood, C.H. and Theyel, G., 2000. Collaboration and technology linkages: a strategic supplier typology. Strategic Management Journal, 21(6), 649-663. Kotler, P., 1991. Marketing management analysis, planning, implementation, and control, seventh edition, New Jersey: PrenticeHall, Inc. 88
Kraljic, P., 1983. Purchasing must become supply management. Harvard Business Review, (September/October), 109-117. Krause, D.R. and Ellram, L.M., 1997a. Critical elements of supplier development. European Journal of Purchasing & Supply Management, 3 (1), 21-31. Krause, D.R. and Ellram, L.M., 1997b. Success factors in supplier development. International Journal of Physical Distribution & Logistics Management, 27 (1), 39-52. Krause, D.R., Handfield, R.B., and Scannell, T.V., 1998. An empirical investigation of supplier development: reactive and strategic processes. Journal of Operations Management, 17 (1), 39-58. Krause, D.R., Pagell, M. and Curkovic, S., 2001. Toward a measure of competitive priorities for purchasing. Journal of Operations Management, 19(4), 497–512. Lambert, D.M., (editor) 2008. Supply chain management: Process, partnership, performance, 3th edition, Supply chain management institute, Sarasota, Florida. Lambert, D.M., Emmelhainz, M.A. and Gardner, J.T., 1996. Developing and implementing supply chain partnership. The International Journal of Logistics Management, 7 (2), 1-17. Lee, D.M. and Drake, P.R., 2010. A portfolio model for component purchasing strategy and the case study of two South Korean elevator manufacturers. International Journal of Production Research, 48 (22), 6651-6682. Linstone, H.A. and Turoff, M. 1975. The Delphi method: Techniques and applications, Addison-Wesley Pub, Mass. Masella, C. and Rangone, A., 2000. A contingent approach to the design of vendor selection systems for different types of co-operative customer/supplier relationships. International Journal of Operations & Production Management, 20 (1), 70-84. Mentzer, J.T., 2004. Fundamentals of supply chain management: Twelve drivers of competitive advantage, Sage Publications, Inc., USA. Morgan J., 1993. Supplier programs take time to become world class. Purchasing; 19(August), 61-63. Noci, G., 1997. Designing green vendor rating systems for the assessment of a supplier’s environmental performance. European Journal of Purchasing and Supply Management, 3(2) (1997), 103–114. Oliver, R. K., and Webber, M. D., 1992. Supply-Chain Management: Logistics Catches Up with Strategy. Outlook (1982); In: Christopher, M. G.: Logistics, The Strategic Issue. Chapman and Hall, London. 89
Olsen, R.F. and Ellram, L.M., 1997. A portfolio approach to supplier relationships. Industrial Marketing Management, 26 (2), 101-13. Parasuraman, A., 1980. Vendor segmentation: An additional level of market segmentation. Industrial Marketing Management, 9(1), 59-62. Quinn, J.B. and Hilmer, F.G., 1994. Strategic outsourcing, Sloan Management Review, (Summer), 43-55. Rezaei, J. and Davoodi, M. 2008. A deterministic, multi-item inventory model with supplier selection and imperfect quality. Applied Mathematical Modelling, 32(10), 2106-2116. Rezaei, J. and Davoodi, M. 2012. A joint pricing, lot-sizing, and supplier selection model. International Journal of Production Research, 50(16), 4524-4542. Rezaei, J. and Davoodi, M. 2011. Multi-objective models for lot-sizing with supplier selection. International Journal of Production Economics, 130 (1), 77-86. Ryder, R. and Fearne, A., 2003. Procurement best practice in the food industry: supplier clustering as a source of strategic competitive advantage. Supply Chain Management: An International Journal, 8 (1), 12-16. Sen, C.G., Baracli, H., Sen, S. and Basligil, H. 2009. An integrated decision support system dealing with qualitative and quantitative objectives for enterprise software selection. Expert Systems with Applications, 36 (3), 5272-5283. Sen, S., Basligil, S., Sen, C.G. and Baracli, H. 2008. A framework for defining both qualitative and quantitative supplier selection criteria considering the buyer-supplier integration strategies. International Journal of Production Research, 46 (7), 1825-1845. Shin, H., Collier, D. A. and Wilson, D. D., 2000. Supply management orientation and supplier/buyer performance. Journal of Operations Management, 18 (3), 317-333. Smeltzer, L.R. 1997. The meaning and origin of trust in buyer-supplier relationships. International Journal of Purchasing and Materials Management, 33(1), 40-48. Smith, W.R., 1956. Product differentiation and market segmentation as alternative marketing strategies. The Journal of Marketing, 21 (1), 3-8 Spekman, R.E., 1988. Strategic supplier selection: Understanding longterm buyer relationships. Business Horizons, 31 (4), 75-81. Spina, G., Verganti, R. and Zotteri, G., 2002. Factors influencing codesign adoption: drivers and internal consistency. International Journal of Operations & Production Management, 22 (12), 1354–1366. 90
Sullivan, J. and Peterson R. B., 1982. Factors Associated with Trust in Japanese-American Joint Ventures. Management International Review, 22(2), 30-40. Svensson, G., 2004. Supplier segmentation in the automotive industry: A dyadic approach of a managerial model. International Journal of Physical Distribution & Logistics Management, 34 (1), 12-38. Swift, C.O., 1995. Preferences for single sourcing and supplier selection criteria. Journal of Business Research, 32(2), 105–111. Talluri, S. and Narasimhan, R., 2004. A methodology for strategic sourcing. European Journal of Operational Research, 154(1), 236– 250. Tan KC, Kannan VR, Handfield RB, Ghosh S. 1999. Supply chain management: an empirical study of its impact on performance. International Journal of Operations & Production Management; 19 (10), 1034-1052. Tan, K.C., Lyman, S.B., Wisner, J.D., 2002. Supply chain management: a strategic perspective. International Journal of Operations & Production Management, 22 (6), 614-631. Urgal-González, B and García-Vázquez, J.M., 2007. The strategic influence of structural manufacturing decisions. International Journal of Operations & Production Management, 27 (6), 605–626. van der Valk, W. and Wynstra, F., 2005. Supplier involvement in new product development in the food industry. Industrial Marketing Management, 34 (7), 681-694. van Weele, A.J., 2000. Purchasing and Supply Chain Management, Business Press, Thomson Learning, London. Wagner, S.M., 2006. Supplier development practices: an exploratory study. European Journal of Marketing, 40 (5/6), 554-571. Watts, C.A. and Hahn, C.K., 1993. Supplier Development Programs: An Empirical Analysis. Journal of Supply Chain Management, 29 (2), 249. Weber, C.A., Current, J.R. and Benton, W.C., 1991. Vendor selection criteria and methods. European Journal of Operational Research, 50(1), 2-18. Wilson, E.J., 1994. The relative importance of supplier selection criteria: A review and update. Journal of Supply Chain Management, 30 (3), 3441. Wynstra, F., van Weele, A. and Weggemann, M., 2001. Managing supplier involvement in product development: Three critical issues. European Management Journal, 19 (2), 157–167. 91
92
4 Multi-Criteria Supplier Segmentation using a Fuzzy Preference Relations Based AHP1 Abstract – One of the strategic activities of a firm is supplier segmentation, whereby a firm creates groups of suppliers to handle them differently. Existing literature provides several typologies of suppliers, each of which uses different dimensions/variables. In this paper, different typologies are combined by distinguishing two overarching dimensions, the capabilities and the willingness of suppliers to cooperate with a particular firm. These dimensions cover almost all the existing supplier segmentation criteria mentioned in existing literature. For each particular situation, these dimensions can be specified using a multi-criteria decision-making method. A methodology is proposed that includes a fuzzy Analytic Hierarchy Process (AHP) which uses fuzzy preference relations to incorporate the ambiguities and uncertainties that usually exist in human judgment. The proposed methodology is used to segment the suppliers of a broiler company. The result is a segmentation of suppliers based on two aggregated dimensions. Finally some strategies are discussed to handle different segments and concluding remarks and suggestions for future research are provided. Keywords: supplier segmentation; supply chain management; fuzzy AHP; fuzzy preference relations
1
This chapter is based on: Rezaei, J., and Ortt, R., (2012). Multi-Criteria Supplier Segmentation using a Fuzzy Preference Relations Based AHP. European Journal of Operational Research, doi: 10.1016/j.ejor.2012.09.037. Some other MCDM methodologies have been also applied to formulate and solve this problem: Rezaei, J., Ortt, R., 2012. Supplier segmentation using fuzzy logic, Industrial Marketing Management, forthcoming. Rezaei, J., and Ortt, R., 2012. Two Multi-criteria Approaches to Supplier Segmentation, In: J. Frick and B. Laugen (Eds.): IFIP AICT 384, pp. 317–325. Rezaei, J., and Ortt, R., 2011. A Rule-Based Approach to Supplier Segmentation, International Conference on Advances in Production Management Systems APMS 2011. 26-28 September 2011, Stavanger, Norway.
93
4.1 Introduction Supplier segmentation logically takes place after supplier selection. It basically means that a firm classifies its suppliers in different segments, which is essential for a buying firm that wants to deal with different suppliers in a systematic way. Firms should think more strategically about supplier relationship management and should not consider a “one-size-fitsall” strategy for supplier relationship management (Dyer et al., 1998). Traditionally the segmentation of suppliers is based on two dimensions. By using a 2×2 matrix, suppliers are segmented to four segments. Parasuraman (1980) and Kraljic (1983) were among the first researchers to propose the concept of supplier segmentation. Kraljic (1983) explicitly presented a model to segment supplies (the goods supplied) into four segments, using two dimensions (profit impact and supply risk for items supplied) and considered two levels (low and high) for each of these dimensions. As a result, supplies are segmented into four categories: (1) Non-critical items (supply risk: low; profit impact: low); (2) Leverage items (supply risk: low; profit impact: high); (3) Bottleneck items (supply risk: high; profit impact: low); and (4) Strategic items (supply risk: high; profit impact: high). Different strategies are described to handle the suppliers in each segment. Adopting Kraljic's so-called portfolio approach, several two-dimensional supplier segmentation methods have been proposed. For example: difficulty of managing the purchase situation; and strategic importance of the purchase (Olsen and Ellram, 1997); the supplier’s and buyer’s specific investments (Bensaou, 1999); technology; and collaboration (Kaufman et al., 2000); supplier’s commitment; and the importance of the commodity (Svensson, 2004); supplier and buyer dependency risk (Hallikas et al., 2005). For a discussion of supplier segmentation approaches, see Rezaei and Ortt (2012) and Day et al., (2010). The fact that different researchers use different criteria to identify supplier segments implies that more than two criteria have to be considered when segmenting suppliers. In other words, the problem of segmentation is in fact a multi-criteria problem. Recently, Rezaei and Ortt (2012), in their literature review regarding supplier segmentation, proposed a framework for classifying the criteria in different supplier segmentation approaches using two overarching dimensions: supplier capabilities and supplier willingness. The proposed framework, which takes both the supplier segmentation variables and the criteria used in supplier selection into account, has the following benefits. It makes it possible to consider multiple criteria, while most existing supplier segmentation methods are based on just two criteria. 94
It provides a logical basis for aggregating different criteria. It gives us an adequate basis for segmenting suppliers in accordance with the common 2×2 matrix. The resulting matrix, however, is much more inclusive than those used by other methods, because the dimensions are based on multiple criteria. Here the supplier segmentation approach used in this paper is described. According to Rezaei and Ortt (2012) supplier segmentation is defined as “the identification of the capabilities and willingness of suppliers by a particular buyer in order for the buyer to engage in a strategic and effective partnership with the suppliers with regard to a set of evolving business functions and activities in the supply chain”. In this definition, there are two dimensions (capabilities and willingness) on the basis of which suppliers can be segmented. Suppliers can be segmented for each function separately, such as purchasing, production, R&D, finance, and marketing and sales. The dimensions, capabilities and willingness, are seen as multi-criteria concepts. For example, the capabilities of a supplier can be evaluated using different criteria such as the quality of the products (Dickson, 1966; Weber et al., 1991; Tan et al., 2002), the technical capability of the supplier in question (Dickson, 1966; Weber et al., 1991; Chio and Hartley, 1996; Swift, 1995), the design capability of the supplier (Chio and Hartley, 1996), etc. Willingness of the supplier can be evaluated using multiple criteria, such as communication openness (Kannan and Tan, 2002; Chio and Hartley, 1996; Smeltzer, 1997) and commitment to continuous improvement in product and process (Kannan and Tan, 2002; Svensson, 2004; Urgal-González, and GarcíaVázquez, 2007). Each buyer may consider different capabilities and willingness criteria to evaluate and segment its suppliers. For a comprehensive sample of the various possible criteria for capabilities and willingness, see Tables 4.1 and 4.2 respectively. As mentioned before, supplier segmentation is a step between supplier selection and supplier relationship management. Consequently, a firm should select the criteria such that there would be a consistency between the aforementioned supplier-related strategic activities. That is to say, for instance the drivers and objectives of engaging in partnership with suppliers (e.g. cost reduction, marketing advantages, customer satisfaction, etc. (Lambert, 2008)), may be used as a helpful guideline for selecting the segmentation criteria. For example if cost reduction is one of the main drivers of the firm to engage in partnership, price may be considered as one of the supplier capabilities criteria. In addition, the requirements of the applied methodology should 95
be taken into account as well. For example when using a version of crisp or fuzzy AHP, it is required to select some independent criteria for each dimension (in section 4.3, some statistical tests are used to ensure the independency of the criteria). Once the criteria selection is done, aggregating the capabilities and willingness criteria yields a twodimensional matrix. This matrix will be an X×Y matrix, due to the possible number of levels for each of the two dimensions. Such a matrix yields XY segments. For example, if two levels (low and high) are chosen for each dimension, the result is a 2×2 matrix that can be used to divide the suppliers into 4 segments. In this paper a methodology is proposed to segment suppliers using multiple criteria. That is a Fuzzy Analytic Hierarchy Process (FAHP), a multi-criteria decision-making (MCDM) method, is applied to obtain the weights of the criteria of each dimension. The paper is organized as follows. In section 4.2, the methodology is presented. In section 4.3 the proposed methodology is applied to a real-world case. Finally, the conclusion and future work are presented in section 4.4. Table 4.1 A list of capabilities criteria (Rezaei and Ortt, 2012) Capabilities criteria Price/cost
References Dickson, 1966; Weber et al., 1991; Kannan and Tan, 2002; Day, 1994; Choi and Hartley, 1996; Swift, 1995; Rezaei and Davoodi, 2011 Profit impact of supplier Chio and Hartley, 1996; van Weele, 2000; Kraljic, 1983 Delivery Dickson, 1966; Weber et al., 1991; Kannan and Tan, 2002; Day, 1994; Choi and Hartley, 1996; Swift, 1995; Tan et al., 2002; Rezaei and Davoodi, 2011 Quality Dickson, 1966; Weber et al., 1991; Tan et al., 2002; Rezaei and Davoodi, 2011 Reserve capacity Kannan and Tan, 2002 Industry knowledge Kannan and Tan, 2002 Production, manufacturing/ Dickson, 1966; Weber et al., 1991; Day, transformation facilities and 1994 capacity Geographic Dickson, 1966; Weber et al., 1991; Kannan location/proximity and Tan, 2002; Swift, 1995 Design capability Chio and Hartley, 1996 96
Technical capability Technology monitoring Management and organization Supplier process capability Reputation and position in industry Financial position
Dickson, 1966; Weber et al., 1991; Chio and Hartley, 1996; Swift, 1995 Day, 1994 Dickson, 1966; Weber et al., 1991
Kannan and Tan, 2002 Dickson, 1966; Weber et al., 1991; Chio and Hartley, 1996; Swift, 1995 Dickson, 1966; Weber et al., 1991; Kannan and Tan, 2002; Day, 1994; Choi and Hartley, 1996; Swift, 1995 Performance awards Chio and Hartley, 1996 Performance history Dickson, 1966; Weber et al., 1991 Cost control Day, 1994 Technology development Day, 1994 Repair service Dickson, 1966; Weber et al., 1991 After sales support Chio and Hartley, 1996 Packaging ability Dickson, 1966; Weber et al., 1991 Reliability of product Chio and Hartley, 1996; Swift, 1995 Operational controls Dickson, 1966; Weber et al., 1991 Training aids Dickson, 1966; Weber et al., 1991 Labor relations record Dickson, 1966; Weber et al., 1991 Impact on energy utilization Swift, 1995 Ease of maintenance design Swift, 1995 Communication system Dickson, 1966; Weber et al., 1991 Desire for business Dickson, 1966; Weber et al., 1991 Human resource Day, 1994 management Amount of past business Dickson, 1966; Weber et al., 1991 Warranties and claims Dickson, 1966; Weber et al., 1991; Swift, 1995 Market sensing Day, 1994 Customer linking Day, 1994 Environmental health and Day, 1994 safety Innovation Spina et al., 2002 Supplier’s order entry and Kannan and Tan, 2002 invoicing system including EDI
97
Table 4.2 A list of willingness criteria (Rezaei and Ortt, 2012) Willingness criteria References Commitment to quality Kannan and Tan, 2002; Svensson, 2004 Honest and frequent Kannan and Tan, 2002; Chio and communications/ Hartley, 1996; Smeltzer, 1997 communication openness Commitment to continuous Kannan and Tan, 2002; Svensson, improvement in product and 2004; Urgal-González, and Garcíaprocess Vázquez, 2007 Relationship closeness Chio and Hartley, 1996; Kaufman et al., 2000 Open to site evaluation Kannan and Tan, 2002 Attitude Dickson, 1966; Weber et al., 1991 Bidding procedural compliance Dickson, 1966; Weber et al., 1991 Reciprocal arrangements Dickson, 1966; Weber et al., 1991; Kaufman et al., 2000 Prior experience with supplier Swift, 1995 Impression Dickson, 1966; Weber et al., 1991 Ethical standards Kannan and Tan, 2002 Willingness to co-design and Spina et al., 2002; Tan et al, 2002 participate in new product development Willingness to integrate supply Kannan and Tan, 2002 chain management relationship Mutual respect and honesty Smeltzer, 1997 Willingness to share Kannan and Tan, 2002; Smeltzer, 1997; information, ideas, technology, Tan et al, 2002 and cost savings Consistency and follow-through Smeltzer, 1997 Supplier’s effort in eliminating Kannan and Tan, 2002 waste Supplier’s effort in promoting Kannan and Tan, 2002 JIT principles Dependency Hallikas et al., 2005; Kaufman et al., 2000 Willingness to invest in specific Urgal-González, and García-Vázquez, equipment 2007 Long term relationship Chio and Hartley, 1996
98
4.2 Proposed methodology In this section, a five-step methodology to supplier segmentation is described. 1. Determine a number of capabilities and willingness criteria or select them from Tables 4.1 and 4.2 respectively (𝐶1𝐶 , 𝐶2𝐶 , … , 𝐶𝐾𝐶 and 𝐶1𝑊 , 𝐶2𝑊 , … , 𝐶𝐽𝑊 ) through screening done by the decision-maker. 2. Determine the weights of the respective capabilities and willingness criteria respectively (𝑤1𝐶 , 𝑤2𝐶 , … , 𝑤𝐾𝐶 and 𝑤1𝑊 , 𝑤2𝑊 , … , 𝑤𝐽𝑊 ) using an MCDM method (in this paper a fuzzy AHP: section 4.2.2). 3. Assign a score to each supplier considering each capabilities 𝐶 𝐶 𝐶 𝐶 criterion (𝑎𝑖1 , 𝑎𝑖2 , … , 𝑎𝑖𝑘 , … , 𝑎𝑖𝐾 ) and willingness criterion 𝑊 𝑊 𝑊 𝑊 𝐶 (𝑎𝑖1 , 𝑎𝑖2 , … , 𝑎𝑖𝑗 , … , 𝑎𝑖𝐽 ) by the decision-maker, where 𝑎𝑖𝑘 is evaluation of supplier i with respect to kth capabilities criterion and 𝑊 𝑎𝑖𝑗 is evaluation of supplier i with respect to jth willingness criterion, and K and J are the number of capabilities criteria and the number of willingness criteria respectively. 4. Determine the final aggregated scores of capabilities and willingness of each supplier as follows. 𝐶 𝐶 𝑆𝑖𝐶 = ∑𝐾 𝑘=1 𝑤𝑘 𝑎𝑖𝑘 , ∀𝑖
(1)
𝑊 𝑆𝑖𝑊 = ∑𝐽𝑗=1 𝑤𝑗𝑊 𝑎𝑖𝑗 , ∀𝑖.
(2)
5. Divide the suppliers based on their final aggregated scores into XY segments, where X and Y are the number of levels considered for capabilities and willingness respectively. For example for a common 2×2 segmentation there would be four segments (types) as follows. 𝛼 𝛽 Type 1: all suppliers with 𝑆𝑖𝐶 < 2 and 𝑆𝑖𝑊 < 2 Type 2: all suppliers with 𝑆𝐶𝑖 < 𝛼
Type 3: all suppliers with 2 ≤ 𝛼
𝛼
2 𝑆𝑖𝐶
𝑆𝑖𝐶
and
𝛽 2
≤ 𝑆𝑖𝑊 ≤ 𝛽
≤ 𝛼 and 𝑆𝑖𝑊 < 𝛽
𝛽
2 𝑊 𝑆𝑖
Type 4: all suppliers with 2 ≤ ≤ 𝛼 and 2 ≤ ≤𝛽 where α and β are the maximum potential values of the supplier’s 𝛼 𝛽 aggregated capabilities and willingness scores respectively. 2 and 2 are the cut-off points (dividing the dimensions to two equal parts Low and High) for supplier’s capabilities and willingness dimensions respectively for a common 2×2 segmentation. It is clear that, depending on the decision-maker’s requirements, it is possible to assign suppliers to more segments than four. For example, 99
when considering three levels (low, medium and high) for the capabilities dimension and two levels (low and high) for the willingness dimension, the resulting number of segments is six. In this case there will be two cut𝛼 2𝛼 off points for capabilities dimension ( 3 and 3 ) and one cut-off point for 𝛽
willingness dimension ( 2 ). To carry out step 2 of the above-mentioned methodology, i.e. to calculate the weights of capabilities and willingness criteria, a multicriteria decision-making method should be applied. AHP, which was first introduced by Saaty (1980), is one of the most commonly used methodologies in this kind of a situation. However, although it is a simple and convenient judgment-based methodology, it is unable to handle the ambiguities that commonly exist in human judgments. Fuzzy set theory introduced by Zadeh (1965) has enriched classic models in its ability to handle impreciseness in human thinking, judgment and decision-making. Applying fuzzy AHP is preferred because it is conceptually closer to human thinking. Fuzzy AHP has been used in several problems of different fields of study from evaluating the knowledge portal development tools (Kreng and Wu, 2007) to matchmaking (Joshi and Kumar, 2012) to behavior-based safety management (Dağdeviren and Yüksel, 2008) to inventory management (Rezaei, 2007) to organizational capital measurement (Bozbura and Beskese, 2007). It has been used in some decision-making problems involving supply chain management, such as supplier selection (Kahraman et al., 2003), global supplier development (Chan and Kumar, 2007), and evaluation of buyer-supplier relationships (Lee, 2009). In the next subsections, some preliminaries materials are introduced and then the fuzzy AHP is discussed as used in step 2 of the proposed methodology. The other steps are relatively straightforward.
4.2.1 Preliminaries Here the definitions of some materials used in the proposed fuzzy AHP are presented. Definition 1. (van Laarhoven and Pedrycz, 1983) Triangular fuzzy number (TFN): A fuzzy number N on ℜ is defined to be a TFN if its membership function 𝜇𝑁 (𝑥): ℜ → [0, 1] be: 𝑥−𝑙 , 𝑙 ≤ 𝑥 ≤ 𝑚, 𝑚−𝑙 𝜇𝑁 (𝑥) = { 𝑢−𝑥 , 𝑚 ≤ 𝑥 ≤ 𝑢, (3) 𝑢−𝑚
0, 100
𝑜𝑡ℎ𝑒𝑟𝑤𝑖𝑠𝑒,
where l, and u are the lower and upper bounds of the support N respectively, m is the modal value and 𝑙 < 𝑚 < 𝑢. This triangular fuzzy number can be noted by the triple (l,m,u). The operational laws of two TFNs 𝑁1 = (𝑙1 , 𝑚1 , 𝑢1 ) and 𝑁2 = (𝑙2 , 𝑚2 , 𝑢2 ) are as follows: Fuzzy number addition ⊕: 𝑁1 ⊕ 𝑁2 = (𝑙1 , 𝑚1 , 𝑢1 ) ⊕ (𝑙2 , 𝑚2 , 𝑢2 ) = (𝑙1 + 𝑙2 , 𝑚1 + 𝑚2 , 𝑢1 + 𝑢2 ) (4) Fuzzy number multiplication ⊗: 𝑁1 ⊗ 𝑁2 = (𝑙1 , 𝑚1 , 𝑢1 ) ⊗ (𝑙2 , 𝑚2 , 𝑢2 ) ≅ (𝑙1 × 𝑙2 , 𝑚1 × 𝑚2 , 𝑢1 × 𝑢2 ) where 𝑙𝑖 , 𝑚𝑖 , 𝑢𝑖 are all positive real numbers. (5) Fuzzy number division ⊘: 𝑁1 ⊘ 𝑁2 = (𝑙1 , 𝑚1 , 𝑢1 ) ⊘ (𝑙2 , 𝑚2 , 𝑢2 ) ≅ (𝑙1 /𝑢2 , 𝑚1 /𝑚2 , 𝑢1 /𝑙2 ) where 𝑙𝑖 , 𝑚𝑖 , 𝑢𝑖 are all positive real numbers. (6) Definition 2. (Herrera-Viedma et al., 2004; Wang and Chen, 2008) Fuzzy preference relations: a fuzzy preference relation P on a set of alternatives 𝐴 = {𝑎1 , 𝑎2 , … , 𝑎𝑛 } is a fuzzy set on the product set A×A with membership function P: A×A→ [0, 1]. The preference relation is represented by the n×n matrix 𝑃 = (𝑝𝑖𝑗 ), where 𝑝𝑖𝑗 = 𝑃(𝑎𝑖 , 𝑎𝑗 ), for all 𝑖, 𝑗 ∊ {1,2, … , 𝑛}. Herein, 𝑝𝑖𝑗 is the preference ratio of alternative 𝑎𝑖 to 𝑎𝑗 : 𝑝𝑖𝑗 = 1/2 means that there is no difference between 𝑎𝑖 and 𝑎𝑗 , 𝑝𝑖𝑗 = 1 indicates that 𝑎𝑖 is absolutely better than 𝑎𝑗 , and 𝑝𝑖𝑗 > 1/2 indicates that 𝑎𝑖 is better than 𝑎𝑗 . In this case, the preference matrix P is generally assumed to be an additive reciprocal of 𝑝𝑖𝑗 + 𝑝𝑗𝑖 = 1, for all 𝑖, 𝑗 ∈ {1,2, … , 𝑛}. Proposition 1. (Wang and Chen, 2008) For a fuzzy reciprocal linguistic preference relation, 𝑃̃ = (𝑝̃𝑖𝑗 ) with 𝑝̃𝑖𝑗 ∈ [0,1], verifies the additive reciprocal, then, the following statements are equivalent. 𝐿 𝑅 𝑝𝑖𝑗 + 𝑝𝑗𝑖 = 1, (7) 𝑀 𝑀 𝑝𝑖𝑗 + 𝑝𝑗𝑖 = 1, (8) 𝑅 𝐿 𝑝𝑖𝑗 + 𝑝𝑗𝑖 = 1. (9) Proposition 2. (Wang and Chen, 2008) For a reciprocal fuzzy linguistic 𝐿 𝑀 𝑅 preference relation 𝑃̃ = (𝑝̃𝑖𝑗 ) = (𝑝𝑖𝑗 , 𝑝𝑖𝑗 , 𝑝𝑖𝑗 ) to be consistent, verifies the additive consistency, then, the following statements must be equivalent: 3 𝐿 𝐿 𝑆 𝑝𝑖𝑗 + 𝑝𝑗𝑘 + 𝑝𝑘𝑖 = 2 ∀𝑖 < 𝑗 < 𝑘, (10) 3
𝑀 𝑀 𝑀 𝑝𝑖𝑗 + 𝑝𝑗𝑘 + 𝑝𝑘𝑖 = 2 ∀𝑖 < 𝑗 < 𝑘,
(11)
3
𝑅 𝑅 𝐿 𝑝𝑖𝑗 + 𝑝𝑗𝑘 + 𝑝𝑘𝑖 = 2 ∀𝑖 < 𝑗 < 𝑘,
𝐿 𝐿 𝐿 𝑅 𝑝𝑖(𝑖+1) + 𝑝(𝑖+1)(𝑖+2) + ⋯ + 𝑝(𝑗−1)𝑗 + 𝑝𝑗𝑖 =
(12) 𝑗−𝑖+1 2
∀𝑖 < 𝑗,
(13) 101
𝑀 𝑀 𝑀 𝑀 𝑝𝑖(𝑖+1) + 𝑝(𝑖+1)(𝑖+2) + ⋯ + 𝑝(𝑗−1)𝑗 + 𝑝𝑗𝑖 = 𝑅 𝑅 𝑅 𝐿 𝑝𝑖(𝑖+1) + 𝑝(𝑖+1)(𝑖+2) + ⋯ + 𝑝(𝑗−1)𝑗 + 𝑝𝑗𝑖 =
𝑗−𝑖+1 2 𝑗−𝑖+1 2
∀𝑖 < 𝑗,
(14)
∀𝑖 < 𝑗.
(15)
4.2.2 Preference relations-based fuzzy AHP In existing literature, there are several types of fuzzy AHP. van Laarhoven and Pedrycz (1983) used triangular fuzzy numbers and Lootsma's logarithmic least square method to derive local fuzzy priorities and, in doing so, presented a fuzzy AHP for the first time. Buckley (1985) used trapezoidal fuzzy numbers and a geometric mean method in his proposed fuzzy AHP. Boender et al. (1989) improved the original work by van Laarhoven and Pedrycz (1983) to obtain more robust results. Chang (1996) used triangular fuzzy numbers for pairwise comparison and the extent analysis method to arrive at a fuzzy AHP. His method is much simpler and has relatively lower computational requirements. The fuzzy AHP proposed by Chang (1996) was then improved by Zhu et al. (1999) and, due to its computational simplicity, has become a popular fuzzy AHP. Recently, however, Wang et al. (2008) have found that the extent analysis method used in the fuzzy AHP proposed by Chang (1996) cannot derive the priorities from a fuzzy or crisp comparison matrix and therefore has resulted in a huge number of misapplications. Mikhailov (2003) derived priorities from fuzzy pairwise comparison judgments based on an α-cut decomposition of the fuzzy judgments into a series of interval comparisons. Apart from advantages and disadvantages of the afore-mentioned works, the most important criticism regarding most of them is their failure to handle inconsistency (Leung and Cao, 2000). Having consistency is crucial because inconsistent comparisons lead to misleading solutions. There are a few articles in the literature that study the inconsistency in fuzzy AHP (see, for example Salo, 1996; Leung and Cao, 2000; Ramik and Korviny, 2010). The topic of fuzzy preference relations has received increasing attention in priority-ranking problems (see, for example, Chiclana et al., 1998, 2001, 2003, Xu, 2004; Xu and Da, 2005). For a robust ranking, it is crucial to have consistent fuzzy preference relations. Herrara-Viedma et al. (2004) presented a characterization of the consistency property based on the additive transitivity property of the fuzzy preference relations. Wang and Chen (2008) incorporated the characterization of the consistency property proposed by Herrara-Viedma et al. (2004) into AHP and proposed a method that leads to consistent priority-ranking from only 102
n-1 pairwise comparisons. Their method has two very important features: (1) it yields consistent priority ranking and (2) it requires fewer pairwise comparisons. This robust method is applied to obtain the weights of capabilities and willingness criteria in this paper as follows: Step 1. Establish the hierarchy Here, a hierarchy is constructed, including the goal and criteria. Step 2. Determine the pair-wise comparison matrices This step includes the construction of comparison matrix 𝑃̃ for the criteria. 𝑝̃11 ⋯ 𝑝̃1𝑛 ̃ ⋱ ⋮ ) 𝑃=( ⋮ (16) 𝑝̃𝑛1 ⋯ 𝑝̃𝑛𝑛 where 𝑝̃𝑖𝑗 is a fuzzy linguistic variable or its equivalent triangular fuzzy number to show the decision-maker's preference of i over j, as indicated in Figure 4.1 and Table 4.3. Table 4.3 Fuzzy linguistic assessment variables Linguistic variables Very poor (VP) Poor (P) Medium poor (MP) Medium (M) Medium good (MG) Good (G) Very good (VG) VP
0.0
Triangular fuzzy numbers (0,0,0.1) (0,0.1,0.3) (0.1,0.3,0.5) (0.3,0.5,0.7) (0.5,0.7,0.9) (0.7,0.9,1) (0.9,1,1)
P
MP
M
0.1
0.3
0.5
MG
0.7
G
VG
0.9
1.0
Figure 4.1 Fuzzy linguistic assessment variables
103
In this step, following Wang and Chen (2008), it is necessary only to fill in n-1 cells of the matrix. The other cells can be obtained using the equations that are derived based on the reciprocity (equations (7)-(9)) and consistency (equations (10)-(15)) properties of a positive additive matrix: Step 3. Construct the fuzzy linguistic preference relation decision matrices for the criteria. If, after calculating the pairwise comparisons, the value of some elements of the aggregated matrices do not have a value between zero and one ( ~ pij [0,1] ) the following transformations should be applied to transform the elements to the interval [0,1], i.e. 𝑓: [−𝑐, 1 + 𝑐] → [0, 1] where c is the maximum amount of violation from interval [0,1] among elements of 𝑃̃. 𝑥 𝐿 +𝑐
𝑓(𝑥 𝐿 ) = 1+2𝑐 , 𝑓(𝑥 𝑀 ) =
𝑥 𝑀 +𝑐
1+2𝑐 𝑥 𝑅 +𝑐
(17) ,
𝑓(𝑥 𝑅 ) = 1+2𝑐 . Step 4. Calculate the weights of the criteria as follows: 𝑔̃𝑖 𝑤 ̃ 𝑖 = 𝑔̃ ⨁…⨁𝑔 , ̃ 1
𝑛
(18) (19) (20)
where 𝑔̃𝑖 is the mean of the comparison values of row i and is calculated as follows. 𝑔̃𝑖 = 𝑛1 [𝑝̃𝑖1 ⨁𝑝̃𝑖2 ⨁ … ⨁𝑝̃𝑖𝑛 ], 𝑖 = 1, … , 𝑛. (21) Using a defuzzification method, like fuzzy mean (FM), the final defuzzied weights are calculated as follows: 𝑤 𝐿 +𝑤 𝑀 +𝑤 𝑅
𝑖 𝑤𝑖 = 𝑖 3𝑖 (22) It has to be mentioned that, to calculate the weights of the criteria and also to defuzzify them, other operators and methods can be used as well (for other operators see Chen and Hwang (1992), and for the defuzzification methods see Leekwijck and Kerre (1999)).
4.3 Case study The proposed methodology was applied to a medium-sized broiler (meattype chicken) company operating in the food industry, which is an important industry with a considerable share in all countries. “Food supply chains operate in a complex, dynamic and time-critical environment” (Bourlakis and Weightman, 2004), where customers have different increasing needs. They demand high quality fresh products at low prices. In addition, the perishability of the food products renders them very time104
critical. It is far from realistic to expect food companies to meet these requirements on their own, which is why they need the help of their suppliers to produce good products with low prices and reliable delivery. Within this framework, managing the suppliers is a critical activity. To do so effectively, food companies need to segment their suppliers in an effective and dynamic way. The company selected for our study buys newly hatched chicks from hatcheries and raises them to market weight in about six weeks. The chickens are then delivered to a processing plant to be stunned and undergo further processing. Finally, the packaged products are transported by refrigerated trucks to the market. The company receives the newly hatched chicks, feed, medications and other required materials from 43 suppliers (newly hatched chicks: 11 suppliers, feed: 9 suppliers, medications: 6 suppliers, and other materials and equipment: 17 suppliers). To segment these suppliers, we gathered the relevant data by interviewing the manager of the company. We first asked the manager to screen the list of capabilities and willingness criteria to select a handful of criteria for each dimension. After careful consideration, the manager selected six criteria for capabilities and six criteria for willingness, as shown in Table 4.4. Table 4.4 Selected capabilities and willingness criteria Selected capabilities criteria Selected willingness criteria Price ( C1C ) Commitment to Quality ( C1W ) Delivery ( C 2C ) Communication Openness ( C 2W ) Quality ( C 3C ) Reciprocal Arrangement ( C 3W ) Reserve Capacity ( C 4C )
Willingness to share information ( C 4W ) Supplier’s effort in promoting JIT principles C Geographical location ( C 5 ) ( C 5W ) Financial Position ( C 6C )
Long term relationship ( C 6W )
We then asked the manager to assign a score between 1 (very low) to 5 (very high) for each criterion as applied to the various suppliers. The score reflects how each supplier is perceived based on the criterion. The resulting six scores for the various criteria are presented in Table 4.5. To check the independency of the criteria of each dimension, and also the independence of the dimensions, the non-parametric correlation 105
(Spearman's ρ)1 (Spearman, 1910) was calculated. Of all the bivariate correlations for capabilities and willingness criteria, none of them is high or very high. The average ρ for capabilities and willingness criteria are 0.216 and 0.456 respectively which on average show weak correlations between the criteria implying they are highly independent. To check the independence of the two aggregated dimensions, the discriminant validity was tested. That is to say, Spearman's correlation was calculated and corrected for attenuation effects due to measurement error. Schmidt and Hunter’s (1996) formula (𝜌̂𝑥𝑦 = 𝑟𝑥𝑦 ⁄√𝑟𝑥𝑥 𝑟𝑦𝑦 ) was used, where 𝑟𝑥𝑦 is the correlation between the two scales (here two dimensions capabilities and willingness), and 𝑟𝑥𝑥 and 𝑟𝑦𝑦 are the reliability of the two scales. 𝑟𝑥𝑦 , 𝑟𝑥𝑥 and 𝑟𝑦𝑦 found as 0.220, 0.657, and 0.866 respectively. Hence, 𝜌̂𝑥𝑦 or the corrected correlation between capabilities and willingness is 0.292 which shows a high discriminant validity. We also asked the manager to conduct a pairwise comparison with regard to the different criteria. As mentioned in the explanation of the fuzzy AHP methodology, it is enough to have only n-1 comparisons elements for each matrix, which is why the manager was asked to fill in n1 cells of each matrix using the fuzzy linguistic assessment variables (see Table 4.3 and Figure 4.1 for these variables). The completed matrices for the required cells are shown in Table 4.6 (capabilities) and Table 4.7 (willingness). Table 4.5 Capabilities and willingness measures of the suppliers Supplier No. 1 2 3 4 5 6 7 8 1
C C C W W W C1C C 2C C 3 C 4C C 5 C 6 C1W C 2W C 3 C 4W C 5 C 6
3 4 4 4 4 3 3 4
4 4 4 5 4 5 5 5
3 5 5 5 4 3 3 3
3 3 3 3 4 3 4 4
1 4 3 3 2 2 5 5
4 2 3 3 2 3 3 4
4 5 4 5 3 4 4 2
3 5 4 4 4 3 4 2
4 3 3 4 3 3 3 2
4 5 5 4 4 4 4 2
4 4 3 5 5 5 5 3
5 4 4 4 4 4 2 2
Spearman's correlation or Spearman's rank correlation ρ, is a non-parametric measure of statistical dependence between two variables. It takes a value in range [-1, 1]. The greater the absolute value of ρ, the more dependence between the two variables and vice versa (|𝜌| < 0.3: little; 0.3 ≤ |𝜌| < 0.5: low; 0.5 ≤ |𝜌| < 0.7: moderate; 0.7 ≤ |𝜌| < 0.9: high; 0.9 ≤ |𝜌| ≤ 1.0: very high). For further information the reader may refer to Spearman (1910), or a basic statistics textbook.
106
9 10 11 12 13 14 15 16 17 18 19 20 21 22 23 24 25 26 27 28 29 30 31 32 33 34 35 36 37 38 39 40 41 42 43
3 3 3 3 4 3 3 3 3 2 3 4 3 3 3 2 3 4 3 3 3 1 3 1 3 4 3 3 4 3 3 4 3 4 2
2 2 4 5 5 4 3 1 1 1 4 3 3 5 4 1 3 3 4 4 4 4 4 5 4 5 4 3 5 5 4 5 4 3 2
4 4 4 3 4 3 4 4 3 3 4 4 1 4 3 3 4 4 4 5 3 3 4 5 3 4 5 4 5 4 3 4 3 5 5
1 1 3 2 4 3 4 4 1 1 3 4 2 2 4 5 4 3 4 4 3 1 3 3 2 4 3 3 3 4 3 3 3 3 1
1 1 3 5 3 3 3 1 5 3 5 1 2 4 5 1 2 2 3 3 3 1 2 4 4 3 2 3 4 2 3 2 3 3 1
1 1 3 3 3 1 3 1 1 1 3 3 3 3 3 1 3 3 3 4 2 2 3 3 3 2 3 3 3 2 3 3 3 4 2
3 3 4 4 3 3 3 3 4 4 4 4 2 3 4 3 4 5 4 4 3 4 5 4 5 2 4 4 4 3 3 4 4 3 4
2 2 4 4 4 4 2 3 5 5 2 3 1 4 4 4 4 5 4 3 3 3 4 5 4 2 4 3 5 3 2 5 3 4 5
2 2 5 4 3 3 2 3 4 4 2 3 2 4 4 4 3 4 4 4 4 3 3 4 4 3 4 4 4 4 2 4 4 3 5
2 2 5 5 5 4 4 4 4 3 2 3 2 4 5 4 3 3 4 4 4 3 4 4 4 2 5 4 4 3 2 4 4 4 5
2 2 5 5 5 3 5 4 5 4 1 3 3 5 4 4 4 4 3 3 4 5 3 4 4 1 4 4 4 4 3 4 3 5 3
2 2 4 5 5 4 3 3 4 4 2 3 2 4 4 3 3 4 3 3 3 3 3 3 4 3 4 3 4 4 3 3 3 4 4
107
Table 4.6 Fuzzy pairwise comparison of capabilities criteria
Capabilities C1C C 2C C 3C
C C C
C1C
C 2C
C 3C
C 4C
C 5C
C 6C
VP
× P
× ×
× ×
× ×
G
× M
× ×
C 4 C 5 C 6
P
Table 4.7 Fuzzy pairwise comparison of willingness criteria
Willingness C1W C 2W C 3W
C C C
C1W
C 2W
C 3W
C 4W
C 5W
C 6W
G
× M
× ×
× ×
× ×
M
× P
× ×
W 4 W 5 W 6
VG
Converting the filled cells of Tables 4.6 and 4.7 to their corresponding fuzzy numbers and according to equations (7)-(15), the completed comparison matrices can be obtained as indicated in Tables 4.8 and 4.9 respectively. Table 4.8 Fuzzy linguistic preference relation decision matrix of capabilities criteria Capabilities
C1C C 2C C 3C C C
C 4 C 5
C
C 6
108
C1C
C 2C
C 3C
C 4C
C 5C
C 6C
(0.5,0.5,0.5)
(0.0,0.0,0.1)
(-0.5,-0.4,-0.1)
(-0.3,0.0,0.4)
(-0.5,0.0,0.6)
(-1.0,-0.4,0.4)
(0.9,1.0,1.0)
(0.5,0.5,0.5)
(0.0,0.1,0.3)
(0.2,0.5,0.8)
(0.0,0.5,1.0)
(-0.5,0.1,0.8)
(1.1,1.4,1.5)
(0.7,0.9,1.0)
(0.5,0.5,0.5)
(0.7,0.9,1.0)
(0.5,0.9,1.2)
(0.0,0.5,1.0)
(0.6,1.0,1.3)
(0.2,0.5,0.8)
(0.0,0.1,0.3)
(0.5,0.5,0.5)
(0.3,0.5,0.7)
(-0.2,0.1,0.5)
(0.4,1.0,1.5)
(0.0,0.5,1.0)
(-0.2,0.1,0.5)
(0.3,0.5,0.7)
(0.5,0.5,0.5)
(0.0,0.1,0.3)
(0.6,1.4,2.0)
(0.2,0.9,1.5)
(0.0,0.5,1.0)
(0.5,0.9,1.2)
(0.7,0.9,1.0)
(0.5,0.5,0.5)
Table 4.9 Fuzzy linguistic preference relation decision matrix of willingness criteria
C1W
C 2W
C 3W
C 4W
C 5W
C 6W
(0.5,0.5,0.5)
(0.7,0.9,1.0)
(0.5,0.9,1.2)
(0.3,0.9,1.4)
(-0.2,0.5,1.2)
(0.2,1.0,1.7)
(0.0,0.1,0.3)
(0.5,0.5,0.5)
(0.3,0.5,0.7)
(0.1,0.5,0.9)
(-0.4,0.1,0.7)
(0.0,0.6,1.2)
(-0.2,0.1,0.5)
(0.3,0.5,0.7)
(0.5,0.5,0.5)
(0.3,0.5,0.7)
(-0.2,0.1,0.5)
(0.2,0.6,1.0)
(-0.4,0.1,0.7)
(0.1,0.5,0.9)
(0.3,0.5,0.7)
(0.5,0.5,0.5)
(0.0,0.1,0.3)
(0.4,0.6,0.8)
(-0.2,0.5,1.2)
(0.3,0.9,1.4)
(0.5,0.9,1.2)
(0.7,0.9,1.0)
(0.5,0.5,0.5)
(0.9,1.0,1.0)
(-0.7,0.0,0.8)
(-0.2,0.4,1.0)
(0.0,0.4,0.8)
(0.2,0.4,0.6)
(0.0,0.0,0.1)
(0.5,0.5,0.5)
Willingness
C1W C 2W C 3W C 4W C 5W C
W 6
As it can be seen from Tables 4.8 and 4.9, some elements fall outside the interval [0, 1]. Therefore equations (17)-(19) were used to transfer the elements to be included in interval [0, 1], the results of which are shown in Tables 4.10 and 4.11, respectively. Please note that the transforming process has a relative effect on other elements. Table 4.10 Transforming results of the six capabilities criteria matrix from Table 4.8 Capabilities
C1C C 2C C 3C C C
C 4 C 5
C
C 6
C1C
C 2C
C 3C
C 4C
C 5C
C 6C
(0.5,0.5,0.5)
(0.33,0.33,0.37)
(0.17,0.2,0.3)
(0.23,0.33,0.47)
(0.17,0.33,0.53)
(0.0,0.2,0.47)
(0.63,0.67,0.67)
(0.5,0.5,0.5)
(0.33,0.37,0.43)
(0.4,0.5,0.6)
(0.33,0.5,0.67)
(0.17,0.37,0.6)
(0.7,0.8,0.83)
(0.57,0.63,0.67)
(0.5,0.5,0.5)
(0.57,0.63,0.67)
(0.5,0.63,0.73)
(0.33,0.5,0.67)
(0.53,0.67,0.77)
(0.4,0.5,0.6)
(0.33,0.37,0.43)
(0.5,0.5,0.5)
(0.43,0.5,0.57)
(0.27,0.37,0.5)
(0.47,0.67,0.83)
(0.33,0.5,0.67)
(0.27,0.37,0.5)
(0.43,0.5,0.57)
(0.5,0.5,0.5)
(0.33,0.37,0.43)
(0.53,0.8,1.0)
(0.4,0.63,0.83)
(0.33,0.5,0.67)
(0.5,0.63,0.73)
(0.57,0.63,0.67)
(0.5,0.5,0.5)
Table 4.11 Transforming results of the six willingness criteria matrix from Table 4.9 Willingness
C1W C 2W C 3W C C C
W 4 W 5 W 6
C1W
C 2W
C 3W
C 4W
C 5W
C 6W
(0.5,0.5,0.5)
(0.58,0.67,0.71)
(0.5,0.67,0.79)
(0.42,0.67,0.88)
(0.21,0.5,0.79)
(0.38,0.71,1.0)
(0.29,0.33,0.42)
(0.5,0.5,0.5)
(0.42,0.5,0.58)
(0.33,0.5,0.67)
(0.13,0.33,0.58)
(0.29,0.54,0.79)
(0.21,0.33,0.5)
(0.42,0.5,0.58)
(0.5,0.5,0.5)
(0.42,0.5,0.58)
(0.21,0.33,0.5)
(0.38,0.54,0.71)
(0.13,0.33,0.58)
(0.33,0.5,0.67)
(0.42,0.5,0.58)
(0.5,0.5,0.5)
(0.29,0.33,0.42)
(0.46,0.54,0.63)
(0.21,0.5,0.79)
(0.42,0.67,0.88)
(0.5,0.67,0.79)
(0.58,0.67,0.71)
(0.5,0.5,0.5)
(0.67,0.71,0.71)
(0.0,0.29,0.63)
(0.21,0.46,0.71)
(0.29,0.46,0.63)
(0.38,0.46,0.54)
(0.29,0.29,0.33)
(0.5,0.5,0.5)
109
Applying (20) and (21) we are able to calculate the final weights of the various criteria that are defuzzified using (22) to arrive at the defuzzified weights (see Table 4.12 and Figures 4.2 and 4.3). This is the final result of the fuzzy AHP. Table 4.12 Capabilities and willingness criteria weights Capabiliti es criteria
C1C C
C 2
C 3C
C 4C C 5C C 6C
Fuzzy weight (0.065, 0.106,0.181) (0.11, 0.161, 0.238) (0.148, 0.206, 0.279) (0.115, 0.161, 0.231) (0.109, 0.161, 0.24) (0.132, 0.206, 0.302)
Defuzzifie d weight
Willingnes s criteria
0,1116
C1W
0,1617
C
W 2
0,2007
C 3W
0,1610
C 4W
0,1619
C 5W
0,2030
C 6W
Fuzzy weight (0.114, 0.206, 0.35) (0.086, 0.15, 0.266) (0.094, 0.15, 0.253) (0.094, 0.15, 0.253) (0.127, 0.206, 0.328) (0.074, 0.137, 0.25)
Defuzzifie d weight 0.2038 0.1528 0.1512 0.1512 0.2010 0.1399
0,25 0,203
0,201 0,20 0,162
0,161
0,162
Reserve Capacity
Geografical location
0,15 0,112 0,10 0,05 0,00 Price
Delivery
Quality
Figure 4.2 Defuzzified weight of capabilities criteria
110
Financial Position
0,25 0,204
0,201
0,20 0,153
0,151
0,151
0,140
0,15 0,10 0,05 0,00 Com. to Quality
Comm. Receip. Share Openness Arrangement information
JIT principles
Long-term relationship
Figure 4.3 Defuzzified weight of willingness criteria
Using the criteria weights, we can calculate the aggregated scores for the capabilities and willingness of each supplier using (1) and (2) (see Table 4.13). Table 4.13 Aggregated scores for suppliers' capabilities and willingness Supplier No. 1 2 3 4 5 6 7 8 9 10 11 12 13 14 15 16 17 18 19 20
Aggregated capabilities 3.194 3.817 3.86 4.03 3.435 3.321 4 4.33 2.087 2.087 3.532 3.662 3.988 2.894 3.531 2.425 2.387 1.929 3.872 3.308
Aggregated willingness 4.37 4.775 4.164 4.828 4.216 4.271 4.132 2.412 2.415 2.415 4.936 4.924 4.535 3.775 3.561 3.674 4.772 4.386 2.418 3.512
111
21 22 23 24 25 26 27 28 29 30 31 32 33 34 35 36 37 38 39 40 41 42 43
2.39 3.703 3.83 2.266 3.361 3.309 3.701 4.125 3.108 2.195 3.362 3.848 3.322 3.775 3.572 3.362 4.2 3.487 3.321 3.649 3.321 3.903 2.394
2.245 4.381 4.55 4.008 3.899 4.609 4.011 3.843 3.84 3.952 4.068 4.398 4.608 2.291 4.55 4.063 4.552 3.828 2.789 4.398 3.843 4.216 4.663
Now, in line with the final step of the proposed methodology (step 5), we are able to divide the suppliers into four segments, which can be seen in Figure 4.4 and Table 4.14. All the computations have been done using Microsoft Excel's Solver (Microsoft, 2007). Other optimization softwares may be used as well (e.g. MATLAB (MathWorks, 2010), LINGO (LINDO, 2012), etc.). Table 4.14 Segments of the suppliers Segments Type 1 Type 2 Type 3 Type 4
112
No. of supplier 3 6 3 31
Supplier No. 9, 10, 21 16, 17, 18, 24, 30, 43 8, 19, 34 1, 2, 3, 4, 5, 6, 7, 11, 12, 13, 14, 15, 20, 22, 23, 25, 26, 27, 28, 29, 31, 32, 33, 35, 36, 37, 38, 39, 40, 41, 42
Willingness
0
Type 2
Type 4
Type 1
Type 3
1
2 3 Capabilities
4
5
Figure 4.4 Segments of the suppliers As can be seen, three suppliers are assigned to Type 1 (low capabilities and low willingness); six suppliers are assigned to Type 2 (low capabilities and high willingness); three suppliers are assigned to Type 3 (high capabilities and low willingness); while the highest number of suppliers (31) are assigned to Type 4 (high capabilities and high willingness). This means that the broiler company has 31 good suppliers. Twelve suppliers are lacking in capabilities, willingness or both. Upon closer inspection, Figure 4.4 indicates that all suppliers are in or around the upper right quadrant. Type 1. These suppliers are the worst suppliers as they have low capabilities and at the same time a low willingness to work with the buyer. In general, buyers may be advised to replace these suppliers. In the interview with the manager of the broiler company, we identified these suppliers. The suppliers were two newly hatched chicks producers and one medication provider. We discussed why they became suppliers and what the manager should do after identifying their lack of capabilities and willingness. The manager indicated that replacing the two newly hatched 113
chicks producers is not rational, as the firm is working with them only when demand is high and finding better suppliers in the high-demand season is not easy. However, the medication provider is replaceable. Type 2. These suppliers have low capabilities but a high willingness to work with the buyer. These suppliers may benefit more from the relationship than the buyer. The buyer may help these suppliers improve their capabilities. In the interview, we identified these suppliers. Again, most of them newly hatched chicks producers (three out of six); two of them were feed suppliers and one of them supplied materials and equipment. Fortunately, there is a high level of willingness among these suppliers to cooperate with the firm, which makes it worthwhile to invest in their development. The firm could help these suppliers improve their capabilities by forming cross-functional teams to identify and solve problems, which is in fact part of a total quality management (TQM) system (Hackman and Wageman, 1995). In addition, as the main concern regarding newly hatched chicks is making sure about selling the chicks on time, the firm can also reduce its supply base, which is defined as the process of and activities related to reducing the number of suppliers (Ogden, 2006). For example, the firm can terminate its relationship with the newly hatched chick’s producer of Type 1 and increase its purchasing volume with Type 2 suppliers, which will also address its concern regarding the shortage during high demand seasons. Type 3. These suppliers have high capabilities but a low level willingness to cooperate with the buyer. Here, it is more likely that the suppliers do not benefit, or that the relationship is not important enough for them to enter into a close relationship with the buyer. In these cases, the buyer should find the causes behind the behavior of the suppliers and tighten the relationship, as these suppliers are worth keeping on board. In the interview, the suppliers were identified as one newly hatched chicks’ producer, one feed supplier and one material and equipment supplier. The willingness of these suppliers can be improved by establishing a partnership: “A partnership is a tailored business relationship based on mutual trust, openness, shared risk and shared rewards that results in business performance greater than would be achieved by the two firms working together in the absence of partnership” (Lambert, 2008). This could move these suppliers to the best quadrant (Type 4). Type 4: These are the best suppliers: they have high capabilities and a high level of willingness. The buyer can benefit from working with these suppliers. In our case, for example, the buyer can benefit from the suppliers’ capabilities in terms of low prices, good delivery, high quality, etc. In addition, the suppliers also benefit from the relationship with the 114
buyer, which means the relationship is more likely to be a partnership. Of the 31 suppliers in this segment, five are newly hatched chicks producers, five are medication suppliers, six are feed suppliers and 15 are material and equipment suppliers. The firm should try to maintain the relationship with these suppliers, for example by realizing a significant level of operational integration (Lambert, 2008) and improving interorganizational communication, which is necessary for circulating and sharing mutually beneficial information and knowledge, which in turn will create synergy by combining resources and capabilities to develop a lasting strategic advantage (Paulraj et al., 2008).
4.4 Conclusion In this paper, a fuzzy relations-based AHP was applied to supplier segmentation. Scientifically, the application of fuzzy-based AHP to these types of problems is highly relevant. In general, methods based on fuzzy sets theory seem to be a perfect fit to the inherent complexity and fuzziness of constructs in the management sciences where “boundaries are not sharply defined” (Bellman and Zadeh, 1970). In management sciences, many constructs are assessed for managers to help them in their decisionmaking. Supplier evaluation and segmentation represent a typical example of such constructs. The assessment and segmentation of suppliers by a potential buyer requires many criteria that are combined in a complex and fuzzy way. The AHP method uses a strict hierarchy to evaluate and classify alternatives (in our case suppliers), and thereby captures the complexity of the phenomenon of supplier evaluation, while neglecting the inherent fuzziness of human evaluations in these type of problems. Fuzzy AHP captures both the complexity and fuzziness of this phenomenon. To our knowledge, this is the first formulation of the supplier segmentation problem as a multi-criteria problem. We have looked at two overarching dimensions: capabilities and willingness of suppliers. These two dimensions cover the relevant criteria each specific buyer may consider for its own purposes. The proposed fuzzy AHP was used to determine the relative weights of the criteria and, finally, two aggregated scores were calculated for capabilities and willingness for each supplier. A scatter plot was used to display the position of each supplier in terms of its capabilities and willingness, where the horizontal and vertical axis indicates the capabilities and willingness dimensions respectively. By dividing each axis into two equal parts, four segments of suppliers are formed. The buyer should devise different strategies to handle suppliers in each segment. The proposed methodology was applied to segment the 115
suppliers of a broiler company considering six criteria for capabilities and six criteria for willingness. The result is the positioning of each supplier into a segment. In contrast to almost all the previous supplier segmentation approaches that place a supplier into a segment, applying the proposed methodology the buyer is also able to see the position of each supplier within a segment. Furthermore, as the final aggregated capabilities and willingness scores for each supplier are obtained in a continuous spectrum, the proposed methodology is able to segment the supplier to more than four segments. This decision mainly depends on the number of suppliers and the ability and desire of the firm to implement different strategies for different suppliers. The relevance of our analysis for managers is considerable. The analysis revealed that some suppliers lacked in capabilities and or willingness. Due to the complexity of the supplier assessment (six criteria for two dimensions, capabilities and willingness, were proposed by the manager of the broiler company to assess his suppliers), a completely intuitive evaluation is almost certainly bound to be inadequate for handling the problem. The fuzziness of evaluating the criteria could be addressed using fuzzy AHP rather than standard AHP. It was interesting to see how the results of our analysis in a qualitative evaluation during an interview helped the manager clarify, adapt and specify his implicit strategy of supplier evaluation and segmentation. An advantage of fuzzy methodologies is that they are easy to apply when limited data (number of cases) are available. Furthermore, the evaluation task in fuzzy approaches seems to match the type of evaluation that managers use in practice more closely and the results are easier to interpret and use in practice by these managers. While multi-criteria decision-making (MCDM) methods have been applied to a variety of supply chain management (SCM) problems, such as supplier selection, supplier improvement and buyer-supplier relationship, it is surprising to note that supplier segmentation literature has not benefitted from these decision-making methodologies. We therefore suggest applying other MCDM methods (e.g TOPSIS (Hwang and Yoon, 1981), fuzzy TOPSIS (Chen, 2000), PROMETHEE (Brans et al., 1986)) to handle this strategic decision-making problem that faces almost all firms operating in SCM frameworks. The clustering techniques are also suggested for future research (to see a comprehensive list of clustering techniques one may refer to Jain et al., 1999). Doing so, the performance of different methods can be compared, and expectantly the suitability of each particular method for different situations may be found. We also suggest applying the proposed framework and methodology to segment 116
other partners in SCM framework, such as Research and Development (R&D) partners, etc.
4.5 References Bellman, R.E., Zadeh, L.A., 1970. Decision-Making in a Fuzzy Environment. Management Science 17(4), B-141-B-164. Bensaou, B.M., 1999. Portfolios of buyer-supplier relationships. Sloan Management Review 40(4), 35-44. Boender, C.G.E., de Graan, J.G., Lootsma, F.A., 1989. Multicriteria decision analysis with fuzzy pairwise comparisons. Fuzzy Sets and Systems 29(2), 133-143. Bourlakis M.A., Weightman, P.W.H., 2004. Food Supply Chain Management, Blackwell Publishing, Oxford, UK. Bozbura, F.T., Beskese, A., 2007. Prioritization of organizational capital measurement indicators using fuzzy AHP. International Journal of Approximate Reasoning 44(2), 124-147. Brans, J.P., Vincke, P., Mareschal, B., 1986. How to select and how to rank projects: The Promethee method. European Journal of Operational Research 24(2), 228-238. Buckley, J.J., 1985. Fuzzy hierarchical analysis. Fuzzy Sets and Systems 17(3), 33-247. Chan, F.T.S., Kumar, N., 2007. Global supplier development considering risk factors using fuzzy extended AHP-based approach. Omega 35(4), 417-431. Chang, D.Y., 1996. Application of the extent analysis method on fuzzy AHP. European Journal of Operational Research 95(3), 649-655. Chen S.J., Hwang C.L., 1992. Fuzzy multiple attribute decision making: methods and applications. Springer, New York, NY. Chen, C.T. 2000. Extensions of the TOPSIS for group decision-making under fuzzy environment. Fuzzy Sets and Systems 114(1), 1-9. Chiclana, F., Herrera, F., Herrera-Viedma, E., 1998. Integrating three representation models in fuzzy multipurpose decision making based on fuzzy preference relations. Fuzzy Sets and Systems 97(1), 33-48. Chiclana, F., Herrera, F., Herrera-Viedma, E., 2001. Integrating multiplicative preference relations in a multipurpose decision-making model based on fuzzy preference relations. Fuzzy Sets and Systems 122(2), 277-291. Chiclana, F., Herrera, F., Herrera-Viedma, E., Martinez, L., 2003. A note on the reciprocity in the aggregation of fuzzy preference relations using OWA operators. Fuzzy Sets and Systems 137(1), 71-83. 117
Choi, T.Y., Hartley, J.L., 1996. An exploration of supplier selection practices across supply chain. Journal of Operations Management 14(4), 333-343. Dağdeviren, M., Yüksel, İ., 2008. Developing a fuzzy analytic hierarchy process (AHP) model for behavior-based safety management. Information Sciences 178(6), 1717-1733. Day, G.S., 1994. The capabilities of market-driven organizations. The Journal of Marketing 58(4), 37-52. Day, M., Magnan, G.M., Moeller, M.M., 2010. Evaluating the bases of supplier segmentation: A review and taxonomy. Industrial Marketing Management 39(4), 625-639. Dickson, G.W., 1966. An analysis of vendor selection systems and decisions. Journal of Purchasing 2(1), 5-17. Dyer, J.H., Cho, D.S., Chu, W., 1998. Strategic supplier segmentation: the next ‘best practice’ in supply chain management. California Management Review 40(2), 57-77. Hackman, R.R., Wageman, R., 1995. Total Quality Management: Empirical, Conceptual, and Practical Issues. Administrative Science Quarterly 40(2), 309-342. Hallikas, J., Puumalainen, K., Vesterinen, T. Virolainen, V-M., 2005. Risk based classification of supplier relationships. Journal of Purchasing & Supply Management 11(2-3), 72-82. Herrera-Viedma, E., Herrera, F., Chiclana, F., Luque, M., 2004. Some issues on consistency of fuzzy preference relations. European Journal of Operational Research 154(1), 98-109. Hwang, C.L., Yoon, K., 1981. Multiple attribute decision making: methods and applications: a state-of-the-art survey, Springer-Verlag, Berlin; New York. Jain, A.K., Murty, M.N., Flynn, P.J., 1999. Data clustering: a review. ACM Computing Surveys 31(3), 264-323. Joshi, K., Kumar, S., 2012. Matchmaking using Fuzzy Analytical Hierarchy Process, Compatibility Measure and Stable Matching for Online Matrimony in India. Journal of Multi-Criteria Decision Analysis 19(1-2), 57-66. Kahraman, C., Cebeci, U., Ulukan, Z., 2003. Multi-criteria supplier selection using fuzzy AHP. Logistics Information Management 16(6), 382-394. Kannan, V.R., Tan, K.C., 2002. Supplier selection and assessment: their impact on business performance. The Journal of Supply Chain Management 38(4), 11-21. 118
Kaufman, A., Wood, C.H. Theyel, G., 2000. Collaboration and technology linkages: a strategic supplier typology. Strategic Management Journal 21(6), 649-663. Kraljic, P., 1983. Purchasing must become supply management. Harvard Business Review (September/October), 109-117. Kreng, V. B., Wu, C.Y., 2007. Evaluation of knowledge portal development tools using a fuzzy AHP approach: The case of Taiwanese stone industry. European Journal of Operational Research 176(3), 1795-1810. Lambert, D.M. (editor), 2008. Supply chain management: Process, partnership, performance. 3rd edition, Supply chain management institute, Sarasota, Florida. Lee, A. H.I., 2009. A fuzzy AHP evaluation model for buyer–supplier relationships with the consideration of benefits, opportunities, costs and risks. International Journal of Production Research 47(15), 42554280. Leekwijck, W.V., Kerre, E.E., 1999. Defuzzification: criteria and classification. Fuzzy Sets and Systems 108(2), 159-178. Leung, L.C., Cao, D., 2000. On consistency and ranking of alternatives in fuzzy AHP. European Journal of Operational Research 124(1), 102113. LINDO, 2012. LINGO 13, LINDO Systems Inc. Chicago, IL. MathWorks, 2010. MATLAB 7.9.1 (R2009bSP1), the language of technical computing. The MathWorks, Inc. Natick, Massachusetts. Microsoft, 2007. Microsoft Excel’s Solver 2007, Microsoft Corporation, Redmond, Washington. Mikhailov, L., 2003. Deriving priorities from fuzzy pairwise comparison judgements. Fuzzy Sets and Systems 134(3), 365-385. Ogden, J.A., 2006. Supply Base Reduction: An Empirical Study of Critical Success Factors. Journal of Supply Chain Management 42(4), 29-39. Olsen, R.F., Ellram, L.M., 1997. A portfolio approach to supplier relationships. Industrial Marketing Management 26(2), 101-13. Parasuraman, A., 1980. Vendor segmentation: An additional level of market segmentation. Industrial Marketing Management 9(1), 59-62. Paulraj, A., Lado, A.A., Chen, I.J., 2008. Inter-organizational communication as a relational competency: Antecedents and performance outcomes in collaborative buyer-supplier relationships. Journal of Operations Management 26(1), 45-64.
119
Ramik, J., Korviny, P., 2010. Inconsistency of pair-wise comparison matrix with fuzzy elements based on geometric mean. Fuzzy Sets and Systems 161(11), 1604-1613 Rezaei, J., 2007. A fuzzy model for multi-criteria inventory classification, In: Proceedings of the 6th international conference on analysis of manufacturing systems (AMS 2007) 11–16 May. Lunteren: The Netherlands, pp. 167-172. Rezaei, J., Davoodi, M., 2011. Multi-objective models for lot-sizing with supplier selection. International Journal of Production Economics 130(1), 77-86. Rezaei, J., Ortt, R., 2012. A multi-variable approach to supplier segmentation. International Journal of Production Research 50(16), 4593-4611. Saaty, T.L., 1980. The Analytic Hierarchy Process, McGraw-Hill, New York. Salo, A.A., 1996. On fuzzy ratio comparisons in hierarchical decision models. Fuzzy Sets and Systems 84(1), 21-32. Schmidt, F.L., Hunter, J.E., 1996. Measurement error in psychological research: Lessons from 26 research scenarios. Psychological Methods 1(2), 199-223. Smeltzer, L.R., 1997. The meaning and origin of trust in buyer-supplier relationships. International Journal of Purchasing and Materials Management 33(1), 40-48. Spearman, C., 1910. Correlation calculated from faulty data. British Journal of Psychology, 1904-1920 3(3), 271-295. Spina, G., Verganti, R., Zotteri, G., 2002. Factors influencing co-design adoption: drivers and internal consistency. International Journal of Operations & Production Management 22(12), 1354-1366. Svensson, G., 2004. Supplier segmentation in the automotive industry: A dyadic approach of a managerial model. International Journal of Physical Distribution & Logistics Management 34(1), 12-38. Swift, C.O., 1995. Preferences for single sourcing and supplier selection criteria. Journal of Business Research 32(2), 105-111. Tan, K.C., Lyman, S.B., Wisner, J.D., 2002. Supply chain management: a strategic perspective. International Journal of Operations & Production Management 22(6), 614-631. Urgal-González, B., García-Vázquez, J.M., 2007. The strategic influence of structural manufacturing decisions. International Journal of Operations & Production Management 27(6), 605-626. van Laarhoven, P.J.M., Pedrycz, W., 1983. A fuzzy extension of Saaty's priority theory. Fuzzy Sets and Systems 11(1-3), 229-241. 120
van Weele, A.J., 2000. Purchasing and Supply Chain Management, Business Press, Thomson Learning, London. Wang, T-C., Chen, Y-H., 2008. Applying fuzzy linguistic preference relations to the improvement of consistency of fuzzy AHP. Information Sciences 178(19), 3755-3765. Wang, Y.M., Luo, Y., Hua, Z., 2008. On the extent analysis method for fuzzy AHP and its applications. European Journal of Operational Research 186(2), 735-747. Weber, C.A., Current, J.R., Benton, W.C., 1991. Vendor selection criteria and methods. European Journal of Operational Research 50(1), 2-18. Xu, Z., 2004. A method based on linguistic aggregation operators for group decision making with linguistic preference relations. Information Sciences 166(1-4), 19-30. Xu, Z., Da, Q., 2005. A least deviation method to obtain a priority vector of a fuzzy preference relation. European Journal of Operational Research 164(1), 206-216 Zadeh, L.A., 1965. Fuzzy sets. Information and Control 8(3), 338-353. Zhu, K.J., Jing, Y., Chang, D.Y., 1999. A discussion on Extent Analysis Method and applications of fuzzy AHP. European Journal of Operational Research 116(2), 450-456.
121
122
5 Supply Chain Partnership: A Functional Perspective1 Abstract – Supply chain partnership is a central concept in supply chain management (SCM). In this paper, we look at the supply chain partnership from two perspectives: organizational and functional. The organizational perspective assumes that partnerships are formed by organizations as a whole while the functional perspective claims that partnerships are formed by business functions, such as marketing or R&D, within organizations. To evaluate these two perspectives, we conducted a survey among hightech small-to-medium-sized enterprises (SMEs). The survey contained items reflecting several aspects of cooperation, such as information sharing, trust and commitment, and these items were assessed for each function separately. We used confirmatory factor analysis (CFA) to evaluate the fitness of a functional and organizational model. The results of CFA show a better fitness of the functional model, meaning that collaboration between organizations is reflected in functional rather than organization-wide aspects. We then studied the relationship between the functional model and the overall performance of the firm. The results indicate a significant relationship between partnerships in research and development (R&D) and the overall performance of the firm. We believe these results provide a new opportunity for both scientists and practitioners to increase their understanding of partnerships within supply chain management. Keywords: Supply Chain Management (SCM); Supply Chain Partnership; Survey methods; Confirmatory Factor Analysis; Regression Analysis
5.1
Introduction
Even more than larger firms, high tech SMEs need to access external sources of skills and technological knowledge in order to build their own innovative capability and to reach their markets (Lambert and Schwieterman 2012; So and Sun 2010). They can only partly secure such access through markets for goods, services, IPRs and human resources, and must also engage in partnerships; particularly those that nurture the tacit knowledge and other non-tradable competencies that are critical for 1
This chapter is based on: Rezaei, J., Ortt, R., and Trott, P., Supply Chain Partnership: A Functional Perspective. Submitted to Journal of Supply Chain Management.
123
pursuing innovation-based competitive strategies (Delbridge and Mariotti 2009). For example, in a survey of 137 Chinese manufacturing SMEs, Zeng, Xie and Tam (2010) found that inter-firm cooperation has the most significant positive impact on the innovation performance of SMEs. Considering the peculiarities of SMEs and inherent resource constraints, collaboration with their supply chains in particular can help improve their performance in product innovation (Frohlich and Westbrook 2001; Rosenzweig, Roth and Dean Jr 2003). Through such partnerships SMEs have access to comprehensive and external expertise, can solve problems at the business level, and engage in learning networks. Despite this seemingly overwhelming evidence that there are performance benefits for SMEs from engaging with network partners (Lambert 2008; Yu, Yan and Cheng 2001) at present there is limited understanding of what firm factors precisely contribute to successful partnerships. Furthermore, in a seminal study Arend (2006) found that SCM can be negatively associated with SME performance; this was largely due to SCM effects of exposing the SME to greater management and control hazards while reducing its private differentiation advantages. Specifically then the aim of this paper is to address the following research question: How to conceptualize and measure the degree to which SMEs engage in collaboration with network partners. The main contribution of this paper is to conceptualize and test two alternative views on how collaboration between companies can be modeled: the organizational and the functional model. By analyzing the engagement of different departments within a single firm, clues are derived for understanding how partnership performance can be measured. This study reveals that business functions or departments within a single firm can have different characteristics such as trust, risk, and contract style, which are important for collaboration. This leads to different propensities of these business functions to collaborate with network partners. Ultimately, it can cause a barrier for SMEs in seizing networking and partnering opportunities. This presents serious implications for the leaders of firms attempting to establish supply chain partnerships for innovation. It may also help them develop more appropriate networking strategies. Most work on partnership in the context of SCM has been done around large enterprises (Thakkar, Kanda and Deshmukh 2008) and there are just a few recent articles focusing on SMEs (Arend 2006; Arend and Wisner 2005; Tan, Smith and Saad 2006). None of these articles has considered relationships that high-tech SMEs have with their supply chain partners. From another perspective, while most of the literature focuses on 124
organizational partnership and overall performance, the current work focuses on partnership in different functional areas. The next section covers the theoretical background. Then we discuss the methodology and the findings of our study. Finally, the discussion, managerial implications, and conclusion are provided.
5.2
Theoretical background
Inter-organizational relationships help firms create value by combining resources, sharing knowledge, increasing speed to market, and gaining access to foreign markets (Doz and Hamel 1998). These inter-firm cooperative relationships may especially help SMEs typically faced with obstacles and weaknesses such as the lack of financial resources, inadequacy of management and marketing, lack of skilled workers, weakness in external information and linkages, and difficulty in coping with government regulations which limit their competitiveness (Buijs 1987; Freel 2000; Rothwell 1994). Supply chain management is defined as the systemic, strategic coordination of the traditional business functions and the tactics across these business functions within a particular firm and across businesses within the supply chain, for the purposes of improving the long-term performance of the individual companies and the supply chain as a whole (Mentzer, DeWitt, Keebler, Min, Nix, Smith and Zacharia 2001). Also, there are different kinds of relationships between partners in a supply chain mainly based on the degree of closeness of relationship called partnership. Partnership (also known as collaboration) is a central concept in supply chain management (SCM), and is in fact the driving force of effective SCM (Horvath 2001). Generally speaking, it is a type of interorganizational relationship placed in the middle of a continuum from arm’s length relationship to vertical integration (Ellram and Cooper 1990). Apart from the centrality of the concept in SCM studies, there are a few works on the concept itself, and its operationalization (Anderson and Narus 1990; Spekman, Jr and Myhr 1998). Here we begin by reviewing some definitions of this concept in the literature (see Table 5.1).
125
Table 5.1 Some definitions of supply chain partnership
Partnership definition Reference “A type of channel relationship where the (Ellram and Cooper 1990) intent of the relationship is to yield differentiated and intermediate or long term benefit to the parties involved in the relationship.” “A relationship formed between two (Maloni and Benton 1997) independent entities in supply channels to achieve specific objectives and benefits.” “An interorganizational entity developed (Mentzer, Min and between two independent organizations in a Zacharia 2000) vertical relationship within a supply chain.” “A relationship formed between two (Yu, Yan and Cheng 2001) independent members in supply channels through increased levels of information sharing to achieve specific objectives and benefits in terms of reductions in total costs and inventories.” “A tailored business relationship featuring (Hagelaar and van der Vorst mutual trust, openness, and shared risk and 2001) reward that yields strategic competitive advantage.” According to these definitions we can identify the main elements of this concept as follows: It is a relationship between two or more organizations; Involving organizations are independent; It aims at intermediate and long term benefits for the organizations involved (benefits such as cost and inventory reductions); It has some components such as mutual trust and openness and involves information sharing. As can be seen from these definitions, partnership is mainly considered as a type of relationship between ‘organizations’. So while the literature mainly focuses on an organizational perspective on partnership, the functional perspective has received relatively less attention. It is necessary to include all of the traditional business functions in the process 126
and implementation of partnerships (Mentzer, DeWitt, Keebler, Min, Nix, Smith and Zacharia 2001). When it comes to the functional perspective, we see that most work on partnerships, has been undertaken for the functions of logistics and purchasing (see for example: Caniëls, Gelderman and Ulijn 2010; Caniëls and Gelderman 2007; Carr and Pearson 1999; Ellram 1995; Gao, Sirgy and Bird 2005; Heide and John 1990; Miller and Kelle 1998; Noordewier, John and Nevin 1990; Stump and Sriram 1997). This focus in partnership research on logistics and purchasing can be attributed to the dominant role of these functions in buyer-supplier relationships; a few works are devoted to other functional areas such as research and development (R&D), marketing and sales, production, and finance (Rezaei and Ortt 2012). Notwithstanding this, it has been shown that other business functions also play important roles in partnerships. For example, as found by Ruekert and Walker (1987), marketing plays a co-coordinating role to connect all the other functional departments to the outside environment. A study by Hagedoorn (2002) showed a general growth pattern for R&D partnership, especially for hightech industries, during the last four decades. Different components have been suggested for partnership in the literature (see for example: Mentzer, DeWitt, Keebler, Min, Nix, Smith and Zacharia 2001; Rinehart, Eckert, Handfield, Page and Atkin 2004). One of the most comprehensive list of components, proposed by Lambert (2008) is described as follows. Planning. A partnership involves some degree of joint planning. It helps a relationship to become stronger and more flexible. In case of a high level of joint planning, each party participates in other’s business planning. Joint operating controls. In partnership, partners are to some extent able to change the operations of each other in order to improve the relationship. Joint planning, and joint operating control move the firm towards the desired direction (Cooper, Lambert and Pagh 1997). Communications and information sharing. Partnership is characterized by some degree of close and frequent communication and information sharing. Information sharing is recognized as a key requirement of successful supply chain management implementation (Fawcett, Osterhaus, Magnan, Brau and McCarter 2007; Moberg, Cutler, Gross and Speh 2002; Zhao, Xie and Zhang 2002). Risk/reward sharing. In a partnership, partners should be ensured that reward/benefits and risks/costs are shared. The risk and reward sharing balance is one of the key factors which will guide companies towards 127
establishing and maintaining supply chain partnerships (Matopoulos, Vlachopoulou, Manthou and Manos 2007). Trust and commitment. Loyalty to each other and commitment to a long-term relationship are key elements of a partnership. Trust is the guiding principle in alliances (Handfield and Bechtel 2004). Trust and commitment have a positive effect on the performance of SCM (Kwon and Suh 2004; Kwon and Suh 2005). Contract style. In a partnership there is frequently no formal contract, and where one does exist it is often a short document. Palay (1985) mentioned several advantages of informal contracts, some of which are: it is “more timely than other strategies”, and it “provides the parties a means of making adjustments in relatively short order”. Scope. The number of value-added steps and the amount of businesses covered in the relationship show the scope of the partnership. SkjoettLarsen, Thernøe and Andresen (2003) found that to better understand a partnership, both collaboration depth and scope should be studied. Investment. A partnership shows some degree of joint investment, and shared assets. It has been found that in many circumstances, it is beneficial for supply chain partners to invest jointly. For example, as mentioned by Matthyssens and Van den Bulte (1994), joint investment in new product development may result in a better product quality. Considering these components, both organizational and functional perspectives on partnership can be operationalized. That is, measuring each component of partnership across different organizations: we measure the partnership based on the organizational perspective. While measuring each component of partnership across different business functions: we measure the partnership based on the functional perspectives. The two potential models for investigation can be illustrated as in Figure 5.1.
128
A. Organizational model (MS: Marketing and Sales, RD: Research and Development, PL: Purchasing and Logistics, Pr: Production, Fi: Finance).
B. Functional model (C1: Scope, C2: Contract, C3: Joint control, C4:Joint decision-making, C5: Communication, C6: Risk/Reward sharing, C7: Joint investment, C8: Trust, C9: Commitment).
Figure 5.1 Two conceptual models to operationalize SC partnership
129
5.3
Methodology
5.3.1 Population, Sample and Data Collection The population of this study is formed from Dutch SMEs in high-tech industries. For the purpose of this study we adopt the European Commission definition of SMEs as “The category of micro, small and medium-sized enterprises (SMEs) is made up of enterprises which employ fewer than 250 persons and which have an annual turnover not exceeding 50 million euro, and/or an annual balance sheet total not exceeding 43 million euro” (European-Commission 2003). For these SMEs, partnerships with their supply chain partners are investigated. This population was selected based on the criteria eligibility (i.e. the selected cases must be members of the theoretical domain), prioritization (i.e. the population should be selected from a part of the domain that has not already been tested), and feasibility (i.e. the population should be selected considering the availability and accessibility of the data). To draw a sample we used the Kompass database containing nearly 220,000 Dutch firms about 200,000 (91%) of which are SMEs. To include only high-tech SMEs we considered 17 product categories out of 99 product categories of the database. The selection procedure for high-tech firms is based on Medcof’s classifications of high-tech industries (Medcof 1999). A four-page questionnaire (see appendix 1 at the end of the book) including items for collaboration with supply chain partners (suppliers and customers) for different functional areas, and overall firm performance was devised. A panel of professionals with substantial knowledge about the topic was asked to review and modify original items especially those that have not been tested in previous studies. After this panel evaluation, some item statements were rewritten. Furthermore the questionnaire was pretested in a series of personal interviews based on the Three-Step TestInterview approach (TSTI) (Hak, Van der Veer and Jansen 2004) with managers of two high-tech SMEs. After this pretest further items were revised. Finally, the questionnaire was translated to Dutch by a professional editor, and revisited by one of the authors of the current paper to correct potential translation errors. There were 95 items in total for measuring partnerships between firms and their upstream and downstream partners with respect to five different functional areas (19 items per each functional area). Four items were used to measure the overall performance of the firm. For all the items a 7 point Likert scale was used. 130
The questionnaire, along with a cover letter (both in Dutch), and a pre-addressed stamped envelope was sent to senior managers of 6000 randomly selected SMEs in high-tech industries. In total, 304 questionnaires were returned representing an overall response rate of 5.7 percent. From these questionnaires, 25 were excluded (6 do not satisfy the inclusion requirements: the number of employees and/or turnover exceeded those of SMEs, and 19 were excluded because of an amount of missing data exceeding 10 percent). In Table 5.2, some descriptive statistics of the sample and the respondents are provided. Table 5.2 Some characteristics of the sample, and the respondents
Characteristics of the firms No employees Annual turnover (1000 euro) Firm age (year) Characteristics of the respondents
Minimum Maximum Mean 1 250 44.32 100 50000 10763
s.d. 43.46 12675
2.00
26.52
161.00
43.03
Minimum Maximum Mean s.d. Years working for firm 1 47 16.51 10.74 Respondent age (year) 22.00 81.00 49.84 9.74 Respondent sex Male: 240 (86%), Female: 14 (5%), Missing: 25 (9%) Respondent High School: 70 (25.1%), Bachelor: 87 (31.2%), degree Master: 65 (23.3%), PhD: 5 (1.8%), Other: 32 (11.5%), Missing: 20 (7.2%)
5.3.2 Analysis 5.3.2.1
Confirmatory factor analysis (CFA)
CFA is used generally when an a priori theoretical model exists, and the goal is to see whether the data confirm such a model (Hair, Black, Babin, Anderson and Tatham 2006; Schumacker and Lomax 2010). As there is theoretical support for the two models: (organizational and functional models), we apply CFA to test the goodness of fit of these models. To conduct the CFA for the models, as indicated by Schumacker and Lomax (2010) the following steps are completed: model specification, model identification, model estimation, model testing, and model modification. 131
Model specification: In this step, according to different hypothesized relationships between observed variables and hypothesized factors, different models can be specified. In our study, we have 45 observed variables1 (p), and different numbers of factors (latent variables) for the two models. In the organizational model, nine latent variables are hypothesized that represent organization-wide aspects related to partnerships. These aspects are: scope of the activities that partners undertake, joint control of these activities, joint decision-making, communication and information sharing, length of contract, joint investment, risk/reward sharing, trust, and commitment. Several observed variables are used to measure a particular aspect and form a latent variable. In the organizational model, observed variables for a particular aspect of partnership are formed for each functional area separately and then these function-specific observed variables together are hypothesized to measure the organization wide latent variable. For example, the observed variables ‘joint decision-making in marketing and sales’, ‘joint decision-making in research and development’, ‘joint decision-making in logistics and purchasing’, ‘joint decision-making in production’, and ‘joint decision-making in finance’ in combination are hypothesized to measure a single latent variable (aspect) ‘joint decision-making’ for the entire organization. In the functional model there are five hypothesized latent variables: partnership in marketing and sales, partnership in research and development, partnership in logistics and purchasing, partnership in production, and partnership in finance. In this model, observed variables that measure partnership aspects in a particular functional area are combined across aspects to form a latent variable that represents the overall partnership orientation per function. For example, the observed variables ‘scope of partnership in marketing and sales’, ‘joint control in marketing and sales’, ‘joint decision-making in marketing and sales’, ‘communication and information sharing in marketing and sales’, ‘contract type in marketing and sales’, ‘joint investment in marketing and sales’, ‘risk/reward sharing in marketing and sales’, ‘trust in marketing and sales’, and ‘commitment in marketing and sales’ are hypothesized to measure a single latent variable ‘partnership in marketing and sales’ (see Figure 5.1: A). Model identification: prior to estimation of parameters, it is necessary to solve the identification problem. It shows whether the factor loadings can 1
Please note that some of the observed variables are representative of more than one item.
132
be estimated. To this end, we should first assess the order condition which means that the number of free parameters to be estimated has to be less than or equal to the number of distinct values in the sample variancecovariance matrix S. Here we calculate the number of free parameters for the three models. The number of free parameters for the organizational model = 45 (factor loadings) + 45 (measurement error variances) + 36 (correlation among the latent variables) + 81 (measurement error correlations)1 = 207. The number of free parameters for the functional model = 45 (factor loadings) + 45 (measurement error variances) + 10 (correlation among the latent variables) + 90 (measurement error correlations)1 = 190. The number of distinct values in the matrix S is calculated as follows. p (p+1)/2 = 45 (45+1)/2 = 1035 Both models meet the condition that the number of distinct values in the matrix S (1035) is greater than the number of free parameters of the model. However, it is also necessary to check the rank condition to fully identify a model. This condition is tested when using LISREL 8.80 (Jöreskog and Sörbom 2007). Model estimation: after identifying the model, it is necessary to estimate the parameters. To estimate the free parameters several procedures can be applied such as maximum likelihood, generalized least square, and weighted least squares. We selected the maximum likelihood procedure because it is the most commonly used. We used the LISREL 8.80 program (Jöreskog and Sörbom 2007) to estimate the parameters. In Table 5.3 are the standardized estimates for the two models. It is also worth mentioning that, a sample size in a range of 150-400 is suggested when applying the maximum likelihood method (Hair, Black, Babin, Anderson and Tatham 2006) (our sample size = 279). Model Testing: when the parameters are estimated, it is very important to see if the specified models fit the sample data. There are several model-fit indices to test the model. To assess the goodness-of-fit of the models we report multiple fit indices (see Table 5.4).
1
A correlated measurement error is specified between two indicators, providing that the model is identified (Gerbing and Anderson, 1984). Here we don’t use the correlated measurement errors, as a post hoc step to solely improve the model fit (Bagozzi, 1983). We correlate the measurement error of indicators for a particular aspect of partnership across different departments/functional areas (for example the measurement errors of indicators measuring ‘trust’ across different 5 departments/functional areas are correlated. Please note that the difference between the number of correlated measurement errors of the two models is due to the slight difference in identification of the models.
133
Table 5.3 Standardized estimations of the two models organizational, and functional Organizational Model * Construct (factor) Scope
Items ScopeMS
ScopeRD ScopePL Scope-Pr
ContractMS ContractRD ContractPL ContractPr ContractFi
0.66 (10.92) 0.46 (7.04) 0.27 (4.04) 0.45 (6.97) 0.85 (15.6) 0.78 (14.04) 0.61 (9.11) (7.14) 0.56 0.51 (7.88)
ControlMS ControlRD ControlPL ControlPr ControlFi Decision -MS Decision -RD Decision -PL
0.78 (14.84) 0.79 (14.93) 0.66 (11.62) 0.56 (9.59) 0.59 (10.19) 0.78 (14.87) 0.77 (14.43) 0.63 (11.3)
Scope-Fi Contract
Joint control
Joint decisionmaking
134
Loadings (t-values) 0.69 (11.44)
Functional Model ** Construct (factor) Partnership in marketing and sales (MS)
Items Scope-MS
Contract-MS Control-MS Decision-MS Risk/RewardMS InvestmentMS Trust-MS
Partnership in research and developme nt (RD)
Communicatio n-MS CommitmentMS Scope-RD
Contract-RD Control-RD Decision-RD Risk/RewardRD InvestmentRD Trust-RD Communicatio n-RD CommitmentRD
Loadings (t-values) 0.72 (14.44)
0.65 (13.88) 0.78 (16.38) 0.82 (17.28) 0.71 (14.71) 0.66 (13.48) 0.72 (16.15) 0.87 (19.14) 0.40 (8.86) 0.72 (14.19)
0.59 (12.46) 0.80 (16.77) 0.85 (18.14) 0.70 (14.35) 0.72 (14.99) 0.63 (14.32) 0.83 (18.06) 0.39 (8.50)
Risk/Reward sharing
Joint investment
Trust
Decision -Pr
0.55 (9.51)
Decision -Fi Risk/Re ward-MS Risk/Re ward-RD Risk/Re ward-PL Risk/Re ward-Pr Risk/Re ward-Fi Investme nt-MS Investme nt-RD Investme nt-PL
0.62 (11) 0.82 (15.94) 0.79 (15.11) 0.67 (11.93) 0.64 (11.21) 0.67 (12.01) 0.79 (15.12) 0.79 (15.07) 0.7 (12.39)
Investme nt-Pr Investme nt-Fi Trust-MS
0.65 (11.32) 0.69 (12.03) 0.91 (17.33) 0.74 (13.44) 0.48 (7.07) 0.39 (5.54) 0.49 (7.02) 0.85 (16.73)
Trust-RD Trust-PL Trust-Pr Trust-Fi Communication
Commun icationMS Commun icationRD Commun icationPL
0.75 (14.14) 0.58 (9.99)
Partnership in purchasing and logistics (PL)
Scope-PL
0.65 (12.43)
Contract-PL
0.58 (12.98) 0.77 (16.22) 0.76 (16.22) 0.66 (14.33) 0.60 (12.99) 0.55 (12.26) 0.86 (18.66) 0.35 (7.77) 0.59 (10.70)
Control-PL Decision-PL Risk/RewardPL Investment-PL Trust-PL
Partnership in production (pr)
Communicatio n-PL CommitmentPL Scope-Pr
Contract-Pr Control-Pr Decision-Pr Risk/RewardPr Investment-Pr Trust-Pr Communicatio n-Pr CommitmentPr Partnership in finance (Fi)
0.57 (12.06) 0.71 (13.90) 0.76 (15.60) 0.63 (13.47) 0.60 (12.33) 0.55 (12.73) 0.81 (17.08) 0.34 (7.61)
Scope-Fi
0.70 (13.80)
Contract-Fi
0.59 (12.38)
135
Commitment
Commun icationPr Commun icationFi Commit ment-MS Commit ment-RD Commit ment-PL Commit ment-Pr Commit ment-Fi
0.44 (7.31)
Control-Fi
0.77 (15.72)
0.59 (10.06)
Decision-Fi
0.78 (15.90)
0.8 (10.42) 0.79 (10.3) 0.36 (2.94) 0.37 (3.00) 0.19 (1.40)
Risk/RewardFi Investment-Fi
0.61 (12.41) 0.61 (13.14) 0.57 (11.87) 0.87 (18.55) 0.37 (8.08)
Trust-Fi Communicatio n-Fi CommitmentFi
*For the organizational model: loading of Commitment-Fi is not significant; loadings of Commitment-PL, and Commitment-Pr are significant (p < 0.01); all the other loading are highly significant (p < 0.001). **For the functional model: All the loadings are highly significant (p < 0.001).
Table 5.4 Fit indices of the models organizational, and functional Model fit indices χ2 Df Root Mean Square Error of Approximation (RMSEA) P-Value P-Value for Test of Close Fit (RMSEA < 0.05) Non-Normed Fit Index (NNFI) Comparative Fit Index (CFI)
Organizational Model 6696.16 828 0.16
Functional Model 1490.96 845 0.052
0.00 0.00
0.00 0.18
0.89 0.91
0.98 0.98
It is important that the estimates are statistically significant. As can be seen from Table 5.3, all the estimates for the functional model are highly significant. For the organizational model all estimates, except one, are significant. However, as the overall fit of the organizational model is poor, we cannot rely on these estimates. Given the above, we are now able to conclude that the functional model is much better than the organizational model as it fits the sample data very well. In what follows we examine the construct validity of the five latent variables in the functional model. To this end, we begin by 136
taking a look at the mean and the standard deviation of these five constructs and the correlation between them (see Table 5.5). Table 5.5 Mean, standard deviation (s.d.) and correlation of the constructs of the functional model Constructs Mean Partnership in 3.35 marketing and sales (MS) Partnership in 3.39 research and development (RD) Partnership in 3.52 purchasing and logistics (PL) Partnership in 3.50 production (Pr) Partnership in 3.03 finance (Fi)
s.d. 1.22
MS 1.00
RD
PL
Pr
Fi
1.14
0.68 (19.37)
1.00
1.08
0.65 0.67 (16.88) (17.98)
1.04
0.55 0.63 0.67 (11.51) (15.30) (17.86)
1.09
0.61 0.57 0.61 0.60 1.00 (14.63) (12.82) (14.41) (13.96)
1.00
1.00
All the correlations are highly significant (p < 0.001).
Construct Validity: is the degree to which a measure assesses the construct it is purported to assess (Peter 1981). Here we discuss the construct validity for the functional model. To this end, we will consider face validity and nomological, convergent, and discriminant validity (Hair, Black, Babin, Anderson and Tatham 2006). Face validity and nomological validity: as discussed before we used a panel of experts to match the construct definition and item wording. Furthermore, the Three-Step Test-Interview (TSTI) (Hak, Van der Veer and Jansen 2004) procedure is used to improve the wordings and to ensure the face validity of the scales. Table 5.5 shows that all the correlations between the constructs are positive and highly significant, which shows the nomological validity of the constructs as it is assumed that partnership in different functional areas of the firm have a close and supportive relationship. Convergent validity: the items (observed variables) of a particular construct (latent variable) should converge or share a high common 137
variance. Two main indicators of convergent validity are factor loadings, and construct reliability (Hair, Black, Babin, Anderson and Tatham 2006). As can be seen from Table 5.3, all the factor loadings, for all the constructs, are highly significant, which is the minimum requirement for convergent validity (Anderson and Gerbing 1988). All the standardized factor loadings except ‘commitment’ loadings are higher than 0.5 (the cut-off point: 0.5 (Bagozzi and Yi 1988)). Because of the theoretical reasons we do not exclude the ‘commitment’ items (please note that the ‘commitment’ loadings, although below 0.5, are highly significant). Although there are several reliability indicators (Cronbach 1951), in SEM models ‘construct reliability’ (CR) (Fornell and Larcker 1981; Hair, Black, Babin, Anderson and Tatham 2006) is mostly used. We calculated the CR for five constructs of the functional model. The results show excellent reliability scores as follows (CRs greater than 0.7 show good reliability (Hair, Black, Babin, Anderson and Tatham 2006)). CR marketing and sales = 0.987; CR research and development = 0.987; CR purchasing and logistics = 0.987; CR production = 0.986; CR finance = 0.986. Discriminant validity: each construct should be distinct from the other constructs. One of the best ways to evaluate discriminant validly is to compare the variance extracted (VE) of all combinations of two constructs with the square of the correlation between those two constructs (Hair, Black, Babin, Anderson and Tatham 2006). As we have five constructs in the functional model, we should first calculate the VE for the constructs and compare them with their corresponding square of correlations. The VEs of the constructs are obtained as follows: VE marketing and sales = 0.51; VE research and development = 0.50; VE purchasing and logistics = 0.43; VE production = 0.40; VE finance = 0.44. Comparing these VEs with the square of the correlation between constructs reveals that almost all the VEs are greater than their corresponding square correlations which provide support for discriminant validity (Fornell and Larcker 1981). For example both VE marketing and sales (0.51) and VE research and development (0.50) should be greater than the square correlation between ‘Partnership in marketing and sales (MS)’ and ‘Partnership in research and development (RD)’ (0.68^2 = 0.46).
138
In sum, the results of construct validity provide strong support for the proposed functional model. 5.3.2.2
Regression Analysis
Several studies have investigated the relationship between partnership and performance of the firm. For example, Li, Ragu-Nathan, Ragu-Nathan and Subba Rao (2006), collecting data from 196 organizations, found that higher levels of SCM practice can lead to enhanced competitive advantage and improved organizational performance. Koh, Demirbag, Bayraktar, Tatoglu and Zaim (2007), collecting data from 203 manufacturing SMEs found that SCM practices (such as outsourcing and having multi-suppliers, strategic collaboration and lean practices) have a direct positive and significant impact on operational performance of the company. Tan (2002) found that all significant supply chain management practices, including supply chain integration, and information sharing, have a positive impact on performance. In order to explore the effects of partnership in different functional areas on the overall performance of a company, we performed an OLS regression analysis. Overall performance was measured using the observed variables: profitability, sales growth, employment growth, and market share. The results of the regression analysis show a highly significant effect of ‘partnership in research and development (R&D)’ on overall performance (see last column of Table 5.6).
139
Table 5.6 The results of regression analysis: standardized coefficients and their corresponding t-values Variables
Profitability
Partnership in marketing and sales (MS) Partnership in research and development (RD) Partnership in purchasing and logistics (PL) Partnership in production (Pr) Partnership in finance (Fi) Adjusted R2
Sales Employment growth growth
Market share
Overall performance
-0.192* (-2.467)
0.020 (0.268)
-0.084 (-1.088)
0.126 (1.633)
-0.040 (-0.524)
0.300** (3.857)
0.303** (5.287)
0.246** (4.225)
0.227** (3.875)
0.313** (5.488)
-0.093 (-1.197)
-0.031 (-0.442)
0.047 (0.650)
0.078 (1.081)
-0.013 (-0.178)
0.037 (0.497)
-0.040 (-0.563)
-0.053 (-0.738)
0.054 (0.756)
-0.012 (-0.176)
0.012 (0.171)
-0.032 (-0.485)
-0.073 (-1.100)
0.031 (0.458)
-0.039 (-0.603)
0.044
0.088
0.057
0.048
0.095
*p