A Constructive-Fuzzy System Modeling for Time Series Forecasting Ivette Luna, Secundino Soares and Rosangela Ballini Abstract— This paper suggests a constructive fuzzy system modeling for time series prediction. The model proposed is based on Takagi-Sugeno system and it comprises two phases. First, a fuzzy rule base structure is initialized and adjusted via the Expectation Maximization optimization technique (EM). In the second phase the initial system is modified and the structure is determined in a constructive fashion. This phase implements a constructive version of the EM algorithm, as well as adding and pruning operators. The constructive learning process reduces model complexity and defines automatically the structure of the system, providing an efficient time series model. The performance of the proposed model is verified for two series of the reduced data set at the Neural Forecasting Competition, for one to eighteen steps ahead forecasting. Results show the effectiveness of the constructive time series model.
I. I NTRODUCTION Currently, there is a vast literature describing models in the field of time series for a variety of applications, such as filtering, prediction of future values, simulation or simply modeling to provide some kind of data description [1]. From all these tasks, time series prediction is a difficult one that involves different stages and very challenging problems like input selection, model generation and model evaluation. On the one hand, it is common that techniques for building time serie models be based on linear strategies, considering only linear dependencies among variables, as the traditional Box & Jenkins methodology [2]. The drawback of applying this kind of modeling for nonlinear problems is that they are almost unable to capture nonlinear relationships among variables, resulting in models with low performance and poor prediction results. On the other hand, non-linear modeling based on neural and fuzzy techniques have emerged as effective nonlinear predictor alternatives, since they are able to capture nonlinear input-output relationships. However, the determination of the optimal structure is a critical issue that cannot be addressed analytically. If some understanding of the problem or some information is available, and the complexity of the function to map is low, thus, the possibility of finding a topology close to optimal increases. When the complexity of the problem goes up, we have to use all the available methods, including techniques from the statistical theory field. Time series modeling is a class of problem where the goal is to approximate an hypothetical function describing the Ivette Luna and Secundino Soares are with the Department of System Engineering, Faculty of Electrical Engineering, State University of CampinasSP, CEP 13083-852, Brazil (phone: 0xx55 19 3521-3705; fax: 0xx55 19 3289-4313; email: {iluna,dino}@cose.fee.unicamp.br). Rosangela Ballini is with the Department of Economic Theory, Institute of Economics, State University of Campinas-SP, CEP 13083-857, Brazil (phone: 0xx55 19 3521-5707; fax: 0xx55 19 3289-1512; email:
[email protected]).
behavior of a dynamic system on the basis of observations. The modeling task is then complicated by the ignorance of the optimal input space and all the model uncertainties tend to downgrade the prediction accuracy. In this paper, the relevant inputs for building time series models are selected applying a combined methodology based on the False Nearest Neighborhood algorithm (FNN) [3] and the one proposed in [4], which is based on the Partial Mutual Information Criterion (PMI), originally proposed in [5]. This approach is applied because it is capable of dealing with nonlinear relationship among variables involved, which is more appropriate for the problems under study. It is well known that modeling methods are problem dependant and that any modeling methodology cannot pretend to be completely universal. At this paper, we suggest a time series model based on a constructive-fuzzy system modeling (C-FSM), which is built in two stages. First, an initial model structure based on two fuzzy rules is generated with available historical data. The parameters of this structure are adjusted via a classical Expectation Maximization (EM) algorithm [6]. In the second stage, the initial structure is modified and refined based on a constructive offline learning and on adding and pruning operators. Hence, the classical EM algorithm is adapted as a learning algorithm for fuzzy rule based systems. This algorithm develops parameters adjustment and an automatic structure selection simultaneously, which is a great advantage, when compared with other approaches of the literature. The proposed approach is applied to forecast two series belonging to the reduced data set at the Neural Forecasting Competition. The constructive models are adjusted, analyzed and evaluated through a multiple steps ahead forecasting. The paper is organized as follows. Section II introduces the structure of the C-FSM. Based on the proposed architecture, Section III details the constructive learning algorithm. Simulation results are shown in Section IV. Finally, some conclusions are presented in Section V. II. S TRUCTURE OF THE C-FSM The structure of the C-FSM is composed by a set of M fuzzy rules, which are based on the first order Takagi-Sugeno (TS) fuzzy system [7], as illustrated in Fig. 1. Let xk = [xk1 , xk2 , . . . , xkp ] ∈ Rp be the input vector at instant k, k ∈ Z+ ˆk ∈ R the output model, for its 0; y k correspondent input x . The purpose is to build a nonparametric model, based on a fuzzy rules based system, dividing the global problem in subproblems with a lower complexity degree. This goal is achieved partitioning the input space into M subregions. Each partition is defined by its center ci ∈ Rp and its
covariance matrix Vi ∈ Rp×p . Hence, a fuzzy rule is assigned to each partition, and a local model is adjusted. As partitions are not roughly defined, every input pattern will have a membership degree gik associated to each subregion. R1
.. .
k
x
Ri
y1k
M X
x .. .
yik
k
x gik
k yM
gik = 1
(5)
i=1
g1k
.. . RM
rule, given the input vector xk , as well as the parameters covariance matrix Vi and centers ci . Indeed, from Eq.(3), gik satisfies the unity condition:
P
yˆ
x
which is a condition necessary to consider gik as a membership function in fuzzy theory [8]. The output model yˆk is computed as a non-linear combination among the outputs of the local models yik and theirs respective membership degrees gik , that is: k
yˆ =
k gM
M X
gi (xk ) yik
(6)
i=1
Input space partition
Fig. 1. A general structure of the C-FSM, composed by a total of M fuzzy rules.
The system emulates a fuzzy reasoning mechanism, encoding a fuzzy rules base in the form of IF THEN . The antecedent part is represented by a subregion of the input space, and the consequent part is delineated by a local model. Therefore, the i−th fuzzy rule is defined as Rki :
IF < xk belongs to the “i−th” region with a membership degree gik > THEN < yˆk = yik > (1)
where yik , i = 1, . . . , M , is defined by a local linear model: yik = φk × θi T
(2)
which φk = [1 xk1 xk2 . . . xkp ] ∈ R(p+1) is a vector composed by the k−th input vector and a constant term; θi = [θi0 θi1 . . . θip ] ∈ R(p+1) is the coefficients vector for each local model. Membership degrees gi (xk ) ∈ [0, 1], i = 1, . . . , M , are computed as: gi (xk ) = gik =
αi · P [ i | xk ] M X αq · P [ q | xk ]
(3)
q=1
PM being αi positive coefficients satisfying i=1 αi = 1. These coefficients can be considered an indirect measure of relevance for each rule generated during the training process, so that, a higher value of αi is, indicates that the respective rule is more relevant for the modeling task. Besides, P [i | xk ] in Eq.(3) is defined as 1 = × (2π)p/2 det(Vi )1/2 ¾ ½ 1 ×exp − (xk − ci )Vi−1 (xk − ci )T 2
P [ i | xk ]
(4)
where det(·) is the determinant function. Eq. (4) also represents the conditional probability of activating the i−th
Eqs.(2)-(6), have been detailed for a single output. However, this model can be extended for modeling multiple outputs. Thus, the proposed model may be interpreted as an inference mechanism, codified into the model structure, where the model output yˆk is calculated by means of an aggregated value of M local linear models yik , according to Eq. (6). Notice that gik relies on xk , ci and Vi . Different papers in the literature have done interesting comparison studies among statistical methods and computational models based on neural networks and fuzzy systems (see [9] and [10]). Both, regression models and the C-FSM model proposed in this work, are used to model a relationship among variables, commonly represented as yˆk = f [ xk ] = f [ xk1 , xk2 , . . . , xkp ] where f [·] is the functional relationship between independent (or observable) variables xk and the dependant variable y k ; yˆk denotes the estimated value of y k . Following this, the goal of the model C-FSM is to predict the single dependent variable y k from its input variable xk , generally composed by lagged realizations of its output. This predicted value yˆk is represented by the non-linear relationship defined by Eq.(6). In the case of the eleven time series from the reduced data set at the NN3 Competition, xk is composed only by the past values of y k , for one step ahead forecast. A difference between these two approaches is that, regression models are defined by its coefficient vector, whereas the C-FSM is defined by a set of parameters, including centers ci , covariance matrices Vi and local models parameters θi , i = 1, . . . , M . Consequentely, while linear models have a closed form solution for the coefficients, the constructive one uses an iterative process. Despite this “extra cost”, an advantage of the model proposed is that, applying the constructive learning, its structure and parameters are defined automatically, decreasing the difficulty of choosing parameters for building the time series models. The constructive learning is detailed as follows. III. C ONSTRUCTIVE L EARNING OF THE C-FSM This paper suggests a constructive offline learning for building a time series model. This algorithm determines
automatically the number of fuzzy rules, as well as its internal parameters ci , Vi and θi , i = 1, . . . , M , which define the entire structure of the model. The learning algorithm comprises two stages: model initialization and adaptation.
2) M step: Maximize Eq. (7) and update model parameters, with optimal values given as: N 1 X k hi N k=1 ÃN ! N X X ci = hki xk / hki
αi =
A. First Stage: Model Initialization First, an initial structure composed by two fuzzy rules (M = 2) is defined, and its parameters are adjusted via the traditional Expectation Maximization algorithm, originally proposed for mixture of experts models in [6]. The parameters of these rules are initialized as: ci is equal to a pattern from the training set chosen aleatory; αi = 1/M = 0.5, while Vi = 10−4 I, where I is the identity matrix. Coefficients θi for local models are initialized with random values between [0, 1] and the standard deviation σi = 1.0. Based on the EM algorithm, model parameters are adjusted from a set of N input-output patterns, during an iterative sequence of EM steps. The goal of the EM algorithm is to find a set of model parameters, which will maximize the loglikelihood L, of the observed values of y k at each M step of the learning process. This objective function is defined by
L(D, Ω) =
N X
k=1
ln
Ã
M X
k
k
k
!
gi (x , C) × P (y | x , θi )
i=1
(7)
where D = {(xk , y k )|k = 1, . . . , N }, Ω contains all model parameters and C contains just the antecedents parameters (centers and covariance matrices). However, for maximizing L(D, Ω), it is necessary to estimate the missing data hki during the E step. This missing data, according to mixture of experts theory, is known as the posterior probability of xk belong to the active region of the i−th local model. When the EM algorithm is adapted for adjusting fuzzy systems, hki may also be interpreted as a posterior estimate of membership functions defined by Eq. (3), computed as αi P (i | xk )P (y k | xk , θi ) hki = PM k k k q=1 αq P (q | x )P (y | x , θq )
(8)
for i = 1, . . . , M . These estimates are called as “posterior”, because these are calculated assuming y k , k = 1, . . . , N as known. Moreover, conditional probability P (y k | xk , θi ) is defined by: ¶ µ 1 [y k − yik ]2 k k (9) P (y | x , θi ) = p exp − 2σi2 2πσi2 with the variance σi2 estimated as: ! ÃN N X X 2 k 2 k k / hki σi = hi [y − yi ] k=1
(10)
k=1
Hence, the EM algorithm for determining C-FSM parameters is summarized as: 1) E step: Estimate hki via Eq. (8);
k=1
Vi =
Ã
N X
hki (xk
(12)
k=1
0
k
!
− ci ) (x − ci )
k=1
(11)
/
N X
hki (13)
k=1
for i = 1, . . . , M . Note that the covariance matrix Vi is a positive semidefined diagonal matrix. This condition suggests an alternative to simplify the problem and avoid unfeasible solutions. An optimal solution for θi is derived solving the following equation: N X ¢ hki ¡ k y − φk × θi · φk = 0 2 σi
(14)
k=1
where σi is the standard deviation for each local output yik , with σi2 defined by Eq.(10). After parameters adjustment, calculate the new value for L(D, Ω). 3) If convergence is achieved, then stop the process, else return to step 1. This optimization algorithm applied for model initialization, will also be the base for the structure adaptation, during the application of adding and pruning operators, as it will be detailed next. B. Second Stage: Adaptation The constructive part of the algorithm proposed consists in modifying the initial model structure. As it was mentioned before, it is based on the EM algorithm, detailed in Subsection III-A, and on adding and pruning operators. The adding operator consists in generating a new rule and incorporate it in the model structure. The pruning operator consists in eliminating an existing rule form the actual model. Thus, if there is some change in the actual structure some EM iterations will be applied, in order to become a new local optimal solution, taking into account restrictions and definitions given by Eqs. (8)-(14). In this way, model structure and parameters will be adjusted and selected automatically during the learning process. 1) Adding a new rule: The criteria proposed to judge whether to generate a new rule or not is called the if-part criterion. The if-part criterion evaluates if existing fuzzy rules can cover and cluster input vectors suitably. It means that, each input pattern must belong to a local rule with at least a minimum probability higher than a pre-defined threshold. Assuming a normal input data distribution, with a confidence level p of γ%, we canpconstruct a confidence interval [ci − zγ diag(Vi ), ci + zγ diag(Vi )], where diag(Vi ) is the main diagonal of the covariance matrix Vi . In this paper, we get a confidence level of γ = 72, 86% which requires a zγ value of 1.1, from normal distribution table. Obviously,
γ = 72, 86% is the middle chunk, leaving 13,57% probability excluded in each tail. Suppose that the actual input pattern xk has a conditional probability function P [ i | xk ] = Pik∗ , such that ¡ ¢ Pik∗ = max P [ i | xk ] i=1,...,M
if Pik∗ is lower than 0.1357, then this pattern does not belong to any active region of the fuzzy rules. Thus, the condition to generate a new rule may be written as: ¡ ¢ Pik∗ = max P [ i | xk ] i=1,...,M > 0.1357 (15)
If this condition is not satisfied, it means that there will be no rule that can cluster this input vector. Since the EM learning algorithm guarantees a local optimal solution, a new rule is added to the structure, so that the input space partition could be improved and a new optimal solution would be reached. Suppose that the actual model is composed by a total of M fuzzy rules. If the condition defined by Equation (15) is not satisfied for one or more patterns, it means that these ones are not inside any active region of one of the M rules. Defining Ω as a set containing all input patterns that do not satisfy Eq. (15), a new rule will be generated, being its center initially estimated as: 1 X t x (16) cM +1 = NΩ t∈Ω
where NΩ is the number of input patterns xt in Ω. Indeed, all the other parameters for the new rule will be initialized as follows: • σM +1 = 1.0; • θM +1 = [¯ y 0 . . . 0]1×(p+1) , where y¯ is calculated being an average value of the outputs of all patterns in Ω. In the case of αi and Vi , all these parameters were reinitialized for i = 1, . . . , M + 1 according to: −4 • Vi = 10 I, where I is a p × p identity matrix; • αi = 1/(M + 1) and M = M + 1; It is necessary to re-initialize αi and Vi in order to give the same importance to all rules during parameters adjustment and to achieve in that way a suitable input space partition, taking into account the new rule into the structure. 2) Pruning an existing rule: As it can be observed in Equation (11), αi can be considered a measure of the importance that each fuzzy rule has for the corresponding topology, when compared to the other rules. It occurs because αi is proportional to the sum of all posterior probabilities hki over all the training data set. Thus, the more times the rule is strongly activated, the higher its corresponding αi will be. This characteristic will help to determine which rule to be pruned. Obviously, if it is necessary to prune some rule or local model, an acceptable candidate will be the one with the minimum value of αi . A minimum value for αi is defined, so that every rule with αi < αmin at each iteration is pruned and eliminated from the actual model structure. After a modification in the structure is identified (adding or pruning), the model will be re-adjusted using the EM
algorithm and Equations (11)–(10) for some iterations. The global process will just stop when convergence is achieved and there is no more evidence of changes on the model structure. IV. S IMULATION R ESULTS In this section, the proposed model is applied to build a time series model for two of the eleven time series composing the reduced data set at the Neural Forecasting Competition (NN3). As it was mentioned in Section I, building a time series model implies a series of tasks to be solved. A strategy adopted in this work is composed by the next steps: • Data analysis and pre-processing; • Input selection; • Model structure and parameter estimation; • Model verification and evaluation. A. Data analysis and pre-processing Time series used in this paper for evaluating the CFSM are series NN3 102 and NN3 104, which are part of the reduced data set at the Neural Forecasting Competition 2006/2007. Series NN3 102 is composed by a total of 126 monthly observations, from January 1979 to June 1989. Series NN3 104 is composed by 133 monthly observations, from January 1983 to July 1988. Both series have a seasonal component, that can be removed applying the following transformation on the original data: z k (m) =
y k (m) − µ(m) σ(m)
(17)
where z k (m) is the stationary version of the time series y k , k = 1, . . . , 126, at the m−th month, for a seasonal time series without a trend; y k (m) is the k−th observation, µ(m) is the monthly average value and σ(m) is the monthly standard deviation. A trend component may be avoided applying a first difference operation, several times as necessary. In order to determine the number of times that this operation needs to be applied, the unit root test was performed. This test, also known as the Augmented Dickey-Fuller test (ADF) [11] was applied with the help of the Econometric Views software [12]. The ADF test provides a t-statistic that determines the existence of unit roots in a regression model of the first difference of the series against the series lagged once, lagged difference terms and/or a constant and a time trend [12] Therefore, evaluating the time series and comparing the obtained ADF t-statistic versus the reported critical values, the existence of unit roots was rejected. Then, there is no necessity to work with the integrated time series and we just remove the seasonal component. This procedure was followed for the entire reduced data set, observing that, for some series (ex. series NN3 101), the first difference transformation was enough to get its stationary version. These transformations will be applied for input selection and for adjusting the time series model.
B. Input selection A suitable set of inputs is selected applying the False Nearest Neighborhood Algorithm - FNN [3] and the Partial Mutual Information Criterion - PMI [5]. The FNN algorithm is used to define an initial set of possible inputs and it is based on the reconstruction of the original space state of a dynamical system from the observed data (the time series). That is, a d−dimensional state space similar to the original and unknown p−dimensional state space is rebuilt. For a given d, input patterns in Rd can appear as “neighbors” in the actual state space because of its projections, and not as a result of the system dynamic, whereas, for a higher d they move apart. Thus, to detect a suitable d, input patterns are built, for d = 1, 2, 3 . . . and so forth, asking at each step, how many patterns in the data set, as seen in dimension d, fail to remain close in dimension d + 1 [3]. Then d is increased until there are no more “false neighbors”. Further details can be found in [3]. The FNN algorithm has shown as an interesting technique for input selection. However, this algorithm is not able to deal with redundant inputs, due to a selection based on consecutive lags. In order to verify redundancy and get a reduced number of input vectors, possible inputs defined by the FNN algorithm (yk−1 , yk−2 , . . . , yk−d ) are evaluated via the Partial Mutual Information criterion (PMI) [5]. Partial mutual information is a measure of the partial or additional information that a new input can add to the existing prediction model. Given a dependent discrete variable Y (the output of the model), and an input X (the independent discrete variable), for a set of pre-existing inputs Z, the discrete version of the PMI criterion is defined as: · ¸ N fX 0 ,Y 0 (x0i , yi0 ) 1 X loge (18) PMI = N i=1 fX 0 (x0i )fY 0 (yi0 ) where:
x0i = xi − E(xi |Z)
(19)
and:
yi0 = yi − E(yi |Z)
(20)
E(·) denotes the expectation function, x0i and yi0 represent the residual components, corresponding to the i−th data pair sample, i = 1, . . . , N , and fX 0 (xi ) fY 0 (yi ) and fX 0 ,Y 0 (xi , yi ) are the respective marginal and joint probability densities. Using Eqs. (19) and (20) the resulting variables X 0 and Y 0 represent only the residual information in variables X and Y , since the effect of the existing predictors in Z have been taken into account [5]. As it can be noticed, good estimates of probability and density functions are necessary and quite relevant for calculating the PMI criterion. Some modifications were established in [4], so that some estimates were improved. Thus, expected values are approximated via the Nadaraya-Watson Estimator [13] and the city block kernel function, whereas marginal and joint probability functions are estimated via kernel functions, due to its efficiency and robustness, as shown in [5].
Advantages applying the PMI criterion for input selection are its capability of detecting all linear and non-linear relations among inputs and outputs variables and its independence of model structure (linear or non-linear). More details can be found in [3], [4], [5] and [14]. Eqs. (19) and (20) are applied iteratively, until the PMI value of a selected input be inferior to a confidence measure. Confidence limit is calculated assuming independence among inputs and the output variable, generating p different arrangements of the independent variable by bootstrapping. The PMI value is calculated for each arrangement and a null test of hypothesis is built. The PMI value associated to the γth percentile will be equal to the confidence limit. That is, if the PMI value of the selected input is greater than the PMI value of the γth percentile sample, it means that there is some significant dependence between the inputs and the output variable and, hence, the null test of hypothesis will be rejected. In this work, we used p = 100 different arrangements of the independent variable and γ = 95%. Initial sets of possible inputs defined by the FNN algorithm for time series NN3 102 and NN3 104 were composed by the first nine and four lags (dN N 3 102 = 9, dN N 3 104 = 4), respectively. Table I shows PMI results obtained for both series. In the case of the series NN3 102, the process stopped at the third step, since the PMI value obtained for lag 9 (a possible input) was inferior to the PMI confidence limit. In the same way, the process for series NN3 104 was concluded at the fourth step. Thus, a model for the NN3 102 time series will have as inputs lags 1 and 3, whereas a time series model for NN3 104 series will have as inputs lags 1, 2 and 3. TABLE I FNN-PMI RESULTS FOR SERIES NN3 102 AND NN3 104.
Step 1 2 3 4
Lag 1 3 9 -
NN3 102 PMI Thres. 0.7775 0.1585 0.2348 0.1010 0.0744 0.0956 -
Lag 1 3 2 4
NN3 104 PMI Thres. 0.3793 0.1411 0.1705 0.1058 0.0351 0.0303 0.0249 0.0322
C. Model structure and parameters estimation After input selection, model structure is initialized, according to the approach detailed in Section III-A, being model structure and parameters defined automatically applying the constructive learning presented in Section III-B. The parameter αmin for both models (NN3 102 and NN3 104) was set as αmin = 0.025. Data set was split into two groups, a training set (in sample data) and a testing set (out sample data). The training set was composed by the first 105 and 94 input-output patterns, for the NN3 102 and NN3 104 models, respectively. In both cases, the first 3 observations for both models were lost because of the form of the input patterns. The testing set was composed by the last 18 data pairs, corresponding to the last 18 observations of each time series. D. Model verification and evaluation Autocorrelation and cross correlation checks were applied for model verification. The first 20 lags of the residual
TABLE II G LOBAL PREDICTION ERRORS FOR SERIES NN3 102 AND NN3 104 OF THE REDUCED DATA SET Series In sample Out of sample Out of sample In sample 1 step ahead 1 step ahead 1 to 18 steps ahead 1 step ahead NN3 102 k = 4, . . . , 108 k = 109, . . . , 126 k = 109, . . . , 126 k = 4, . . . , 126 k = 4, . . . , 97 k = 98, . . . , 115 k = 98, . . . , 115 k = 4, . . . , 115 NN3 104 Series M sMAPE MAE sMAPE MAE sMAPE MAE M sMAPE MAE (%) (u) (%) (u) (%) (u) (%) (u) NN3 102 3 3.41 179.36 4.72 287.98 11.40 658.05 3 2.95 168.28 NN3 104 3 10.98 438.27 6.75 334.93 12.32 612.32 8 8.89 386.79
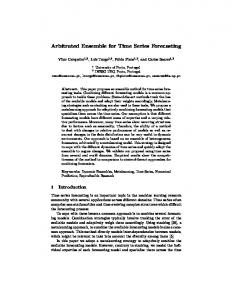
autocorrelations and cross correlation coefficients were estimated. Based on this analysis for both models, there were no evidence of an inadequate modeling. Symmetric mean absolute percentage error (sMAPE (%)) and mean absolute error (MAE (u)) are calculated for model evaluation, where u represents the time series unit. Table II shows numerical results obtained for one step ahead forecasting for in sample data, as well as one to eighteen steps ahead forecasting for the out of sample data. This kind of evaluation is just for having some idea of model performance. Table II also shows the global errors for a one step ahead forecasting over the entire historical data. Predicted values of NN3 102 and NN3 104 are depicted in Fig. 2. Because it is necessary to use all data available for predicting the future 18 values of the time series, a second training was performed. These future values are also illustrated in Fig 2. (a) Time series and predicted values
Real One step ahead 1 to 18 steps ahead Future 18 steps
6000
4000
2000
0
0
50
100
150
k
(b) Time series and predicted values
10000
8000
6000
4000 Real One step ahead 1 to 18 steps ahead Future 18 steps
2000
0
0
20
40
60
V. C ONCLUSION In this work, a constructive fuzzy system modeling was presented for building time series models. The constructive technique is based on the EM algorithm as well as in adding and pruning operations. These operators were applied to define automatically the model structure in an iterative batch learning process. The model was applied to forecast the NN3 102 and NN3 104 time series, which are part of the reduced data set at the NN3 Competition. Results showed an adequate modeling, as well as promising prediction results. ACKNOWLEDGMENT This work was partially supported by the Research Foundation of the State of S˜ao Paulo (FAPESP) and the Research and Projects Financing (FINEP). R EFERENCES
10000
8000
for the same time series, with a training set composed by input-output patterns from k = 4, . . . , 115, is composed by a total of 8 fuzzy rules.
80
100
120
140
k
Fig. 2. Multiple steps ahead: (a) Predictions for series NN3 102. (b) Predictions for series NN3 104.
As we can observe in Fig. 2, both models captured the dynamic of the series, and the future eighteen value seem to follow historical data adequately. From Table II, we can also observe that global errors decrease when the number of training patterns increases, since the model has more information for a better adjustment. It is also interesting to realize that, for a different training set, we can get a different time series model, as occurred for time series NN3 104, where the first model obtained is composed by M = 3 fuzzy rules, being its training performed with input-output patterns from k = 4, . . . , 97. On the other hand, the second model
[1] P. J. Brockwell and R. A. Davis, Introduction to time series and forecasting, 2nd ed. Springer, 2002. [2] G. Box, G. Jenkins, and G. C. Reinsel, Time Series Analysis, Forecasting and Control, 3rd ed. Oakland, California, EUA: Holden Day, 1994. [3] H. Abarbanel and M. Kennel, “Local false nearest neighbors and dynamical dimensions from observed chaotic data,” Physical Review E, vol. 47, pp. 3057–3068, 1993. [4] I. Luna, S. Soares, and R. Ballini, “Partial Mutual Information Criterion For Modelling Time Series Via Neural Networks,” Proceedings of the 11th Information Processing and Management of Uncertainty International Conference, July 2006. [5] A. Sharma, “Seasonal to internannual rainfall probabilistic forecasts for improved water supply management: Part 1 – A strategy for system predictor identification,” Journal of Hydrology, no. 239, pp. 232–239, 2000. [6] R. Jacobs, M. Jordan, S. Nowlan, and G. Hinton, “Adaptive Mixture of Local Experts,” Neural Computation, vol. 3, no. 1, pp. 79–87, 1991. [7] T. Takagi and M. Sugeno, “Fuzzy Identification of Systems and Its Applications to Modeling and Control,” IEEE Transactions on Systems, Man and Cybernetics, no. 1, pp. 116–132, January/February 1985. [8] W. Pedrycz and F. Gomide, An Introduction to Fuzzy Sets: Analysis and Design. MIT Press, Cambridge, MA, 1998. [9] B. Warner and M. Misra, “Understanding Neural Networks as Statistical Tools,” The American Statistician, vol. 50, no. 4, pp. 284–293, November 1996. [10] R. S. Tsay, Analysis of Financial Time Series, 2nd ed. Wiley & Sons, 2005. [11] J. D. Hamilton, Time Series Analysis. Princeton University Press, 1994. [12] Quantitative Micro Software, “Econometric Views 2.0,” 1995. [13] D. W. Scott, Multivariate Density Estimation: Theory, Practice an Visualization. John Wiley & Sons Inc., 1992. [14] I. Luna, S. Soares, and R. Ballini, “A technique for identifying time series models,” XVI Brazilian Automation Conference - CBA’06, October 2006.