converged network of GPON and 802.16. As part of a heterogeneous wired and wireless research network testbed, the benefits of closer cooperation between a.
A Control Bridge to Automate the Convergence of Passive Optical Networks and IEEE 802.16 (WiMAX) Wireless Networks S. Ou, K. Yang, M. P. Farrera, C. Okonkwo, K.M. Guild Department of Computing and Electronic Systems, University of Essex, Colchester, United Kingdom {smou, kunyang, mpared, cmokon, kguild}@essex.ac.uk Abstract - IEEE 802.16 and Passive Optical Network (PON) are two promising broadband access technologies for high-capacity wireless and wired access networks, respectively. In order to better understand the co-existence of both network technologies and to determine whether closer cooperation in the bandwidth provisioning process is advantageous, an access network that utilizes a Gigabit PON (GPON) to backhaul 802.16 network traffic is evaluated. Typical to many network deployments, the equipment is from different manufacturers and has different management and control interfaces. This paper proposes the use of a control bridge that overlooks the operations of both the GPON and 802.16 networks in order to: 1) provide dynamic QoS mapping so as to reduce traffic delivery cost; and 2) to improve overall channel utilization through coordinated dynamic bandwidth allocation. The performance of the converged network under the control of the proposed control bridge is evaluated in terms of cost of data delivery, channel utilization, and service differentiation.
Keywords - converged networks, IEEE 802.16 networks, Gigabit Passive Optical Network (GPON), fixed-mobile convergence (FMC), control bridge, quality of service (QoS).
I. INTRODUCTION IEEE 802.16 and Passive Optical Network (PON) are two promising broadband access technologies for high-capacity wireless and wired access networks, respectively. With high bandwidth capacity, large network coverage, strong QoS capabilities, cheap network deployment and maintenance costs, IEEE 802.16 is viewed as a disruptive wireless technology and has many potential applications [1]. Depending on the applications and network investment, IEEE 802.16 networks can be configured to work in two modes: point-to-multipoint (PMP) or mesh mode. In the PMP mode, a base station (BS) serves multiple subscriber stations (SSs) that are covered by the BS. In the mesh mode, SSs can communicate with each other in a multi-hop manner without direct intervention of BSs. In this paper, we assume the PMP mode of operation and consider the network scenario in which the BSs are connected to a GPON access network. A PON is a point-to-multipoint optical access network with no active elements in a path from source to destination. Its deployment topology can take different shapes such as bus, ring, and tree. The industry has selected time division multiplexing (TDM) for current PON deployments. We restrict ourselves to only TDM-PONs in this paper and particularly focus on GPON in this paper. However, similar This work was co-funded by the UK Technology Strategy Board (TSB) and Engineering and Physical Sciences Research Council (EPSRC) under the Heterogeneous IP Networks (HIPNet) project (EP/E002382/1).
principles also apply to Ethernet PON (EPON) networks. Although optical access networks provide highbandwidth and reliable service, they require mass deployment of fiber optics infrastructure to reach numerous end users, which results in significant investment for the operators. In addition, the provisioned connectivity is limited to an area that is covered by local area networks, which are usually homes or small business units. Wireless access networks, on the other hand, require less infrastructure deployment and can provide flexible and ubiquitous access connections for the end users. Therefore, a viable access solution would be to leverage the advantages of both technologies and to integrate PONs with 802.16 networks. This paper endeavors to make a first-step attempt towards this integration challenge via an experimental study. Integration can help enhance the rapid development of fixed mobile convergence (FMC) [3], thus reducing both CapEx and OpEx. As far as FMC is concerned, the existing efforts can be grouped into two main areas of research. One is concerned with the physical layer and is mainly focused on the transmission of radio signals together with base-band optical signals or so-called radio-over-fiber (RoF) [4]. The other of FMC activities are higher up in the protocol stack and are associated with convergence at the application layer. This work includes the employment of session initiation protocol (SIP) to provide seamless session connection across fixed and mobile networks [5]. In [6], the authors propose an optimal utility-based bandwidth allocation scheme for video-ondemand services over an integrated optical and IEEE 802.16 network. Here, the optical network concerned in their work is a SONET (synchronous optical networking) ring. Shen et al. [2] recently summarized the issues regarding the architecture raised in the integration of EPON and 802.16. Some brief but insightful discussions on the potential operation of the integrated networks were also presented in this paper. Our paper endeavors to design a control bridge that controls the internal medium access control (MAC) operations for a converged network of GPON and 802.16. As part of a heterogeneous wired and wireless research network testbed, the benefits of closer cooperation between a GPON backhaul network and subtended 802.16 BSs is currently being evaluated. Since these are commercial network products, customization of their dynamic bandwidth allocation algorithms is not possible, but certain parameters may be changed through a command line interface (CLI), simple network management protocol (SNMP) or web-based interface. This paper evaluates whether there is an advantage to having closer cooperation between the two network
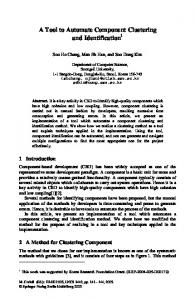
technologies through the use of a common piece of software or control bridge that has awareness and control of both the GPON and 802.16 networks. In this experiment, the control bridge is a piece of software that operates on a separate processor that has management interfaces to both GPON and 802.16 network elements. More details can be found in Section 2. The main purpose of this control bridge is to provide a unified and simplified means to simultaneously control certain operations of the converged network. The network control bridge allows the automation of multiple manual operations typical for operating both types of network elements. The control bridge also provides a set of Application Programming Interfaces (APIs) for more advanced network scenarios and operations in the future. The goal of this study is therefore to evaluate whether there is an advantage to having such close cooperation between the two network elements and whether the bridge enables the utilization of the bandwidth on both networks more efficiently, whilst simultaneously adhering to service level agreements (SLAs). This paper provides a set of performance evaluations of the converged network under the control of the proposed control bridge in terms of network throughput, delay, channel utilization, and service differentiation. The remainder of the paper is organized as follows: Section II presents the converged network testbed including the network parameter setting. Section III details the proposed control bridge with particular focus on its two key components: QoS (Quality of Service) mapping and bandwidth allocation control. Section IV illustrates the performance of the converged network under the control of the proposed control bridge on a real network testbed. Finally, Section V concludes the paper. II. THE CONVERGED NETWORK TESTBED In our network testbed, IEEE 802.16 networks are configured to work in point-to-multipoint (PMP) mode to provide network access to end users. In this mode, a BS serves multiple SSs that are covered by the BS. The GPON network in the testbed is based on the tree-based topology where transmission occurs between an optical line terminal (OLT) and multiple optical network units (ONUs). The OLT is connected to the core networks whereas each ONU is connected to one 802.16 BS via a fast Ethernet link (100Mb/s), as illustrated in Figure 1. Both GPON and 802.16 utilizes time-division multiple (TDM) for down-stream and time-division multiple access (TDMA) for upstream for all service types. GPON uses one wavelength for upstream and one for downstream whereas 802.16 utilizes time division duplex (TDD) to share the channel between upstream and downstream. A. GPON Settings GPON inherits a tree topology and hence the ONUs share the upstream channel between the splitter and the OLT. A framing of 125 us is used in both downstream and upstream. Fixed downstream frame size is utilized which makes clock synchronization easier. In the downstream, frames are sent by
broadcasting. Each downstream frame contains two parts: a Physical Control Block (PCBd) followed by a payload block. PCBd includes an upstream bandwidth map (BWmap) which defines at what time and for how long an ONU can access the upstream channel. An OLT implements a dynamic bandwidth allocation (DBA) algorithm which controls the upstream traffic by constructing the BWmap in each downstream frame. ITU DBA specification G.983.4 [8] specifies two different DBA mechanisms: status reporting and non-status reporting. With status reporting, ONUs regularly report their buffer status to the OLT and the OLT reserves bandwidth to ONUs based on the reports. With the non-status reporting method, the ONUs take a passive role and the OLT monitors the usage of previously allocated time slots. If previously allocated time slots to an ONU are not fully utilized, the OLT will reduce time slots in the next frame, otherwise, the OLT will increase time slot in the next frame. The response of non-status reporting to the bandwidth requirement is slower than statusreporting. In this paper, we consider the latter.
ONU
OLT
ONU
SS
BS
802.16 BS
... SS
Core
OLT
1:n splitter
ONU
VOD Client
802.16 BS
...
SS SS
VOD Server
ONU
Residential Building
Fig. 1 The Converged GPON and IEEE 802.16 Network Testbed
GPON does not transport Ethernet frames directly. Ethernet frames are encapsulated using GPON encapsulation method (GEM). Fragmentation of large Ethernet frames is allowed in GPON. GEM is identified by port where it is a basic unit to bind QoS parameters. Each GEM packet can carry either Ethernet traffic or TDM traffic. We only consider Ethernet traffic in this study. In GPON, QoS support is achieved by defining separated logic queues for each traffic flow in each ONU (by means of GEM Port-ID and Alloc-ID). The service class is defined by assigning each GEM queue to one of five types of transmission containers (T-CONTs) that follow different service policies. The five types of transmission classes are defined in G.983.4 [8]: 1) T-CONT 1 traffic is granted by fixed payload allocations. This is suitable for constant bit-rate (CBR) applications with strict demands for throughput, delay, and delay variation. 2) T-CONT 2 traffic is intended for variable bit-rate (VBR) traffic. The availability of bandwidth for T-CONTs traffic is ensured in service level agreements (SLAs), but the bandwidth is assigned only on request. This type of T-CONT is suitable for video and voice applications which have certain delay and throughput requirements. 3) T-
CONT 3 offers a guaranteed minimum transmission rate and any surplus bandwidth can be assigned on request. 4) TCONT 4 traffic is intended for best (BE) effort traffics. 5) TCONT 5 is a combination of the above four types of TCONTs. The GPON equipment used in the testbed are: one Ericsson (formerly Entrisphere) EDA 1500 (OLT) and three T050G ONUs. The OLT chassis consists of the following components: 1) two switch fabric node controllers working redundantly; 2) two 4-port GPON OLT cards; and 3) two 8port gigabit Ethernet cards. The gigabit Ethernet cards are used to interface to the Internet (via the core network). The passive optical splitter used is 1:32 ratio. Each ONU offers four 10/100Base-T and one 10/100/1000Base-T interfaces for data delivery. The wavelengths used are 1550 nm for the downstream and 1310 nm for the upstream. The transmission rates of downstream and upstream are 2.48832 Gbps and 1.24416 Gbps, respectively. The GPON OLT provides a command line interface (CLI) for GPON network management. This interface is utilized by our proposed control bridge to manage the GPON network. B. IEEE 802.16 Settings In 802.16 PMP mode, a centralized BS controls all communications between the SSs and the BS [1]. A transmission frame consists of a downlink and an uplink subframe. The lengths of these two sub-frames are adaptively adjustable. In a downlink sub-frame, the BS transmits a burst of MAC protocol data units (PDUs) using TDM; in an uplink sub-frame, an SS transmits a burst of MAC PDUs to the BS using TDMA. IEEE 802.16 supports both time-division duplexing (TDD) and frequency-division duplexing (FDD) modes. In the TDD mode, each MAC frame consists of a downlink subframe followed by an uplink sub-frame. In the FDD mode, uplink and downlink sub-frames are sent in different frequency channels. The uplink sub-frame is normally delayed with respect to the downlink sub-frame. This is due to the fact that the SS has to receive necessary uplink mapping information from the downlink so as to share the uplink channel with other SSs. In this study, we focus only on the TDD/TDMA transmission mode. In the downlink sub-frame, both the downlink map (DLMAP) and uplink map (UL-MAP) messages are transmitted, which defines the bandwidth allocations for data transmission in both downlink and uplink directions, respectively. Based on DL-MAP and UL-MAP, each SS knows the time slot and the duration of the data to be received from and transmit to the BS. The IEEE 802.16 standard which defines five types of scheduling services accommodating applications of different service requirements [8], includes Unsolicited Grant Service (UGS), real-time Polling Service (rtPS), extended real-time Polling Service (ertPS), non-real-time Polling Service (nrtPS) and BE. UGS is designed to support real-time applications (with strict delay requirements) that generate fixed-size data packets on a periodic basis for use in transporting T1/E1 and voice over IP (VoIP) services. Designed to support real-time
data streams, rtPS caters particularly to streams consisting of variable-sized data packets that are generated at periodic intervals, such as video. The key QoS parameters of this service type are minimum reserved traffic rate and maximum delay. ertPS is similar to rtPS but with a special focus on realtime services such as VoIP service with silence suppression. nrtPS is designed to support delay-tolerant data streams consisting of variable-sized data packets for which a minimum data rate is typically required, such as FTP applications. All other services that require no QoS guarantees are scheduled as BE. Different bandwidth requests and allocation schemes are utilized for different types of services. Each of these scheduling services has a mandatory set of QoS parameters that must be included in the service flow definition when the scheduling service is enabled for a service flow. The QoS parameters are defined in the 802.16 standard [1]. For UGS, the allocated bandwidth is fixed and the maximum sustained traffic rate is guaranteed. For polling services, the BS polls each SS in a pre-defined interval. The SS is only allowed to send its bandwidth request when it is polled. For BE services, all SSs can only send their bandwidth requests within a designated contention window. The IEEE 802.16 network testbed consists of one Airspan MicroMAXB BS (AS.MAX MicroMAX-SOC) and three SSs (AS.MAX ProST). Both the BS and the SSs offer four 10/100Base-T ports interfacing to wired networks. The BS and the SSs are installed in a non-line-of-sight manner. They work in PMP mode. Some main configuration parameters are listed in Table I: TABLE I. IEEE 802.16 NETWORK PARAMETERS Parameter Uplink and downlink frequency range: Multiple Access Scheme: Channel Bandwidth: Frame Duration: Cyclic Prefix: Maximum RF Channel per BS: Maximum SSs per RF Channel: BS maximum transmit level: Modulation supported:
Value 5.725 to 5.875GHz Adaptive TDMA 10MHz 10ms 1/4 –> 5.56us, 1/16 -> 1.39us 1X10MHz 256 +22dBm BPSK, QPSK, 16QAM, 64QAM
III. THE PROPOSED CONTROL BRIDGE A. Overview of the Control Bridge Control Bridge
Bandwidth Allocation Control
Control API Interface to higher level management entities, such as service managers
QoS Mapping
OLT Control Module
Interface to GPON OLT
BS Control Module
Interface to 802.16 BS
Fig. 2 System Architecture of the Proposed Control Bridge
Fig.2 depicts the system architecture of the proposed control bridge. Its main tasks are to provide QoS mapping and bandwidth allocation control. It has two interfaces connecting to the GPON OLT and the 802.16 BS, respectively. Since GPON and 802.16 are based on centralized controlling, the control bridge only needs to interact with GPON OLT and 802.16 BS. The control bridge also offers control application programming interfaces (API) to high-level management entity, such as service managers, for dynamic service provisioning. The OLT Control Module and BS Control Module are used to control the OLT and BS via the interfaces. The interface to GPON OLT is an embedded command line interface (CLI). CLI is a very common interface in most of networking devices. It is adequate for coarse granularity time control. The control bridge is able to perform the following tasks through the CLI: 1) dynamic QoS mapping; 2) dynamic bandwidth usage limitation at port (or logic port) level; and 3) dynamic resizing of granted bandwidth at the GEM level. The 802.16 base station in our testbed supports SNMP and web-based control interface. The interface to the BS is a SNMP client. The following tasks can be performed through the interface: 1) dynamic creation of service flows; 2) dynamic modification of the service flow identification; 3) dynamic resizing of granted bandwidth for UGS services at SS level; and 4) dynamic control maximum sustained bandwidth of a service flow. B. Dynamic QoS Mapping Though GPON and 802.16 have different definitions of the types of services, these service types also have many similarities. For instance, T-CONT 1 service is very similar to the 802.16 UGS service. In both GPON and 802.16, queues and their associated scheduling mechanisms are adopted to provide service differentiation. Therefore, QoS mapping is mainly represented by the corresponding queue mapping, as shown in Fig. 3. We can use the management interfaces to the GPON OLT and 802.16 BS to conduct a static pre-execution mapping and also dynamically change the QoS mapping in real-time depending on traffic and network conditions. Fig.3.a illustrates the overview of the QoS mapping under the control bridge’s control. User’s service data units (SDUs) flow into an SS’s classifier. The SS Classifier distinguishes the SDUs and puts them into the five different service queues. The classifier will be discussed in detail later. The SS requests bandwidth from the BS and the BS grants bandwidth to the SS. The SS schedules the service queues internally and forwards SDUs to the BS. Data packets are directly fed to an ONU. The ONU’s classifier categorizes the data packets and puts into four types of T-CONT queues. Finally, the ONU scheduler schedules and forwards the data packets to the OLT. The enforcement of the control bridge is carried out in two parts. The first is to dynamically define the classification rule in both GPON and 802.16. The second dynamically controls the bandwidth granting in the BS and OLT according to higher level service strategies, such as SLAs.
Control Bridge
GPON
802.16
ONU T-CONT Buffer
SS Queues UGS
T-CONT 1
ONU Scheduler
OLT
T-CONT 2
ONU Classifier
To ONU
ertPS BS
SS Scheduler
rtPS
T-CONT 3
BE SS BW Request
ONU BW Request
Control Flow Data Flow
a. QoS Mapping
DSCP EF AF4x AF3x AF2x AF1x BE
User SDUs
nrtPS
T-CONT 4
802.1Q/p User Priority 7 6 5 4 3 2 1 0
SS Classifier
802.16 Services UGS ertPS rtPS nrtPS BE
ONU T-CONT Buffer T-CONT 1 T-CONT 2
Classified by other parameters (such as source/destination MAC address, VLAN ID, IP protocol, etc.) b. An Example of Packet Classification in SS Classifier
T-CONT 3 T-CONT 4
802.16 Services UGS ertPS rtPS nrtPS BE
c. An Example of Packet Classification in ONU Classifier
Fig. 3 GPON and 802.16 Upstream Packet Classification and QoS Mapping
The classifiers in the SS and ONU are coordinated by the control bridge to ensure each data packet is treated coherently in both GPON and 802.16. The SS classifier distinguishes SDUs based on one or more parameters inside the SDUs. The parameters can be 802.1Q/p user priority, differentiated services code point (DSCP), source/destination MAC address, virtual LAN (VLAN) ID, IP protocol (for example UDP or TCP), IP source/destination address, layer 4 source/destination port (for example 22, i.e. SSH), etc. The classifier can only use one parameter or a combination of two or more parameters. Fig.3.b shows an example of packet classification in the SS classifier. The classifier maps 802.1Q/p user priority levels and DSCP traffic into the five 802.16 QoS service queues. In our testbed, we use VLAN ID to distinguish data packets. We assume that the data packets with same QoS requirements are marked by the same VLAN ID. In the ONU side, the five types of 802.16 service packets are further mapped into the corresponding T-CONT queues. An example of the mapping in ONU is illustrated in Fig. 3.c. The ONU requests bandwidth from the OLT and the OLT grants bandwidth to the ONU. The ONU scheduler then schedules the packets in the T-CONT queues and allocates them into T-CONTs for upstream transmission. The mapping between the T-CONT buffers and BS queues is based on VLAN IDs in our testbed. Note that the mapping is dynamically conducted by the control bridge based on some mapping algorithms. We will discuss how the dynamic mapping works and the benefits of the lowest-cost-first mapping algorithm in the next subsection. C. Lowest-Cost-First Mapping Algorithm The control bridge dynamically maps the QoS levels of the traffic in 802.16 and GPON. The dynamic mapping is ruled by mapping algorithms. In this section, we present a lowest-cost-first mapping algorithm. The cost here means user’s usage cost of getting their data packets delivered using
different types of services. We assume that packet delivery by different QoS queues incurs different costs. In 802.16 and GPON, delivery methods according to the QoS queues utilized are defined by two sets D802.16 = {BE, nrtPS, rtPS, ertPS, UGS} and DGPON = {T-CONT4, T-CONT3, T-CONT2, T-CONT1}, respectively. We define the cost as a function of the delivery method and the volume of the data packets being delivered. Let U represent the volume of the user data packets, the cost by delivery U as UGS service in 802.16 can be expressed by: C(UGS,U). Normally, we have C(UGS,U)>C(ertPS,U)>C(rtPS,U)>C(nrtPS,U)>C(BE,U)
and C(T-CONT1,U)>C(T-CONT2,U)>C(T-CONT3,U)>C(T-CONT4,U).
However, the cost of using different QoS services can be changed dynamically by service managers. It is assumed that the user’s data packets have specified QoS requirements. For example, in 802.16, each service flow has an associated QoS parameter setting which defines high and low level thresholds for its QoS requirements, such as maximum sustained traffic rate, minimum reserved traffic rate, minimum tolerable traffic rate, maximum latency and tolerable delay variation (jitter). Similarly in GPON, the QoS parameters are associated with T-CONTs. We use QoSmin(U) to represent the minimum QoS requirements of delivering user data U. The basic idea of the lowest-cost-first mapping algorithm is to dynamically map traffic to the QoS queues which has the lowest cost and, at the same time, to fulfil QoSmin(U). Using video streaming traffic as an example, it defines minimum tolerable traffic rate and tolerable delay variation. If both rtPS and nrtPS are fulfilled with these minimum requirements, then nrtPS will be selected by the algorithm and the control bridge will map the video streaming traffic to nrtPS service queue to save cost. Once the QoSmin(U) cannot meet the requirements due to increased nrtPS traffic, the algorithm will select rtPS and the control bridge will dynamically deliver the traffic using rtPS queue. This is the same in the GPON network. When the minimum QoS requirements are met, the algorithm always selects the lowestcost T-CONT type. Fig. 4 lists the lowest-cost-first mapping algorithm. The Lowest-Cost-First Algorithm Input: U – The volume of user data QoSmin(U) – The minimum QoS requirement of user data D – The set of delivery methods. D ∈{DGPON , D802.16 } Output: the delivery method with the lowest cost // the lowest cost 1. Clowest = 0; 2. dselected = null; // the selected delivery method 3. for each d ∈ D 4. Get system real-time QoS parameters of method d 5. if QoSmin(U) is met 6. if C(d, U) < Clowest 7. Clowest = C (d, U) 8. dselected = d 9. end if 10. end if 11. end for 12. return dselected Fig. 4 The Lowest-Cost-First Algorithm
In the algorithm, line 1 and 2 define two variables for keeping the current lowest cost and current selected delivery method. The for loop between line 3 and 11 checks all the delivery methods in the set D. Line 4 obtains system real-time QoS parameters of the method d. The obtained QoS parameters are compared with QoSmin(U). If the minimum QoS requirements are met (line 5), d becomes a candidate delivery method. The cost of using d to deliver user data, C(d, D), is then calculated. If C(d, D) is smaller than the current lowest cost Clowest (line 6), d becomes the current selected delivery method (line 8). Once all the methods in D are checked, the delivery method with the lowest cost will be selected. If the return method is null, it means that the user’s data cannot be delivered with the specified QoS requirement. The control bridge executes the lowest-cost-first algorithm periodically. It should be noted that the execution of the algorithm is based on the system’s real-time QoS parameters. Some system monitoring approaches can be employed to measure these real-time parameters for different service types. In our testbed, we designed a QoS measurement toolkit which consists of two standalone Linux applications: qos_probe and qos_statistic. The qos_probe runs in a Linux PC connected to the SS and the qos_statistic resides in another Linux PC connected to the OLT. The system clock of the two PCs is synchronized. The data packets sent by qos_probe are targeted on the PC running qos_statistic. The data packets are tagged with different VLAN ID in order to be classified by the SS classifier and ONU classifier. The QoS parameters of different delivery methods in the upstream direction are measured by using the toolkit. D. Dynamic Bandwidth Allocation Control Another main functionality of the control bridge is dynamic bandwidth allocation control. The control APIs for the control bridge provides a convenient means for service managers to change bandwidth provisioning in real-time. Here, the service manager is a management entity which has the knowledge of end users’ SLAs. A service manager can dynamically change the allocated bandwidth to a specified user. A real application case studied in our testbed is justenough bandwidth provisioning for profiled video-on-demand (VOD) services. This service is to provide just-enough bandwidth to VOD clients so as to increase overall bandwidth utilization. Since pre-allocated bandwidth is not always fully utilized, service providers often over-sell their bandwidth capacities. Providing over-subscribed bandwidth at the real network is achievable by dynamically adjusting the provisioned bandwidth to provide just-enough bandwidth to clients realizing statistical multiplexing. To dynamically control bandwidth provisioning, the control bridge needs to know the bandwidth requirement of each SS (at the BS) and each BS (at OLT). This is only suitable for the applications with their bandwidth requirement profiled, such as video-on-demand (VOD). In such applications, the bandwidth usage as a function of time for each video is known in advance and stored in a database associated with video content. The control bridge uses this
information to provision just-enough bandwidth according to the profile. VOD Server
Service Manager
Control Bridge
GPON OLT
802.16 BS
system signaling overhead. In our experiments, the granularity of the invocation interval is five seconds.
VOD Client (SS)
1. VOD service request 2. service granted/rejected 3. Invoke Control API to provide just-enough BW 4. Resize the CIR of the service flow 6. Inform VOD server to provide service to the client
5. Resize the max. BW allocated for the T-CONT
7. VOD service begins 8. VOD service ends 9. Invoke Control API to release BW
a. VOD service web page 10. Release allocated BW 11. Release allocated BW
Fig. 5 Dynamic Bandwidth Control
Fig. 5 illustrates the process of dynamic bandwidth control. A VOD client (an SS) opens the VOD web page (Fig. 6.a) and clicks on a link to request a video clip playback service. The service manager (Fig. 6.b) checks the SS’s SLA to confirm if the service is subscribed and if the bandwidth requirement of this VOD service has exceeded the amount allowed in its subscription. If the service request is rejected, the process ends. If the service request is granted, the service manager invokes the control bridge’s control APIs to provide just-enough bandwidth to the VOD service related service flow and T-CONTs. The control bridge is implemented as a Linux daemon (Fig. 6.c). The code for T-CONT resizing is listed below:
b. service manager
telnet.prompt = '#'; telnet.sendCommand("en"); telnet.sendCommand("config"); telnet.sendCommand("int " + lif); telnet.sendCommand("rate " + bw); telnet.sendCommand("exit");
where lif is a variable of the logic interface of T-CONTs, bw is the resized bandwidth (in the unit of kB). In the 802.16 BS, the committed information rate (CIR) of this VOD client’s service flow is resized according to the profile of the requested video clip. In the same way, the maximum bandwidth allocated to the T-CONT is resized. The service manger then informs the VOD server to provide the video stream to the client. Once the video clip ends, the client closes the VOD web page and informs the service manager about the termination of the VOD service. The service manager invokes the control APIs to release the allocated bandwidth in the OLT and BS. The above process is suitable for the video clips encoded as CBR. For the VBR videos, the step 3~5 will be invoked periodically accordingly to meet the video profile. The frequency the bandwidth resizing mechanism affects the bandwidth utilization. More frequent resizing achieves higher bandwidth utilization. However, frequent resizing will cause
c. control bridge daemon
Fig. 6 Screenshots of the Just-Enough Bandwidth Provisioning Case Study
IV. EXPERIMENT AND RESULT ANALYSIS In this section, we report some experiments carried out based on the proposed network scenario. We compare the performance of delivering different QoS services in the converged network with and without utilizing the control bridge in terms of packet delivery cost, packet delivery ratio, and channel utilization. Fig. 7 shows the setup of the experiment environment. Three ONUs are employed and each has a traffic generator
(TG) connected. The BS is connected to ONU 2 and the BS serves three SSs. Each SS has a TG attached as well. The VOD client is connected to SS 1. The purpose of using TGs is to generate enough traffic to test the system when saturated.
TG
TG
VOD Client
ONU 2
VOD Server
BS
OLT
(TG
TG
Traffic Generator)
ONU 3
TG
6
TG SS 2
SS 3
Fig. 7 Experiment Setup
A. Packet Delivery Cost The lowest-cost-first algorithm discussed in Section III-C is utilized by the control bridge for dynamic QoS mapping in order to reduce packet delivery cost while the minimum QoS requirements are still guaranteed. To verify this algorithm, we conducted an experiment by using following settings: • The volume of user packets is measured in megabit (MB). • The costs of delivering 1MB of user packets by using different delivery methods are: C(UGS,1)=5, C(ertPS,1)=4, C(rtPS,1)=3, C(nrtPS,1)=2, C(BE,1)=1 in the 802.16 network and C(T-CONT1,1)=4, C(T-CONT2,1)=3, C(T-CONT3,1)=2, C(T-CONT4,1)=1 in the GPON network. For simplicity, the tolerable delay was set to 300ms which is the only minimum QoS requirement of sending the user packets upstream from SS 1 to the OLT. An equal volume of background traffic was introduced from the TGs with different VLAN IDs in order to emulate different traffic priorities. We compare the delivery costs of delivering 5MB, 50MB and 100MB user packets. We tested the average packet delivery delay of UGS, nrtPS, BE services using different T-CONTs. The results as listed in Table II and III. (Note it is very interested to see that in our testbed the average delivery delay of T-CONT type 2 is smaller than T-CONT type 1 after saturation). TABLE II. AVERAGE PACKET DELIVERY DELAY IN IEEE 802.16 ( ms ) Traffic Load Service 1% 60% 90% 100% 120% 150% UGS 13 15 53 260 345 750 nrtPS 13 16 62 450 632 1920 BE 13 18 86 765 1050 2560 TABLE III. AVERAGE PACKET DELIVERY DELAY IN GPON ( µ s ) Traffic Load Service 1% 60% 90% 100% 120% 150% T-CONT1 180 180 182 440 445 2950 T-CONT2 182 182 182 352 430 440 T-CONT4 186 186 188 2554 4142 7462
Without using the control bridge, to fulfill the minimum QoS requirement, i.e., delay ≤ 300ms, in traffic load between
Average Packet Delivery Cost (per MB)
SS 1 TG
Without Control Bridge With Control Bridge, U=5MB With Control Bridge, U=50MB With Control Bridge, U=100MB
5.5 5 4.5 4 3.5 3 2.5 2 1.5
0
20
40
60 Traffic Load (%)
80
100
120
125
150
Fig. 8 Average Packet Delivery Cost
B. Packet Delivery Ratio 1 0.95 0.9 Average Packet Delivery Ratio
ONU 1
1% and 100%, only UGS can be used in 802.16 and any type of T-CONT can be used. As shown in Fig. 8, without using the control bridge, the cost of delivering user’s packets is fixed. When the system is not saturated, using the control bridge for dynamic QoS mapping results in the cost being largely reduced. Take the U=50MB as an example, the cost is reduced by 62 and 45% at a load of 60% and 90% respectively. It can be also observed that delivering larger amounts of user data in the specified minimum QoS requirement incurs higher cost.
0.85 Without Control Bridge With Control Bridge, U=50MB
0.8 0.75 0.7 0.65 0.6 0.55 0.5
0
25
50
75 Traffic Load (%)
100
Fig. 9 Packet Delivery Ratio
Packet delivery ratio is the ratio of packets received to packets sent. When the packet delivery ratio is 1, this means that there is no packet loss. Table IV and V lists the measured average packet delivery ratio in 802.16 and GPON networks TABLE IV. AVERAGE PACKET DELIVERY RATIO IN IEEE 802.16 Traffic Load Service 1% 60% 90% 100% 120% 150% UGS 1 1 1 1 0.97 0.82 nrtPS 1 0.99 0.98 0.93 0.77 0.60 BE 0.99 0.99 0.96 0.90 0.67 0.24
49% and 33%, respectively. After saturation, the channel utilization gain of using the control bridge is above 60%.
TABLE V. AVERAGE PACKET DELIVERY RATIO IN GPON Traffic Load Service 1% 60% 90% 100% 120% 150% T-CONT1 1 1 1 1 1 1 T-CONT2 1 1 1 0.96 0.87 0.83 T-CONT4 1 1 1 0.93 0.70 0.26
1
C. Channel Utilization
Channel Utilization (%)
0.8
Using the same experiment settings for the packet delivery cost (refer to Section IV-A), we measure the average packet delivery ratio. Fig. 9 shows the average packet delivery ratio for the cases with and without the control bridge are almost the same. This implies the control bridge not only reduces the delivery cost, but also maintains the same level of delivery ratio.
0.7 0.6 0.5 0.4 0.3 0.2 0.1
The dynamic bandwidth allocation control function provided by the control bridge aims to improve channel utilization. Without using the control bridge, the bandwidth allocated to the QoS queues (for example, UGS and T-CONT 1) may be wasted if it is not fully utilized. In Section III-D, we discussed a just-enough bandwidth allocation application for profiled videos. The bandwidth allocated is dynamically resized based on the video profile. Fig. 10 illustrates the bitrate profile of the example video ‘Finding Nemo’. Using a stored profile of the video, the control bridge resizes the bandwidth allocated to the specified VOD client so as to provide just-enough bandwidth for the video. In this experiment, all the TGs not only generate background traffic, but also run as a VOD client. 3e+06 2.5e+06 2e+06 Rate(bit/s)
Without Control Bridge (Maximum) Without Control Bridge (Average) With Control Bridge
0.9
0
0
25
50
75 Traffic Load (%)
100
125
150
Fig. 11 Channel Utilization
V. CONCLUSIONS This paper proposes a control bridge for converged GPON and IEEE 802.16 networks which provides a unified and simplified means to control certain operations of the converged network. The main functionalities of the control bridge are twofold: 1) to provide dynamic QoS mapping so as to reduce traffic delivery cost; and 2) to improve overall channel utilization through coordinated dynamic bandwidth allocation. Implementation details of the control bridge, the testbed and evaluation experiments are reported in this paper. The experimental results demonstrate that significant benefits can be attained when there is a dynamic and close cooperation in bandwidth allocation and QoS mapping across GPON/802.16 networks. REFERENCES
1.5e+06 1e+06 500000 0 0
500
1000
1500 Time(s)
2000
2500
3000
Fig. 10 The Bit-rate Profile of “Finding Nemo”
Channel utilization is defined to be the percentage of the bandwidth used to bandwidth capacity designed. Fig. 11 depicts the channel utilization of the testbed with and without use of the control bridge. Without using the control bridge, there are two ways to reserved bandwidth for the video: 1) allocate the maximum required bit-rate over the duration of the video, and 2) allocate the mean bit-rate to the video. It can be seen that the channel utilization is greatly improved by using the control bridge. The improvement is very obvious after saturation. When the traffic load is around 60%, the channel utilization of using the control bridge is increased by
[1] IEEE P802.16-REVd/D4, Part 16: Air Interface for Fixed Broadband Wireless Access Systems, Mar. 2004. [2] G. Shen, R. S. Tucker, C. Chae. “Fixed Mobile Convergence Architectures for Broadband Access: Integration of EPON and WiMAX”, IEEE Comm. Magazine, Volume 45, Issue 8, August 2007. pp.44 – 50. [3] M. Vrdoljak, S.I. Vrdoljak, G. Skugor. “Fixed-mobile convergence strategy: technologies and market opportunities”, IEEE Communications Magazine, Vol. 38, No. 2, Feb. 2000. Page(s): 116-121. [4] Z. Jia, J. Yu, A. Chowdhury, G. Ellinas, GK Chang. “Simultaneous Generation of Independent Wired and Wireless Services Using a Single Modulator in Millimeter-Wave-Band Radio-Over-Fiber Systems”, IEEE Photonics Technology Letters, Vol. 19, No. 20, Oct., 2007 [5] Siemens Ltd. “Fixed Mobile Convergence (FMC) Based on IMS”, April 2006. Available at: www.fixedmobileconvergence.net/whitepapers/fmcsiemens.pdf [6] P. Lin, C. Qiao, T. Wang, J. Hu. “Optimal utility-based bandwidth allocation over integrated optical and WiMAX networks”, Optical Fiber Communication Conference, March 2006 [7] C. Cicconetti, A. Erta, L. Lenzini, E. Mingozzi. “Performance Evaluation of the IEEE 802.16 MAC for QoS Support”, IEEE Trans. On Mobile Computing, Vol. 6, No. 1, Jan. 2007 Page(s):26 – 38. [8] ITU-T G.983.4, “A broadband optical access system with increased service capability using dynamic bandwidth assignment (DBA)”, 2001