A Convolutional Neural Network Approach for Face Verification Mohamed Khalil-Hani
Liew Shan Sung
VeCAD Research Lab., Faculty of Electrical Engineering Universiti Teknologi Malaysia 81310 Skudai, Johor, Malaysia.
[email protected]
VeCAD Research Lab., Faculty of Electrical Engineering Universiti Teknologi Malaysia 81310 Skudai, Johor, Malaysia.
[email protected] usually limited to a small number of categories (in the order of 100), hence they are unsuitable for applications with very large number of categories [1].
Abstract—In this paper, we present a convolutional neural network (CNN) approach for the face verification task. We propose a “Siamese” architecture of two CNNs, with each CNN reduced to only four layers by fusing convolutional and subsampling layers. Network training is performed using the stochastic gradient descent algorithm with annealed global learning rate. Generalization ability of network is investigated via unique pairing of face images, and testing is done on AT&T face database. Experimental work shows that the proposed CNN system can classify a pair of 46×46 pixel face images in 0.6 milliseconds, which is significantly faster compared to equivalent network architecture with cascade of convolutional and subsampling layers. The verification accuracy achieved is 3.33% EER (equal error rate). Learning converges within 20 epochs, and the proposed technique can verify a test subject unseen in training. This work shows the viability of the “Siamese” CNN for face verification applications, and further improvements to the architecture are under construction to enhance its performance.
The solution is to learn the similarity metric from the data, and this similarity metric can later be used to match new face images from faces of people not seen during training (i.e previously unseen categories) [1]. In [1] Chopra, Hadsell and LeCun proposed a viable solution to cope with the dilemma of requiring all categories to be seen during the training. This method employs a “Siamese” architecture of convolutional neural networks (CNN) that can learn similarity metric from training data, achieving a verification accuracy of 2.5% EER on unseen data with unknown categories. However, the technique has some shortcomings. Firstly, it was reported that they tested the network with unused image pairs in training set, together with image pairs from unknown subjects. This means that subjects used for testing were partially seen by the network during learning process. Secondly, due to the complex architecture of the CNNs – there are two here – the system is inefficient and the speed performance ineffective in applications with very large number of categories.
Keywords—face verification; convolutional neural network; Siamese architecture; convolution; subsampling
I.
INTRODUCTION
Face recognition has been a subject of intense research in recent years. Face recognition is normally categorized into two tasks: verification and identification. Face identification compares a facial image of an unknown subject to a face database of known individuals; that is, one-to-many matching. Face verification (or authentication), on the other hand, is to determine if two face images belong to the same person. This is a one-to-one matching in which the identity claimed by a person is accepted or denied. In general, the face verification task is more difficult than face identification because a global predefined threshold is required to make a decision that discriminates between the subjects. A common approach to this discriminative kind of problem is to apply distance-based methods, in which a similarity metric is computed based on distance between an input pattern and a claimed pattern. Conventional approaches that employ discriminative models use classifiers, such as neural network (NN) or support vector machine (SVM), to compute the similarities of two images. However, when applied in a non-linear classification problem such as face verification, these methods have limitations that include: (a) they require all the categories (subjects) to be known prior to training, (b) they also require that training examples must be available for all subjects, and (c) they are
In this paper, we focus on the problem of face verification, and address the limitations and shortcomings of existing methods mentioned earlier. We propose an improved version of the Siamese CNN architecture for the face verification task. We then optimize the design for resource utilization and processing speed. Our main contribution is two-fold. Firstly, we apply fusion of the convolution and subsampling operations, producing a simpler CNN architecture, which results in a design that has reduced design complexity, higher generalization ability with lower number of trainable parameters, and faster performance. Each CNN is reduced to only four layers, and further resource optimization is obtained by implementing 2D discrete cross-correlation, instead of the normal 2D discrete convolution operation in the convolutional layer. Secondly, we present a discriminative training scheme with unique pairing of face images such that we can match (test) just on image pairs of subjects unseen prior to training. The pattern pairs can be classified without the need to know all the categories before learning. These novel modifications significantly improve the design of the proposed face verification system.
This work is supported by UTM & MOSTI under the TechnoFund Grant No. 3H001.
978-1-4799-5313-4/14/$31.00 ©2014 IEEE
707
A. Related Work All existing methods for face verification begin by extracting features from two faces in comparison separately. Most traditional approaches use combinations of heuristic based feature extraction methods and trainable classifiers [2], [3]. The concept of Siamese architecture in neural network was introduced by Bromley et.al. for signature verification [11]. This Siamese architecture consisted of two identical networks with same set of weights, and was combined at their outputs. It was trained by feeding in a pair of patterns into the network, and the desired label was used to back propagate the error. Verification decision was made by comparing the signature to a chosen threshold value. The Siamese architecture gained serious attention from researchers when Chopra et.al. [1] replaced the subnets with convolutional neural networks and applied it to face verification problem. In this design, a similarity metric is learned from data, and the network is trained using contrastive loss function, which is derived from the discriminative learning framework for energy based-models (EBM). Ghiassirad et.al. in [4] proposed a new NN architecture named similarity convolutional neural network (SCNN) that has lower number of trainable parameters, higher processing speed, and performs well in smaller validation set, compared to Chopra’s solution. However, SCNN does not generalize well, implied by the large percentage of errors in testing set on the AT&T face database. Hadsell et.al. reapplied the Siamese architecture to learn an invariant mapping to the output manifold, and the proposed method outperformed other techniques [5]. Siamese architecture has been applied in many other applications [6-10] and often outperformed other methods. II.
A. Fused Convolutional and Sampling Layer Simard et.al. [13] first introduced the concept of fusing convolutional and subsampling layers in CNN for handwritten digit recognition. The main principle is to convolve with a stride (step size) of 2 or more on an input feature map with a convolution kernel. This is equivalent to a normal convolution operation followed by subsampling performed in a convolutional layer. The result is a significant performance speedup with the expense of a small overhead in total trainable parameters. The fusion of convolution and subsampling can be described by the equation: ()
()
( , ) =
=
( )
()
()
()
()
+ ,
+
()
(1)
()
+
()
( , )
( )
()
where ( ) denotes the activation function, and are the input and output feature maps, respectively; ( ) is the convolutional kernel weight, ( ) is the bias, represents the total number of input feature map, ( ) is the horizontal convolution step size, ( ) is the vertical convolution step size, () and ( ) are the width and height of convolutional kernels, respectively. In this work, the activation function applied is the scaled hyperbolic tangent: ( ) = tanh (2) where A denotes the amplitude of the function, and B determines its slopes at the origin. The values of A and B are chosen to be 1.7159 and 2⁄ 3 [1].)
PROPOSED ARCHITECTURE
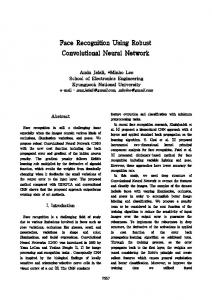
The proposed face verification system, as illustrated in Fig. 1, modifies the design of Chopra et.al. in [1], and make critical improvements in terms on network complexity, data preparation technique, and higher computational speed. A critical enhancement is the fusion of convolutional and subsampling layers of the CNN, resulting in a simpler fourlayer CNN architecture. EW
(a) ||GW (X1 ) - GW(X2 )|| Cost Module
GW(X1)
GW(X2 )
GW(X)
W
GW(X)
Convolutional Network
Trainable Parameters
Convolutional Network
(b) X1
X2
Figure. 2. Convolutional layer (a) Convolution (with stride of 1) followed by subsampling; (b) Convolution operation (with stride of 2)
Figure 1. Siamese Architecture.
708
Fig. 2 depicts the fusion of the convolutional and subsampling layers. In Fig. 2(a), a 5×5 convolution is performed on the input image followed by a 2×2 subsampling operation. The convolution is performed with a stride of 1. In Fig. 2(b), a convolution with a stride of 2 is shown, which generates a feature map of equivalent size, thus resembling an operation of convolution followed by subsampling.
parameters that minimizes a loss function. The loss function consists of two partial loss functions: one to decrease energy of similar pairs, and another to increase the energy if the pair is deemed dissimilar (known as contrastive loss function). This function is given as follows: ( , , , ) = (1 − ) ( ) + ( ) (6)
B. 2D Cross-Correlation The general equation for a 2D discrete convolution and 2D discrete cross-correlation are given by the following equations: ( , ) =
(3)
( + , + ) ( , )
(4)
( , ) =
( − , − ) ( , )
where is an input image, is the output image; is the kernel weight, and represent the width and height of convolutional kernel, respectively. It is clear from these equations that convolution and cross-correlation performs similar mathematical operations, except for the flipping of kernel coefficients in a convolution. This is illustrated in Fig. 3. This property is usually ignored in image processing tasks, as these filter coefficients are usually symmetrical. However, in a convolutional layer, the kernel coefficients (weights) are randomly initialized, hence contributing to different results between a convolution and a cross-correlation operation. Since a flipping operation generates more computations, resulting in higher logic utilization in hardware, we propose to replace the 2D discrete convolution operation with a 2D discrete crosscorrelation, hence easing the computational complexity.
(a)
(b)
(c)
Figure 3. 2D discrete convolution (a) Original convolutional kernel, (b) Convolution with flipped kernel, (c) Convolution with original kernel.
C. Energy-Based Learning In energy-based models (EBM), unnormalized energy is assigned to every possible configuration of the variables being modeled. Prediction is performed by searching the combination of variables that minimizes the energy. This energy can be associated with a trainable similarity metric, where lower energy corresponds to higher similarity, while distinct dissimilarity is represented by high energy. This relationship can be mathematically expressed as: ( ,
)=‖
(
)−
(
)‖
where and are the partial loss functions for genuine and imposter pairs, and represents the pair label (0 for genuine and 1 for imposter). In this paper, we apply the contrastive loss function from [1], which can effectively discriminate between genuine and imposter pairs. For a simpler computation, L1 norm (Manhattan distance) is chosen as similarity measure instead of L2 norm. The rationale is that the gradient of the energy (square norm) with respect to parameter would be negligible as the energy is near to zero, and the machine may fail to learn whenever the energy of imposter pair approaches zero. III.
EXPERIMENTAL WORK
The network architecture and training protocol are implemented in C on a Ubuntu 12.04 LTS OS platform, and compiled using native GCC compiler with optimization level 3. The network is trained on a PC with Intel Core i7 950 CPU (3.06GHz) with 6GB RAM. A. Data Preparation and Partitioning The AT&T face database (formerly called ORL) consists of 40 subjects, with 10 images of size 112×92 per subjects. Variations among the face images exist in terms of slightly varying illumination, upright frontal face position with tolerance for some side movement, facial expressions (open/ closed eyes, smiling/not smiling) and facial details (glasses/no glasses). We crop the input face image to a 92×92 window size, which is then resized to 46×46 size. Normalization is applied, scaling the pixel values to be within the range of −1 and +1 according to the equation: − ) =( − + (7) − where represents the input pixel value, and denote the upper and lower boundary values after normalization, and are the maximum and minimum pixel values in an input image, respectively. No other preprocessing operations are applied from here on. The face database is partitioned into two disjoint sets: one for training and the other for testing. The training set consists of 320 face images from 32 subjects, which are then paired to generate a total of 1440 genuine pairs and 49600 imposter pairs. The testing dataset is formed by pairing images from a set of 40 face images derived from 4 new subjects (that are unseen in training). This produces 180 genuine pairs and 600 imposter pairs for the testing set. Table 1 summarizes details of the training and testing datasets used in this work. In this work, as illustrated in Fig. 5, the image pairing to form the genuine and imposter pairs is done such that only unique pairs
(5)
( ) and where ( ) are generated after mapping and into low-dimensional space, and ‖ ‖ represents the similarity measure (Manhattan, Euclidean, etc.) EBM learns the similarity metric by searching for a set of trainable
709
are used. This means that the pairing between two identical face images (e.g. A1-A1) is avoided.
(a)
(b) Figure 4. Examples of image pairs for AT&T face database (a) genuine pairs; (b) imposter pairs
We also do not form pairing of two images with different pairing sequence, for instance, A1-B2 and B2-A1). We argue that this is a more accurate way to evaluate the verification performance of the system, for two main reasons. Firstly, genuine pairs of two identical images do not contribute to network learning, since no gradient is propagated. Secondly, adding these genuine pairs, like A1-A1, into the testing set will erroneously contribute to a larger number of correct matches (since the energy values for them are zeroes), thus giving an incorrect improvement in the verification accuracy.
(a)
Figure 5. Generation of image pairs (a) between images of same subject (b) between images of two different subjects
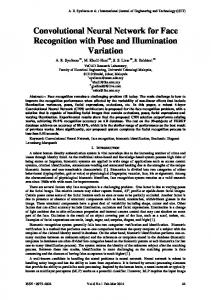
These feature maps are subsequently fed into second convolutional layer (C2) based on the connection scheme given in Table 2, and a 6×6 fused convolution/subsampling operations are performed. A total of 14 feature maps are produced in layer C2, which are then convolved with 6×6 trainable kernels, and fully-connected to 60 neurons in layer C3. Layer C4 is a fully-connected layer which consists of 40 neurons, with their values representing the output feature vectors. The output feature vectors from the two CNNs are used by the cost module which calculates the similarity between the two feature vectors, using L1 norm (Manhattan distance) described by the equation: ( , ) = ‖ ( )− (8) ( )‖
Consequently the total number of generated image pairs is lower than that of reference work of Chopra’s in [1]. Our aim is to evaluate the network performance correctly, without any prejudice due to these side effects. In the training process, we use all the genuine pairs found in training set, and use 1440 imposter pairs, randomly selected out of a total of 49600 pairs found in the training set. The rationale here is to provide a balanced ratio of genuine and imposter pairs to be learned by the network. The training pairs are shuffled in the beginning of every epoch to facilitate network generalization. TABLE I. Training and testing set for AT&T face database
( ) and where ( ) denote the output feature vectors ( , ) is the energy level of an input from the CNNs, and pair, which is essentially the Manhattan distance. The distance value is then compared with a predefined threshold value to determine if the pair is genuine or imposter. The optimal threshold value is obtained by finding the value that divides dataset into genuine and imposter pairs while minimizing FAR and FFR values. This usually refers to the threshold value where EER is obtained.
Dataset No. of subjects No. of images per subject No. of genuine pairs No. of imposter pairs
Training 32 10 1440 49600
(b)
Testing 4 10 180 600
B. Architecture Details and Training Protocol As illustrated in Fig. 6, the Siamese architecture consists of two identical CNNs with shared weights, which are then combined with a cost module that acts as a classifier. A pair of input images is fed into the system, one image for each CNN, and the cost module computes the similarity measure between these two images.
The Siamese CNN learns to discriminate between matched and mismatched pairs of face images based on the concept of energy based learning as discussed in Section II. TABLE II. Connection scheme between layer C1 and layer C2
The first convolutional layer (C1) performs 6×6 fused convolution/subsampling operations (convolutions with stride of 2), that generates 5 21×21 feature maps.
C1
710
0 1 2 3 4
0
1
× × ×
× × × ×
2
× × × ×
3
× × ×
4
× ×
5
6
×
× ×
×
C2 7
× × ×
8
× × × ×
9
× × × ×
10
× × ×
11
× ×
12
13
×
× × × × ×
×
IV.
RESULTS AND DISCUSSIONS
There are several tunable parameters that affect the overall performance of Siamese CNN, i.e. filter sizes and number of feature maps in CNN architecture; weight initialization; and lastly learning rate. We have explored several different CNN architectures, starting from large CNNs, and keep reducing the number of feature maps in each layer until reaching an optimal architecture where it still achieves comparable performance. In the case of weight initialization, we have tried uniform and Gaussian distributions, and Gaussian distribution with zero mean and standard deviation of 0.05 is chosen as our weight initialization method. As for learning rate, we choose among these values for the three parameters: = {10 , 5 × 10 , 10 , 5 × 10 , 10 } ; = {0.5,0.6,0.7,0.8,0.9} ; and = {10 , 5 × 10 , 10 , 5 × 10 , 10 } . The bestperforming combination is used to train the network. The classification performance of the proposed architecture is evaluated on the test set consisting of a total of 780 facial image pairs (180 genuine and 600 imposter pairs). An optimum threshold value is defined based on the energy distribution of genuine and imposter pairs. An input image pair is classified as genuine pair if the energy level is lower than the threshold value, otherwise it is classified imposter. Fig. 7 visualizes the output of feature maps at different layers in Siamese CNN for a training pair. Complex features are extracted from the input image in layer C1, which produces a total of 5 feature maps representing different extracted features of the face image. Convolutions are performed on these complex features to produce 14 simpler feature maps in layer C2 by using 36 learned convolution kernels. A full connection between feature maps in layer C2 and C3 indicates a total number of 840 convolutions to produce one-dimensional pixels in layer C3. A series of neuron outputs from a single CNN is obtained by passing the output of layer C3 through a fully-connected layer F4, which represents a feature vector of that particular face image. This feature vector is then used to verify a person’s identity by using similarity measure (L1 norm).
Figure 6. Proposed network architecture
The contrastive loss function used to learn the similarity metric is given by the equation: ( , , , ) = (1 − ) ( ) + ( ) . 2 (9) = (1 − ) ( ) + ( )2 where denotes the margin of highest possible energy (in this case, = , where represents total number of neuron outputs in layer F4). is the output of the cost module, and it corresponds to the energy level. Training using this loss function decreases the energy level for a matched pair, while increasing the energy level when face images of two distinctive (different) subjects are presented to the network. Ideally, all genuine pairs will produce low energy levels, while high energy levels correspond to imposter pairs. We randomly initialize the network weights and biases based on Gaussian distribution, with mean value of 0 and standard deviation of 0.05. The proposed Siamese CNN system is trained using stochastic first order gradient descent method with annealed learning rate based on number of training epochs. The annealed global learning rate is defined by the equation:
From Fig. 8, it can be observed that in the initial epochs, the mean energy loss of the training set is higher than that of the testing set. A simple explanation is that the total number of training pairs is greater than the testing pairs. During initial training epochs, it is believed that many offending training pairs (i.e. training pairs that are ambiguous to the network) are not well learned by the network yet, and these training pairs contribute to higher energy losses in the learning phase. The training continues until the training losses start to stabilize, which signifies that the neural network is about to meet its convergence. The condition holds until a certain point where the training loss is still decreasing, but the testing loss starts to rise up again. This is the situation where the neural network is said to be over-trained. Therefore, countermeasures should be taken in order to ensure the network performance while not affecting its generalization capability. In this work, we apply early-stopping to avoid the over-fitting problem.
=0 (10) < × ℎ where denotes the fading factor of global learning rate, is maximum (initial) global learning rate, and is minimum global learning rate. In this paper, we set the fading factor = 0.7, = 10 and = 10 . The learning rate value is updated after every training epoch. No other learning parameters such as momentum and weight decay are incorporated into the learning process, hence reducing the total parameters that need to be tuned. =
711
Figure 8. Training and testing performances of Siamese CNN
.
Figure 7. Outputs of the layers in Siamese CNN for an image pair
In biometric verification, the established technique to evaluate system performance is based on its equal error rate (EER) on test dataset. The EER is defined as the error rate when false acceptance rate (FAR) and false rejection rate (FRR) are equal. Fig. 9 depicts the distribution of genuine and imposter energy values (L1 norm) in both training and testing datasets. In ideal conditions, the genuine and imposter energy values are separable by a distance, which indicates that the system is performing correctly during verification.
(a)
However, a biometric system usually suffers from difficulties in verifying enrolled images, hence tradeoff between FAR and FRR should be considered in designing a biometric system, and we take EER value into consideration when evaluating the verification performance of the Siamese CNN. Referring to the receiver operating characteristic (ROC) curve shown in Fig. 10(b), we achieved EER of 3.33 % on testing set for AT&T face database. This EER value is based on verification of image pairs from unseen subjects during training. Ideally, the ROC curve should be as close as possible to the left and top edges of the graph, which indicates a very good tradeoff between false acceptance and false rejection. The proposed network architecture performs significantly better on training set compared to testing set, which is common for neural networks, since the network parameters (weights and biases) are fine-tuned based on these training samples. Table 3 shows FRR values obtained on training and testing sets for different corresponding FAR values.
(b) Figure 9. Distribution of genuine and imposter energy values in (a) training set (b) testing set TABLE III. FRR values for different FAR in training and testing sets
Dataset FRR values (%)
712
Training Testing
2.50 1.18 5.56
FAR values (%) 5.00 7.50 0.28 0.00 2.78 1.67
10.00 0.00 1.11
were based on combination of both seen and unseen subjects during network training. Subjects used for testing were partially seen by the network during learning process (they tested the network with unused image pairs in training set, together with image pairs from unknown subjects). The network was tested with 500 genuine pairs and 2000 imposter pairs from unknown 5 subjects, plus 2000 unused image pairs from 35 subjects in training set. In our work, we perform testing only on the image pairs of unseen subjects prior to training phase (180 genuine pairs and 600 imposter pairs from unknown subjects), since our aim is to evaluate the robustness of the Siamese network architecture in verifying images from unknown subjects.
(a)
(b) Figure 10. ROC curve of proposed method on (a) training set (b) testing set (a)
Fig. 11 shows the differences in speed performance of the proposed Siamese CNN against Chopra’s in [1]. Our network performs significantly faster than Chopra’s; 3.58× better in processing a single image pair. This is mainly due to two factors: (1) simplicity of the architecture, and (2) the sequential execution of subnets in Siamese CNN which doubles the processing time. The speed difference becomes apparent for a single training epoch and testing epoch. The performance speedup obtained is crucial in increasing the throughput of face verification, especially when applied in the face identification problem. In general, this research is basically inspired by previous work done in [1] on energybased learning, but with a number of differences. Firstly, we replaced a cascade of convolutional and subsampling layers with a simpler fused convolutional layer to achieve greater speed up, and evaluate the effect of such modification on face verification performance. Our network consists of 34487 trainable parameters and 171601 connections (one subnet); 33610 parameters and 525409 connections in a 6-layer Siamese CNN with same number of feature maps in each convolutional layer (3x more connections); and 333308 parameters and 4018350 connections in network proposed by Chopra et.al. (23.4x more) Our simpler architecture processed an image pair 3.6 times faster than the 6-layer Siamese CNN, as shown in Fig. 11(a). Secondly, 2D cross-correlation is applied instead of convolutions, which reduces computation time. Next, we performed on unique pairing of face images as opposed to the previous work, which eliminated the side effects of repeated image pairs on the performance evaluation of the system, but with expense of reduction in total number of generated image pairs. Finally, in [1], the verification results
(b) Figure 11. Average processing time of two different architectures for (a) a single image pair (b) a single training epoch and testing epoch TABLE IV. Benchmarking with previous related works (a) Distribution of dataset; (b) Verification performance
Reference
Year
Ghiassirad [4] Hen [14] Nazeer [15] Wang [16] Chopra [1] Rowshan [3] Chan [2] Marcialis [17]
2012 2007 2007 2007 2005 2008 2010 2002
(a) Distribution of dataset Training Testing Subj Img Subj Img 10 5 10 5 40 4 40 2 40 5 40 5 40 5 40 5 35 10 40 10 40 5 40 5 40 5 40 5 40 5 40 5
Subjects seen during training No Yes Yes Yes Partially Yes Yes Yes
2014 32 10 4 10 This work No Note : Subj = No. of subjects; Img = No. of images per subject
713
(b)
biometrics to prune the database, making it suitable for application in a face identification system. Finally, the Siamese architecture can be targeted for parallel hardware implementation to achieve significantly higher performance speedup due to the parallel execution of the individual CNN.
Verification performance (%) FAR FRR EER
Reference
Year
Method(s)
Ghiassirad [4]
2012
SCNN
5.0 7.5 10.0
33.0 29.0 26.0
-
Hen [14]
2007
Gabor, PCA& SVM
-
-
4.0
Nazeer [15]
2007
PCA + ANN
4.4
4.5
-
0.1 1.0 4.7 5.0 7.5 10.0
22.5 5.5 1.0 1.0 1.0 0.0
2.7 2.5 -
Wang [16]
2007
LDA + ICA + 2DLDA + CDA
Chopra [1]
2005
Siamese CNN
Rowshan [3]
2008
PCA + CSLDA + fuzzy inference
-
-
0.7
Chan [2]
2010
LDA + BPNN
-
-
0.6
Marcialis [17]
2002
PCA + LDA + “mean” algorithm
-
-
0.1
This work
2014
Proposed method
-
-
3.3
ACKNOWLEDGMENT This work is supported by Universiti Teknologi Malaysia (UTM) and the Ministry of Science, Tech. & Innovation of Malaysia (MOSTI) under the TechnoFund Grant No. 3H001. REFERENCES [1]
[2]
[3]
Table 4 gives the benchmarking results of our work on AT&T database. It shows that our design has outperformed some reported results. The research works that gave better performances were based on different performance evaluation criteria. The main difference between our approach and others is that we restricted testing only to subjects unseen during training, as opposed to other works which tested their methods with images from the same subjects used in training. This boosted their overall verification performance since the classifiers are able to discriminate between different subjects based on information acquired from these subjects during training. An ideal face verification system should be able to compare images from two unknown subjects based on generalized information obtained from other faces.
[4]
[5]
[6]
[7]
[8]
[9]
V.
CONCLUSION AND FUTURE WORK
[10]
In this paper, we explore various optimizations that can be applied on the Siamese CNN architecture to reduce overall computation time. These include fusion of convolutional and subsampling layer, filtering using 2D cross-correlation instead of convolution, and reduction in total feature maps. The efforts are aimed towards achieving high speed performance of the network itself. We have applied the contrastive loss function to learn discriminatively between genuine and imposter image pairs, and have performed training on AT&T face database. Our proposed approach shows comparable classification performance to the Chopra’s original Siamese CNN. For future work, the performance of Siamese CNN will be further improved by modifying the network architecture, for example, by applying max-pooling layer or spatial match layer. Stochastic learning with dropout method may produce a more robust face verification system as well. The viability of Siamese CNN will be investigated on more challenging face databases. It is also proposed to enhance the proposed face verification method to work in conjunction with soft
[11]
[12] [13]
[14]
[15]
[16]
[17]
714
S. Chopra, R. Hadsell, and Y. LeCun, "Learning a similarity metric discriminatively, with application to face verification," in Computer Vision & Pattern Recognition, 2005. CVPR 2005. IEEE Computer Society Conference on, 2005, pp. 539-546. L.-H. Chan, S. Salleh, C.-M. Ting, and A. K. Ariff, "PCA and LDAbased face verification using back-propagation neural network," in Information Sciences Signal Processing and their Applications (ISSPA), 2010 10th International Conference on, 2010, pp. 728-732. B. R. Rowshan, M. Bin Khalid, and R. Yusof, "Multi-level fuzzy score fusion for client specific linear discriminant analysis based face authentication system," in Signal Image Technology and Internet Based Systems, 2008. SITIS '08. IEEE Int. Conf. on, 2008, pp. 213-220. H. Ghiassirad and M. Teshnehlab, "Similarity measurement in convolutional space," in Intelligent Systems (IS), 2012 6th IEEE International Conference, 2012, pp. 250-255. R. Hadsell, S. Chopra, and Y. LeCun, "Dimensionality reduction by learning an invariant mapping," in Computer vision and pattern recognition, 2006 IEEE Computer Society conf. on, 2006, pp. 1735-1742. H. Mobahi, R. Collobert, and J. Weston, "Deep learning from temporal coherence in video," presented at the Proceedings of the 26th Annual Int.l Conf. on Machine Learning, Montreal, Quebec, Canada, 2009. W.-t. Yih, K. Toutanova, J. C. Platt, and C. Meek, "Learning discriminative projections for text similarity measures," presented at the Proc. of the 15th Conf. on Computational Natural Language Learning, Portland, Oregon, 2011. V. Nair and G. E. Hinton, "Rectified linear units improve restricted boltzmann machines," in Proceedings of the 27th International Conference on Machine Learning (ICML-10), 2010, pp. 807-814. M. Jahrer, M. Grabner, and H. Bischof, "Learned local descriptors for recognition and matching," in Computer Vision Winter Workshop, 2008. E. J. Humphrey, A. P. Glennon, and J. P. Bello, "Non-linear semantic embedding for organizing large instrument sample libraries," in Machine Learning and Applications and Workshops (ICMLA), 2011 10th International Conference on, 2011, pp. 142-147. J. Bromley, J. W. Bentz, L. Bottou, I. Guyon, Y. LeCun, C. Moore, et al., "Signature verification using a “Siamese” time delay neural network," International Journal of Pattern Recognition and Artificial Intelligence, vol. 7, pp. 669-688, 1993. P. Baldi and Y. Chauvin, "Neural networks for fingerprint recognition," Neural Computation, vol. 5, pp. 402-418, 1993/05/01 1993. P. Simard, D. Steinkraus, and J. C. Platt, "Best practices for convolutional neural networks applied to visual document analysis," in ICDAR, 2003, pp. 958-962. H. Yap Wooi, M. Khalid, and R. Yusof, "Face verification with Gabor representation and support vector machines," in Modelling & Simulation, 2007. AMS '07. First Asia Int. Conf. on, 2007, pp. 451-459. S. A. Nazeer, M. Khalid, N. Omar, and M. K. Awang, "Performance evaluation of face verification: a comparative study on different classifiers," 2007. W. Chengbo, L. Yongping, Z. Hongzhou, and W. Lin, "Classifier discriminant analysis for face verification based on FAR-score normalization," in Foundations of Computational Intelligence, 2007. FOCI 2007. IEEE Symposium on, 2007, pp. 476-480. G. Marcialis & F. Roli, "Fusion of LDA and PCA for face verification," in Biometric Authentication. vol. 2359, M. Tistarelli, J. Bigun, and A. Jain, Eds., ed: Springer Berlin Heidelberg, 2002, pp. 30-37.


![[PDF] Face Recognition: A Convolutional Neural Network Approach](https://m.moam.info/img/260x300/pdf-face-recognition-a-convolutional-neural-networ_59dabb821723ddbafcf79304.jpg)