A Cordon and Search Model and Simulation using Timed, Stochastic, Colored Petri Nets for Robust Decision-Making Paul Maxwell1,3, Anthony A. Maciejewski1, Howard Jay Siegel1,2, Jerry Potter1
ISTeC People-Animals-Robots (PAR) Laboratory Electrical and Computer Engineering Department 2 Computer Science Department Colorado State University, Fort Collins, CO 80523-1373 USA 3 United States Army
[email protected] 1
Keywords: robustness, search, Petri Nets.
decision-making,
cordon
and
Abstract In the current military operating environment, cordon and search missions (village searches) are conducted daily. It is expected that this mission profile will not change in the near future. Despite the frequency of this mission type, the planning tools available to military leaders are rudimentary and tedious. Planners must rely on over-simplified data tables and personal experience when planning a cordon and search. Computer tools to facilitate faster, more accurate plans do not yet exist. This paper proposes a timed, stochastic Petri Net model for cordon and search missions that can provide planners valuable mission insight using Monte Carlo simulation methods. This model can be used by military leaders to make robust decisions during mission planning and thus improve the quality of the final plan. 1.
INTRODUCTION
In the fast paced, dynamic world of military operations, cordon and search missions (a.k.a. village search) are conducted daily to capture insurgents, secure villages, and confiscate contraband. These missions are complex, and the planning for them involves allocating search resources to target buildings in a manner that efficiently achieves the mission objectives. It is a difficult task to make accurate, feasible plans. This requires knowledge of the search resources involved (e.g., size of the team, team composition, team search rate), the target buildings (e.g., area, location, disposition of inhabitants), the weather (e.g., precipitation, temperature, humidity), and other parameters. Frequently, a unit tasked with a village search mission is given a time
This research was supported by the National Science Foundation under grant numbers CNS-0615170 and CNS-0905399, and by the Colorado State University George T. Abell Endowment.
ISBN: 1-56555-342-X
constraint for the completion of the mission. This constraint affects the development of the plan and the manner in which it is conducted. To add to the complexity of the planning, participating elements can include: soldiers, Military Working Dogs (MWD), Explosive Ordinance Detachments (EOD), military aircraft, Unmanned Aerial Vehicles (UAV), and electronic surveillance. Given these difficult planning factors, it is a complex problem to create plans for a cordon and search mission that are robust against environmental uncertainties. This problem is being addressed by the ISTeC People, Animals, Robots (PAR) laboratory [8]. Despite the frequency and difficulty of developing cordon and search plans, military planners currently rely on simplistic data tables from military Field Manuals (e.g., [9], [10]) and personal experience to conduct analysis of the mission during the planning phase. The result is plans that vary dramatically in accuracy and quality and therefore the risk to service members is higher than desired by leaders. The variability in accuracy is due to dependence on the quality of the inputs and the calculation methods used by the user. The variability in quality is due to users‟ cognitive abilities and past experiences that can have a positive or negative effect on the quality of the result. An automated tool using Petri Nets [5] can improve the mission planning process and can help produce more robust plans. The proposed automated tool would allow: (a) the input of the search area via imagery or shape files, (b) the automatic generation of the Petri Net village model, (c) the input of user selected data, and (d) the analysis of the search mission using stochastic models. The tool would accomplish these tasks within the time constraints of the planning process. The long term goal for this tool is to allocate search resources (e.g., humans, MWDs, EOD, UAVs) to tasks (e.g., building searches), and to calculate the robustness for a resource allocation (the probability of mission completion within the time constraint).
11
The use of Petri Nets to model and simulate the cordon and search environment can result in more accurate, robust mission plans with reduced risk to service members and can provide valuable data to decision-makers during the planning process. Petri Nets are capable of creating detailed models of a cordon and search mission that account for the uncertainties in the environment. Specifically, timed, stochastic, colored Petri Nets provide the ability to model concurrency in the mission and to introduce stochastic information into the simulation. The choice of parameters represented by stochastic information can vary depending on user preference but can include any quantifiable influence on the mission (e.g., temperature, probability of enemy contact, precipitation). Current military combat simulations are in general knowledge or rules based and deterministic ([11], [16]). Combat is inherently stochastic and thus many current simulations have limitations due to these design choices. Simulations that use stochastic information exist but they do not use that information to derive robust resource allocations. Petri Nets can model the stochastic variables of the mission and incorporate constraints typically used in the missions (e.g., unit boundary lines, phase lines, direction of attack) into the solution. Then, using Monte Carlo methods, the Petri Net simulation results can be used to build probability mass functions (pmfs) for the search mission and these pmfs can provide information about the robustness of a given plan (resource allocation) to military leaders. The main contribution of this paper is a novel timed, stochastic, colored Petri Net model for cordon and search missions that can simulate the search environment including its uncertainties. Additionally, we demonstrate how the results of the simulations can be used via Monte Carlo methods to analyze the robustness of resource allocations and provide robust information to decision-makers. Specifically, the pmfs that result from the Monte Carlo simulations allow an objective comparison of specific resource allocations and thus the selection of an acceptable mission plan. This paper assumes that the probability distribution functions (pdfs) for the quantities that are uncertain in the cordon and search environment can be developed. The definition of these pdfs is a separate research problem and is not addressed here. Additionally, the model assumes that only one search team is used per target building. Future research on this problem will remove this assumption. The remainder of the paper is organized as follows. Section 2 reviews related work in the fields of Petri Nets and military combat simulations. A review of Petri Net basics and a detailed description of our Petri Net cordon and search model is in Section 3. Background on robustness research and its application to the Petri Net model is in Section 4. In Section 5, the simulation set-up is described
ISBN: 1-56555-342-X
and results are presented. We present our conclusions in Section 6. 2.
RELATED WORK
Numerous models and simulations have been created for combat and other military requirements. These range from theater level simulations that train high-level staffs to game-type simulations that provide realistic simulations for squad/crew-level service members. These simulations are generally deterministic and are focused on simulating combat for analysis of different plans or for basic tactics training. As a result, the field of stochastic simulations has a lot of room to explore. The work of [16] focuses on simulations of basic tactical scenarios. The goal of the authors is to use artificial intelligence algorithms to create human agents that behave “realistically” in a computer simulation of a Military Operations in Urban Terrain (MOUT) environment. They use hierarchical Finite State Machines to generate the agent behavior and thus the model is deterministic. A graphical simulation is found in [11] that simulates combat at the operational level. Here the tool uses a graphical interface that allows planners to input mission parameters and then observe the results of the simulation. The purpose of the tool is to allow a quick comparison of different courses of action and thus provide planners and leaders with valuable data for the decision-making process. The tool uses a rules based system in its simulation engine and does not account for stochastic variables. The research of [12] is another planning/decision support tool. This simulation environment is a strategic/operational-level analysis tool that uses mixed linear programming and stochastic sampling of pdfs to evaluate mission plans for the Air Force. The tool attempts to optimize a mission plan through cycles of simulation and evaluation. This simulation does incorporate stochastic elements to account for uncertainty but only for the purpose of determining point values for model elements (e.g., damage, combat durations, force ratios). Similarly, the authors of [4] use stochastic information in their mission plan simulation engine. Their work samples pdfs to calculate values including the duration of combat, the probability of winning, and the expected number of casualties. The goal of the work was to create a combat simulation that differed from the standard deterministic models and that would provide more accurate results. Their work does not attempt to develop resource allocations or to compare courses of action. The field of Petri Net research is well developed. Many researchers have applied Petri Nets to the simulation of production environments, computers and their networks, and even resource allocation [5]. The ability of Petri Nets to
12
model concurrency, interdependencies, and conflict are very useful in these and many other domains. The optimization of production lines is an important area of research (e.g., [6], [13]). Determining the most productive allocation of resources (e.g., machines, workers, raw materials) is valuable to industry. Petri Nets can be used to study the optimum levels of resources required and the effects of changing these levels as in [6]. The work of [13] proceeds beyond these basic simulations and uses heuristics to prune Petri Net coverability trees for the purpose of optimizing production systems. In contrast with our work, these studies are deterministic or use a mixture of deterministic and stochastic information. Petri Nets also have been used to schedule tasks in military scenarios in work such as [18]. In that work, colored Petri Nets are used to schedule operational/strategic level tasks that meet mission goals and the commander‟s intent. Unlike our work though, this tool uses deterministic methods to compare courses of action. The simulation checks resource requirements against mission types and incorporates timing values to determine plan feasibility. It is a decision-making aid for staffs but it does not evaluate robust resource allocations. 3.
PETRI NET CORDON AND SEARCH MODEL
3.1. Petri Net Basics Basic Petri Nets are a graphical tool to formally describe systems. They are good at modeling concurrency, synchronization, causality, and mutual exclusion. A basic Petri Net is a four-tuple (P, I, O, T) where P is the set of places, I is the input function, O is the output function, and T is the set of transitions. If transitions are removed from a Petri Net, then the result is a directed graph. Places can describe system state information in Petri Nets, while transitions describe events that modify the system state. Arcs, described by the I and O functions, specify relationships between states and transitions. They are directed and exist only between places and transitions. Tokens specify state (marking), physical data, or information. Transitions are said to be “enabled” if a token exists at every input place to the transition. Transitions “fire” atomically once they are enabled. Tokens are consumed by transitions from the input places and created at the output places when fired. The number of tokens consumed/created is determined by the number of input/output arcs connected to a transition. Basic Petri Nets have been extended to include hierarchy, time, stochastic elements, and color. Hierarchy allows the reuse of system components and facilitates simpler representations. The extension of time allows Petri Nets to model systems that require timing to properly represent them. The addition of stochastic elements provides the ability to represent uncertainty in models.
ISBN: 1-56555-342-X
Finally, color allows tokens to have information associated with them, places to have data types, and for transitions and arcs to have expressions (e.g., conditionals, rules). Together, these extensions allow Petri Nets to model a variety of systems and properties. A timed, stochastic, colored Petri Net is a nine-tuple, CPN = (P, A, T, Σ, V, C, G, E, I) [5]. Rather than use this formal Petri Net notation, we will discuss our model in terms of the application domain. 3.2.
Cordon and Search Model
A cordon and search mission can be modeled by a timed, stochastic, colored Petri Net. We will refer to this Petri Net model as the cordon and search model (CSM). The power of the Petri Net system allows for uncertainty, heterogeneous search resources, graphical control measures, and additional elements to be modeled and simulated in the system. The CSM assumes (though it is not reliant on the assumption) that the underlying Petri Net structure can be automatically generated from input images or shape files of the target area and user inputs (e.g., mission constraints, number and type of search teams, intelligence data). In the CSM, the set of places contains the search resources‟ starting points, the target buildings (Tj), and portions of the village road structure denoted as road segments (RSk). The set of transitions contains the stochastic timing and decision elements that calculate the time to search target buildings, the time to move along a road segment, expressions for randomly selecting target buildings, etc. These elements are described in more detail in subsequent paragraphs. The CSM consists of simple data types (e.g., integer, real, string) along with a constructed data type Search Resource that contains information on the modeled search resources (e.g., team type, mean search rate, mean movement rate). Each place in this model is associated with the data type Search Resource. There is a “guard function” that contains Boolean conditions for transitions, such as a check that enables only road segment transitions that lead to the desired target building. The arc expressions in the CSM are conditional statements that make decisions on factors such as the building search time for different search resource types (e.g., human vs. MWD). This description of the CSM elements is a necessarily brief overview because a complete description of the CSM is beyond the space limitations of this paper. The CSM is a hierarchical model that utilizes several modules. The highest level module is the village module. In this module (shown in Figure 1), search resource starting places, target buildings, and the road network are connected to create the village environment. Search resource starting places model the resources‟ initial starting location and can account for the time of travel to the target village if desired. Target buildings are connected to the road network at the appropriate road segment. Logic conditions are added to
13
ensure each building is only searched once. The wet bulb temperature (a measurement combining temperature and humidity) is incorporated into the module by sampling the wet bulb temperature pdf and then performing a look-up table operation in the heat factor function. This factor is generated from military work/rest tables for wet bulb temperature [10]. The heat factor function provides a value in the interval [0.1, 1.0] that represents work/rest ratios [10] for forces at a given wet bulb temperature. It is important to understand that a variety of uncertainties and modeling elements can be captured in the CSM. The CSM‟s strength is only limited by the detail requirements of the user. Finally, control functions are incorporated into the village module to allow multiple simulation trials and output of trial data.
just traversed. A search resource‟s simulation movement rate is determined by sampling the movement pdf. Thus the time to traverse a road segment is computed by dividing the length of the road by the combination of the simulation movement rate multiplied by the heat factor A sub-module of the road network module is the road segment. A road segment is a section of road as determined by the image processing software. The segments may be defined by natural breaks (e.g., intersections, dead-ends) or by a predefined length. The road segment module models the time required for a search resource to traverse the road segment. Uncertainties modeled in this element include the movement rate of the search resource and the effect of the wet bulb temperature upon the movement rate. As with the target building module, other factors such as road conditions, obstacles, and enemy contact can easily be added to the model if desired.
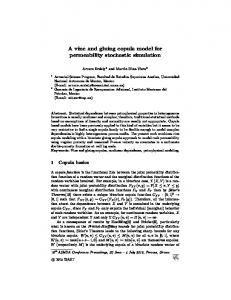
Figure 2. Example village module models village shown in Figure 2 with two search resources (SRi), four target buildings (Tj), and a road network module. A sub-module of the village module is the target building. This element models the search of a target building by a search resource. The module accounts for the impact of uncertainties, such as the search resource search rate, the actual size of the building, and the effect of the wet bulb temperature on the search rate. Each of these uncertainties is represented by a pdf. To calculate the search time, the search resource‟s simulation search rate is determined by sampling the search rate pdf. Then the simulation building size is determined by sampling the building size pdf. The search time is calculated by dividing the simulation size of the building by the combination of the search rate multiplied by a heat factor that incorporates the wet bulb temperature. If the team is a MWD team, then the MWD search rate is used assuming the dog team has not already worked for more than one hour. The module is designed to account for the dog‟s work/rest schedule. If the dog‟s work allowance is exceeded, then the team searches the building at the human search rate. If required, other uncertainties can be captured in this module (e.g., enemy contact, casualty evacuation, improvised explosive devices). The road network module contains all the systems‟ road segments required to model the environment. The road segments are connected to other road segments via arcs and transitions. Additionally, to prevent cycles, the road segments have guard expressions that ensure a token moves to an adjacent road segment only if it is a practical path to the destination target building and it is not the road segment
ISBN: 1-56555-342-X
Figure 2. Example cordon and search mission with eight target buildings (Tj), a unit boundary, a restrictive phase line, and a direction of advance The CSM outlined in the paragraphs of this sub-section to this point describe an unconstrained CSM. Military planners may choose to constrain the mission by adding graphical control measures such as unit boundaries and restrictive phase lines. Elements such as these sub-divide the graph and limit the set of possible solutions to the mission. Unit boundaries prevent specific search resources from searching target buildings outside their boundary. Restrictive phase lines control search resource movement by not allowing resources to proceed beyond the phase line until all resources reach the line. An example village with constraints is shown in Figure 2 and its corresponding road network is shown in Figure 3. The CSM can effectively capture these user constraints. For example, a unit boundary is implemented by removing arcs and transitions in the road network to segment the network into sectors while maintaining the requirement that each sector has at least one search resource assigned to it. A restrictive phase line
14
requirement is incorporated by the addition of a phase line place in the village module that holds search resource tokens until all tokens in the mission are present. Other constraints (e.g., maximum distance between teams, initial target building assignments, direction of advance) can be added to the model as desired by the user.
Figure 3. Example cordon and search road network for Figure 2. RSj is road segment j. The CSM is able to capture uncertainties in the combat environment and user constraints. In a simulation trial of the model, the paths the tokens traverse and the buildings they search constitute one possible solution to the mission. In the next section, we will discuss how the CSM can be used via Monte Carlo simulations to determine robust resource allocations. 4.
ROBUSTNESS
4.1. Robustness background It is often desired that the solutions of resource allocation problems be robust. This is true of the cordon and search mission domain. Military leaders desire a solution to the problem that is able to withstand the effects of uncertainty. This is evidenced by the common military saying, “the plan goes out the window as soon as we cross the line of departure.” However, the definition of the term „robustness‟ is frequently unclear. The authors of [2] created three questions to help correct this problem by defining robustness for a given scenario. The three robustness questions that help define robustness for a system are: (1) What behavior of the system makes it robust? (2) What uncertainties is the system robust against? and (3) Quantitatively, exactly how robust is the system? A system might be defined as robust if it meets a specific time deadline or if a maximum number of tasks from a set of tasks is completed. Uncertainties that a system could be robust against are variations between the expected completion/execution times for a task and the actual
ISBN: 1-56555-342-X
completion/execution times. The most important question in the list though is question 3. A quantitative measure for robustness is required to avoid subjective evaluations. This can be accomplished through the creation of an objective function for the system. For example, the objective function could be the probability that a resource allocation for a computing system will complete by its time deadline. The result can then be compared to other resource allocations to determine the most robust allocation (i.e., the allocation with the highest probability of meeting the time deadline) from the analyzed set of allocations. The FePIA (Features, Perturbation parameters, Impact, Analysis) method [1] is a framework for measuring robustness. The robustness metric for a given resource allocation can be developed using the FePIA method, where the following are identified: (1) the performance features that determine if the system is robust, (2) the perturbation parameters that characterize the uncertainty, (3) the impact of the perturbation parameters on the performance features, and (4) the analysis to quantify the robustness. As these steps are followed, the robustness metric for a system is created. In the next sub-section, we will apply the robustness questions and the FePIA procedures to the cordon and search environment. 4.2. Robustness and the Petri Net CSM In the cordon and search mission domain, the robustness questions can be answered differently depending on the performance objective in question. To illustrate the application of the questions to this domain, we will define the system to be robust if all the search resources complete their building searches prior to the mission deadline time (MDT). This is a time constraint by which all teams must complete. The uncertainties the system is robust against include variability in the ideal search rates of the search resources, variability in the ideal movement rates of the search resources, the effects of wet bulb temperature on the search rates, and the error in the estimated size of the target buildings. The uncertainties that can be modeled by the CSM are not limited to these choices. Any uncertainty that can be modeled may be incorporated into the CSM. To answer the third robustness question, we will use the FePIA method. First, we define the search resource completion time for team i (RCTi) to be the performance feature for this system. If there are m search resources, then there are m performance features. The perturbation parameters for step 2 are the same uncertainties outlined in the previous paragraph. The impact of the perturbation parameters on the performance feature is that they will either increase or decrease the value of RCTi. For example, target building j may have an estimated area of 500 m2 based on an image processing software‟s calculations. However, the true building size may be double that due to the presence of an
15
undetected second story. Thus, it will take longer to search the building and the value of RCTi will increase. The analysis to quantify the robustness of the system is complex and the reader is referred to [7] for a more detailed discussion. In summary, the time to search a given building is a complicated function of factors that include the building characteristics, search team characteristics, and pdfs of the relevant uncertainties. This results in a pdf that represents the building search time. To calculate RCTi it is necessary to convolve (assuming independence) the building search time pdfs for the buildings assigned to that team and the associated road segment traversal pdfs resulting in the search team‟s completion time pdf. With the CSM, a single trial in the simulation corresponds to one data point in the search resource completion time pmf. Thus, using Monte Carlo simulation methods and assuming a large enough sample size, the actual search resource completion time pdf for each search resource can be approximated by the simulation search resource completion time pmfs. It is assumed that the search resources have adequate supporting elements to operate independently and therefore the search resource completion times are independent in unconstrained and selected constrained scenarios. Thus, the stochastic robustness metric, SRM, of [7] is defined as the product of the all the teams‟ probabilities of completing before the MDT. That is, the SRM is the probability that all resources (teams) will complete by the MDT. For each simulation trial of the CSM, we can determine the maximum RCTi and then use the results of multiple trials to create a pmf of the maximum search resource completion times. From this pmf, we can sum the probabilities of the completion times that are less than or equal to the MDT. This sum is the probability that the mission will be complete by the MDT. The advantage of this technique over the convolution-based technique of [17] is that if the assumption of independence is removed (for example by the constraint of a phase line) then the CSM is still valid. The Monte Carlo generated pmfs and cumulative mass functions (cmfs) of the CSM can be used in several ways to identify robust resource allocations or to provide robust decision-making data. In the first way, the cmf of a cordon and search mission could be used to determine with a given probability (e.g., 95%) the maximum length of time it would take to complete the search of all the target buildings. This would allow leaders to accurately plan for the required supporting resources. Another use is that specific resource allocations could be compared via their cmfs to determine which allocation has the highest probability of completing prior to the MDT. Additionally, the effects of changing aspects of the mission (e.g., varying search resources, varying placement of unit boundary lines) could be examined by comparing the resulting cmfs. In the next section, we show the results of simulations to further explain this point.
ISBN: 1-56555-342-X
5.
SIMULATION RESULTS
The CSM was created and simulated using the ExSpecT software version 6.1 [3]. This free package supports timed, stochastic, colored Petri Nets and allows file I/O to capture the results of simulations. The pdfs used in the simulations for the uncertainties were the PERT beta distribution [14]. This closed distribution emphasizes the mean over the minimum and maximum values. The distribution uses the expected value, a minimum value, and a maximum value as parameters for the distribution. For the building area, the minimum value was 0.25 times the estimated area and the maximum was four times the estimated area. The search rate pdf minimum was 0.05 m2/s and the maximum was twice the mean search rate of the search resource. For the movement rate pdf, the minimum value was set to 0.1 m/s and the maximum value was twice the mean movement rate of the search resource. The pdfs used for this or any of the modules is not crucial to the correctness of the model. It is assumed that the pdfs to be used in practical application can be approximated through the use of historical data or data from a combat training center. For this work, a model was built of an eight target building village with twenty-one road segments (shown in Figures 2 and 3). Each building was assigned an estimated area and the roads were assigned a length based on the input image‟s scale. Three search resources were modeled of which one was a military working dog team. Each search resource was assigned mean values for its search and movement rates based on military Field Manual movement rate tables [9]. The military working dog team was also assigned a mean value for its search rate when using the dog team to search. An initial wet bulb temperature value of 76 degrees Fahrenheit was used as well. In the first batch of simulation trials, three cordon and search scenarios were run: unconstrained; unit boundary constrained; and unit boundary with restrictive phase line and direction of attack constrained. A total of 1000 trials were performed for each scenario. The differences between trials are the resulting sample values used from the perturbation pdfs (e.g., building size, search rate, movement rate), the allocation of target buildings to search resources (randomly allocated using a uniform distribution for the initial building to be searched and then after each resource completes a given building search), and the assignment of search resources to a particular side of the unit boundary (randomly allocated using a uniform distribution while maintaining at least one resource on a side). The resulting pmfs are shown in Figure 4. It is clear that adding the constraints to the mission increased the mean of the distributions. The second batch of simulation trials used three specific search resource allocations selected from different bins of the constrained unit boundary with restrictive phase line and direction of attack simulation results. The resource
16
allocations were chosen such that all were unique allocations and search resources searched opposite sides of the unit boundary. For reference, the selected allocations are shown in Table 1. For each of the allocations, 1000 trials were conducted and the resulting cmfs are shown in Figure 5 (to construct a cmf that corresponds to a given pmf, for each time i on the x-axis, the cmf y-axis value is the sum of the pmf probabilities from time 0 to time i). The trials differed by the value of the perturbation parameters. These were generated by sampling the pdfs in the CSM. Using a MDT value of 4 hours, allocation 3 is the most robust of the three allocations with a 90.3 percent probability of resource completion prior to the MDT. Thus, if a specific resource allocation is provided, the CSM can evaluate it to determine the stochastic robustness metric of the allocation. This result can then be used to select the most robust allocation from a given set of allocations.
inputs. Additionally, the actual pdfs for the perturbation parameters are required to increase the accuracy of the model. Finally, more perturbation factors can be incorporated into the model to improve the realism of the simulation. Acknowledgements. The authors would like to thank L. Briceño, and A. Al-Qa‟wasmeh for their comments. Table 1. Three resource allocations with three search resources (SR) each and the assigned paths. In the path section, numbers represent road segment ids and i represents a search of target building i. allocation
1
2
3
SR
path
1
1- 1 -1- 11 - 15 - 12 - 2- 2-1- 5
2
1-6-1-4-5-6–4
3
7 - 3 - 7 - 27 - 18 - 8 - 8 - 8 - 21 19 - 5 – 7
1
1 – 1 - 1 - 11 - 15 - 12 - 2 - 2 - 1 - 5
2
1-6-1-4-5-7
3
7 - 3 - 7 - 27 - 18 - 8 - 8 - 8 - 18 27 - 6 – 4
1
1-6-1-4-5-7
2
7 - 3 - 7 - 27 - 18 - 8 - 8 - 8 - 18 27 - 6 – 4
3
1 - 1 - 1 - 11 - 15 - 12 - 2 - 12 - 15 11 - 1 – 5
Figure 4. Cordon and search Petri Net model pmfs for eight buildings, three resources, and 1000 random trials each. 6.
CONCLUSIONS
In this paper, we have proposed a novel cordon and search model (CSM) for a cordon and search mission using timed, stochastic, colored Petri Nets. The power of Petri Nets to model uncertainty, concurrency, and causality make it an excellent fit for this environment. Contrary to other military simulations, our model uses stochastic information in the form of pdfs to make the cordon and search model and then uses the results of Monte Carlo simulations to evaluate the robustness of a resource allocation or provide robust information to decision-makers. The simulation trials demonstrate the validity of the CSM and highlight its power. Future work in this domain includes developing a software package that can automatically generate the underlying Petri Net structure from input imagery and user
ISBN: 1-56555-342-X
Figure 5. Comparison of three resource allocation cmfs for 1000 trials each. MDT time is 4 hours.
17
REFERENCES [1] S. Ali, A. A. Maciejewski, H. J. Siegel, and J. Kim, “Measuring the robustness of a resource allocation,” IEEE Trans. on Parallel and Distributed Systems, Vol. 15, No. 7, Jul. 2004, pp. 630 – 641. [2] S. Ali, A. A. Maciejewski, and H. J. Siegel, “Perspectives on robust resource allocation for heterogeneous parallel systems,” in Handbook of Parallel Computing: Models, Algorithms, and Applications, S. Rajasekaran and J. Reif, eds., Chapman & Hall/CRC Press, Boca Raton, FL, 2008, pp. 41-1 – 41-30. [3] Deloitte Development LLC, ExSpecT software, http://www.exspect.com/, accessed Oct 2009. [4] N.K. Jaiswal, Y. Sangeeta, and S.C. Gaur, “Stochastic analysis of combat models under different termination decision rules,” European J. of Operational Research, Vol. 83, 1995, pp. 530 - 546. [5] K. Jensen and L.M. Kristensen, Coloured Petri Nets, Springer-Verlag, Berlin, 2009. [6] A. Kumar and L. S. Ganesh, “Use of Petri Nets for resource allocation in projects,” IEEE Trans. on Engineering Management, Vol. 45, No. 1, Feb. 1998, pp. 49 - 56. [7] P. Maxwell, A. A. Maciejewski, H. J. Siegel, J. Potter, and J. Smith, “A mathematical model of robust military village searches for decision making purposes,” 2009 Int’l Conf. on Information and Knowledge Engineering (IKE'09), Jul. 2009, pp. 311 - 316. [8] P. Maxwell, H. J. Siegel, and J. Potter, “The ISTeC people-animals-robots laboratory: Robust resource allocation,” 2009 IEEE Int’l Workshop on Safety, Security, and Rescue Robotics (SSRR09), Nov. 2009. [9] FM 3-31.1 Army and Marine Corps Integration in Joint Operations, U. S. Army Training and Doctrine Command, Ft. Monroe, VA, Nov. 2001. [10] FM 34-8-2 Intelligence Officer’s Handbook, U.S. Army Training and Doctrine Command, Ft. Monroe, VA, May 1998. [11] F. Momen and J. W. Rozenblit, “Dynamic decision support in the advanced tactical architecture for combat knowledge system,” The J. of Defense Modeling and Simulation: Applications, Methodology, Technology, Vol. 3, No. 1, Jan. 2006, pp. 11 - 26. [12] D. Popken and L. Cox, “A Simulation-optimization approach to air warfare planning,” The J. of Defense Modeling and Simulation: Applications, Methodology, Technology, Vol. 1, No. 3, Aug. 2004, pp. 127 - 140. [13] D. Riera, M. Narciso, and C. Benqlilou, “A Petri Netsbased scheduling methodology for multipurpose batch plants,” Simulation, Vol. 81, No. 9, Sep. 2005, pp. 613 623. [14] RiskAMP.com, http://www.riskamp.com/library/ pertdistribution.php, accessed Nov. 09.
ISBN: 1-56555-342-X
[15] A. Sawhney, “Petri Net based simulation of construction schedules,” The 1997 Winter Simulation Conf., Dec. 1997, pp. 1111 - 1118. [16] Z. Shen and S. Zhou, “Behavior representation and simulation for military operations on urbanized terrain,” Simulation, Vol. 82, No. 9, Sep. 2006, pp. 593 - 607. [17] J. Smith, E. K. P. Chong, A. A. Maciejewski, and H. J. Siegel, “Stochastic-based robust dynamic resource allocation in a heterogeneous computing system,” 2009 International Conference on Parallel Processing (ICPP 2009), Vienna, Austria, Sep. 2009, pp. 188 – 195. [18] L. Zhang, L. M. Kristensen, C. Janczura, G. Gallasch, and J. Billington, “A coloured Petri Net based tool for course of action development and analysis,” Conf. on Application and Theory of Petri Nets: Formal Methods in Software Engineering and Defence Systems, Vol. 1, 2002, pp. 125 - 134. Biography Paul Maxwell is an Army Lieutenant Colonel and a Ph.D. student at Colorado State University. He received a B.S.E.E. degree from the United States Military Academy and a M.S.E.E. degree from the University of Kentucky. From 1992 until the present, he has served in various military leadership positions and has deployed to Macedonia, Bosnia, and Iraq where he has planned and executed cordon and search missions at company, battalion, and brigade level. Anthony A. Maciejewski received the B.S.E.E., M.S., and Ph.D. degrees from Ohio State University in 1982, 1984, and 1987. From 1988 to 2001, he was a professor of Electrical and Computer Engineering at Purdue University, West Lafayette. He is currently the Department Head of Electrical and Computer Engineering at Colorado State University. He is a Fellow of the IEEE. A complete vita is available at: www.engr.colostate.edu/~aam. Howard Jay Siegel is the Abell Endowed Chair Distinguished Professor of Electrical and Computer Engineering at Colorado State University, where he is also a Professor of Computer Science. From 1976 to 2001, he was a professor at Purdue University. He is an IEEE Fellow and an ACM Fellow. He received B.S. degrees from the MIT, and the Ph.D. degrees from Princeton. Homepage: www.engr.colostate.edu/~hj. Jerry Potter is currently a Research Professor with Colorado State University and a Professor Emeritus in the Department of Computer Science at Kent State University. He has worked at IDA's Supercomputing Research Center, Goodyear Aerospace, Xerox Research, and Bell Telephone Laboratories. While at Goodyear, he was involved in software development for the STARAN, ASPRO and MPP SIMD computers. Homepage: http://www.engr. colostate.edu/ ~potter
18