studying in-vitro antimicrobial interactions using a representative. /Mactam, aminoglycoside and fluoroquinolone. M. Wootton*, A. J. Hedges*, K. E. Bowker', H. A. ...
Journal of Antimicrobial Chemotherapy (1995) 35, 569-576
A critical assessment of the agar dilution chequerboard technique for studying in-vitro antimicrobial interactions using a representative /Mactam, aminoglycoside and fluoroquinolone M. Wootton*, A. J. Hedges*, K. E. Bowker', H. A. Holf, D. S. Reeves' and A. P. MacGowan** "Regional Antimicrobial Reference Laboratory, Department of Medical Microbiology, Southmead Health Services NHS Trust, Westbury-on-Trym, Bristol BS105NB and b Department of Pathology and Microbiology, School of Medical Sciences, University of Bristol, Bristol, BS8 1TD, UK The agar dilution chequerboard technique of studying antimicrobial interactions was assessed by testing a representative /Mactam (piperacillin/tazobactam), aminoglycoside (gentamicin) andfluoroquinolone(ciprofloxacin) against themselves, that is piperacillin/tazobactam plus piperacillin/tazobactam, gentamicin plus gentamicin and ciprofloxacin plus ciprofloxacin. In addition, combinations of piperacillin/ tazobactam plus gentamicin or ciprofloxacin were also tested against Enterobacteriaceae and Acinetobacter spp. in triplicate. The agar dilution chequerboard technique did not reliably show addition when agents were combined with themselves, and there was also considerable variation when /Mactam plus aminoglycoside or fluoroquinolone combinations when tested in triplicate. These observations, and problems with the design of the method, indicate that the chequerboard technique should be used only with adequate controls and replication, and then interpreted with extreme caution; ideally, it should not be used as a method of assessing antimicrobial interactions.
Introduction The agar dilution chequerboard technique, subsequently referred to as the chequerboard technique, is widely used to determine the interaction between two antimicrobial agents in-vitro, especially when bactericidal activity is not of interest and large numbers of bacterial strains or antimicrobial combinations are to be tested. Combinations of antimicrobial agents may be investigated in patients receiving multiple antibiotics to enable the treatment of all suspected pathogens, to prevent the emergence of resistance, or to help improve clinical efficacy. It is often felt to be of importance to be able to demonstrate synergy between agents using in-vitro evaluations such as the chequerboard technique. However, the chequerboard technique as a method of determining antimicrobial interactions has a number of major shortcomings. These fall into two main areas; firstly, problems inherent in the method and its design, and secondly, interpretation •Corresponding author. Phone: +44- 1 indicates antagonism and FIC = 1 indicates indifference (Berenbaum, 1978, 1983). Alternatively a one dilution or greater error can be built in to the analysis, and so synergy is indicated by an FIC index 4 0 (Krogstat & Moellering, 1986; Anon., 1989). The measurement of indifference, addition or autonomy all remain as an FIC index of 1, or FIC indices which are not denned as synergy or antagonism. Finally, there is a problem of semantics with various authors defining synergy, antagonism, single agonism, additivity, indifference and autonomy in different ways (King, Schlessinger & Krogstad, 1981; Yu et al., 1984). This study aims to evaluate these problems of methodology using combinations of a /Mactam plus a fluoroquinolone, and /Mactam plus an aminoglycoside.
Materials and methods
Bacterial strains Forty-eight bacterial strains comprising, Citrobacter fruendii (n = 4), Enterobacter cloacae (7), Morganella morganii (6), Serratia marcescens (6), Acinetobacter bawnanii (8), Acinetobacter haemolyticus (9), and Acinetobacter junii (8), were employed in these studies. The strains were clinical isolates collected at Southmead Hospital since 1987. Also used were the control strains Escherichia coli NCTC 10418 and Pseudomonas aeruginosa NCTC 10662. All strains were stored at -70°C. Antimicrobial agents The following antibiotics were used: piperacillin/tazobactam (both provided by Lederle Laboratories, Gosport, UK), ciprofloxacin (Bayer, Newbury, UK) and gentamicin (David Bull Laboratories, Warwick, UK). Piperacillin plus tazobactam were combined in a fixed ratio of 8 to 1 for all studies, as this is the ratio used clinically. Chequerboard method All strains were tested by the agar-dilution chequerboard technique (Eliopoulos & Moellering, 1991) on DST agar (Unipath), with antibiotic concentrations in the range 0008-128 mg/L. Combinations of piperacillin/tazobactam plus ciprofloxacin and
Agar dilution cbeqnerboard
571
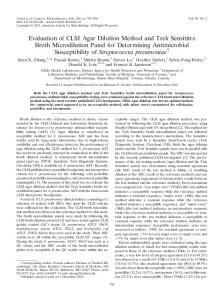
piperacillin/tazobactam plus gentamicin were studied, and also combinations of the antimicrobial agents with themselves; that is, piperacillin/tazobactam plus piperacillin/ tazobactam, gentamicin plus gentamicin and ciprofloxacin plus ciprofloxacin. These last three combinations provided a means of investigating variability in the method itself. The bacterial strains were diluted from an overnight broth, to give an inoculum of 104 cfu per spot when applied with a Multipoint Inoculator (Denley). Inhibition was read after incubation for 16-24 h at 37°C, as previously described (Holt, Bywater & Reeves, 1990). The method described by Eliopoulos & Moellering (1991) has been modified many times, either to enhance its accuracy or to eliminate problems. Our approach is illustrated in Figure 1. Bacterial growth is indicated by the shaded areas and no growth by the unshaded squares. The FICs of each agent (FICA and FICB) were calculated where a change in the no growth/growth interface occurred. These changes are indicated on Figure 1 by hash a and hash b. The asterix in Figure 1 represent the positions on the no growth/growth interface which have been used by some other authors. Calculation of the FICs using corners (asterix symbols) does not significantly alter the FIC index (hash symbols) for most strains (data not shown). The FIC of each agent is then added to give the FIC index (FIC index = FICA + FICB). In this study, synergy is defined as an FIC index of < 0-5 or < 0-25, and antagonism as an FIC index of > 20 or 40. Other FIC index values represent indifference.
Results MICs of piperacillin/tazobactam, gentamicin and ciprofloxacin were repeated four times in various chequerboard tests. Those strains showing a greater than doubling dilution difference in MICs of the single agents across these experiments were discarded from further analysis, this accounted for ten strains. Of these ten strains,fivewere A. baumanii, three A.junii, and one each A. haemolyticus and E. cloacae. All the excluded strains showed a greater than doubling dilution in MIC of more than one antibiotic. No antimicrobial agent was particularly subject to variation in MIC, in that nine of the ten ll 0-5 CQ
003 0008 0
•J #1
1 1| |1 1| - | 1
B #a |
I1 ••
#
0 0008 00150-03 006 0120-25 0-5 1 MIC of agent A Figure 1. Chequerboard of antimicrobial A tested against antimicrobial B. The shaded areas indicate the combinations in which growth occurs. FICs were calculated for those combinations where a change in the growth/no growth interface occurred. M I C A = 1; MIC B = 1, #a, FIC A = 0-015; FIC B •= 0-5; FIC index = 0-515. #b, FIC A = 0-5; FIC B = 0008; FIC index = 0-508. 0 , Bacterial growth; D, no bacterial growth; 'see explanation in text.
572
M. Wootton et al.
discarded strains had variations in MICs of piperacillin/tazobactam and gentamicin, while six strains had greater than doubling dilution variations in MICs of ciprofloxacin. The FIC index of each individual agent was calculated as shown on Figure 1. When more than one was obtained, the lowest FIC index was used to determine synergy or antagonism. It would be expected that dilutions of ciprofloxacin, piperacillin/tazobactam or gentamicin added to themselves would produce addition. That is, of the two components of the FIC index, FICA and FICA, were plotted against each other then a straight line from 1 on the x-axis to 1 on the y-axis would be obtained. It is important, however, to note that given a doubling dilution series only three FIC indices can fall on this line (FICA = 10 and FICB = 0; FICA = FICB = 0-5; FICA = 0 and F I C = 1). When the components of the FIC index were plotted against each other a best fit straight line was
0-2 0-4 0-6 0-8 1 FIC piperacilliivtazobactain
0
0-2 0-4 0-6 0-8 FIC ciprofloxacin
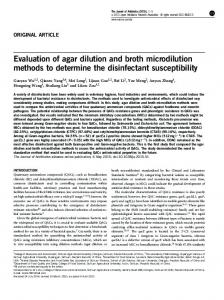
0-2 0-4 0-6 0-8 1 FIC gent&miciiL Figure 2. Assessment of the relationship between the components of FIC index of piperadllin/tazobactam (a), ciprofloxacin (b) or gentamicin (c) tested for interactions between themselves. The bestfitlines are described by the equations y = 0-725-0-808*, ciprofloxacin; y = 0-774-0-843* gentamicin and y = 0-834-0-902* piperacillin/tazobactam. The R1 values for each were 0-655, 0-714 and 0-776, respectively.
Agar dilution cbeqoerboard
573
Table I. Percentages of strains for which synergy or antagonism was demonstrated using two sets of interpretative criteria FIC index synergy Agents employed Ciprofloxacin plus ciprofloxacin Gentamicin plus gentamicin Piperacillin/tazobactam plus piperacillin/tazobactam Piperacillin/tazobactam plus ciprofloxacin experiment 1 experiment 2 experiment 3 Piperacillin/tazobactam plus gentamicin experiment 1 experiment 2 experiment 3
4
2-8 0 2-8
11-8 8-8 2-8
0 0 5-6
0 0 5-6
111 0 0
22-2 2-8 31
111 31-4 25
8-3 8-6 6-2
5-9 2-8 5-9
14-7 2-8 26-5
8-8 8-6 11-8
8-8 2-8 5-9
criteria
calculated from the data for all the strains, rather than fitting a line to each strain (Figure 2). This approach was adopted to try to overcome strain to strain variations. None of the best fit lines approximated to that expected, and the degree of it obtained was poor owing to the considerable amount of scatter observed (Figure 2). Hence, using these conventional chequerboard plots, it was not possible to show convincingly that these representative /Mactam, aminoglycoside or fluoroquinolone are additive, even when combined with themselves. Using the above definitions of synergy and antagonism, some strains showed synergy or antagonism when the antimicrobials were added to themselves (Table I). As would be expected this was less apparent when the FIC indexes of 4 were employed rather than FIC indexes of 20. The number of strains in which piperacillin/tazobactam was synergic or antagonistic in combination with ciprofloxacin or gentamicin for the same experiment repeated on three occasions is shown in Table II. There was considerable variation between experiments, and few strains showed a consistent pattern of antagonism or synergy in all three experiments (Table II). The most consistent pattern was indifference. For example, for none of the strains was the combination of piperacillin/tazobactam plus gentamicin or ciprofloxacin synergic in all three experiments, whichever definition of synergy was employed. Similarly only two strains showed consistent antagonism, and then with an FIC of > 20 rather than the most stringent definition of > 40. Some strains showed synergy in one experiment but antagonism in another.
Discussion The chequerboard technique for studying antibiotic interactions is beset with difficulties, and in many published studies appropriate controls and replicates do not seem to have been used. The interactions of agents 'added' to or combined with themselves serves as a baseline from which the interactions of two different antibiotics can be judged. Use of this approachrecentlyled us to question the reported synergy between clarithromycin and its 14-hydroxy metabolite (MacGowan et al., 1993). In the present study a more
574
M. Wootton et al.
Table IL Percentages of strains (n = 38) for which synergy, antagonism or indifference was demonstrated with piperacillin/tazobactam plus gentamicin or piperacillin/tazobactam plus ciprofloxacin when experiments were performed in triplicate
Definitions Synergy in 3/3 experiments in 2/3 experiments in 1/3 experiments Antagonism in 3/3 experiments in 2/3 experiments in 1/3 experiments Antagonism and synergy in at least 1/3 experiment Neither antagonism nor synergy in 3/3 experiments
Combinations piperacillin/ piperacillin/ tazobactam tazobactam plus plus ciprofloxacin gentamicin
FIC < FIC < FIC < FIC < FIC < FIC
FIC > FIC > FIC > FIC > FIC >
40 20 40 20 40 20
0 5-3 5-3 0 2-6 5-3
0 5-3 2-6 5-3 10-4 26-3
FIC < 0-25, > 4 0 FIC < 0-5, > 2 0
2-6 2-6
0 5-3
0-25 < FIC < 40 0-5