A Cryospheric Sensor Web Use Case on a Small Temperate Glacier MJ Heavner1, DR Fatland2, EW Hood1, C Connor1 1
University of Alaska Southeast, Juneau Alaska 99801 2 Vexcel/Microsoft, Boulder Colorado 80303
[email protected]
Abstract-As part of the Southeast Alaska Telecommunications and Monitoring for Science, Education and Research (SEAMONSTER) project we are establishing a sensor web to monitor the hydrology and mass balance of the 11 square km Lemon Glacier near Juneau, Alaska. We have installed climate stations, one on a ridge above the glacier and a second 3 km below the terminus. An in-situ water quality sonde measures water temperature, conductivity, turbidity, pH, and dissolved oxygen continuously in Lemon Creek, the proglacial stream draining the glacier. In addition, the U.S. Geological Survey maintains a stream gauging station at the location of the sonde. To study glacier lake outburst flood events, we have installed a pressure transducer to monitor stage in a supra glacial lake that forms annually in the spring and early summer and drains in the late summer. A communication system allows data from all of these sensors to be transmitted to our lab at the University of Alaska Southeast in real-time and throughout the sensor web. The data collected via the SEAMONSTER sensor web is being used for a variety of applications. Data from the climate stations is being used in conjunction with a temperature-index ice and snow melt model and a digital elevation model to model runoff from the Lemon Glacier and evaluate the glacial contribution to stream flow in the upper Lemon Creek watershed. Water quality data are being used to assess the impact of glacial runoff on the physiochemical quality of Lemon Creek across the glacial melt season. Stage data from the supra glacial lake are being used in conjunction with the modeled glacial runoff and water quality data to evaluate the magnitude of the annual glacial lake outburst flood and its impact on water quality in Lemon Creek. Public outreach is an integral component of our project and we are developing database access and visualization tools that will allow data to be displayed on the web in real-time. In particular, we have developed preliminary user interfaces that allow the data from the sensor web to be displayed in a virtual earth environment such as Google Earth. The sensor web technology being developed through the Advanced Information Systems Technology of the Earth Science Technology Office of NASA is being demonstrated in this application which directly addresses the linkage between climate induced glacier changes and the impacts on watershed and primary productivity in marine near-shore ecosystems.
I.
INTRODUCTION
In order to understand features of the complex Earth System, distributed sensing is a requirement. Distributed
sensor networks are becoming pervasive in Earth System sciences. The NASA Earth Science Technology Office (ESTO) is developing the next evolutionary technology along this path: the sensor web. From a NASA ESTO Advanced Information Systems Technology PI workshop, the sensor web concept is defined as “a coherent set of heterogeneous, loosely-coupled, distributed nodes, interconnected by a communications fabric that can collectively behave as a single dynamically adaptive and reconfigurable observing system. The Nodes in a sensor web interoperate with common standards and services. Sensor webs can be layered or linked together” [1]. The critical difference between a sensor web and a sensor network is the communication between nodes and autonomous reconfiguration of the heterogeneous nodes. The SEAMONSTER project provides a scientifically motivated instantiation of a sensor web to improve our knowledge of a glaciated watershed, illustrate the sensor web application to scientists, and provide a testbed for further sensor web technology development and validation. One sensor web aspect of SEAMONSTER is the reactive behavior that will occur when the lake begins to drain. As the lake drains, the pressure transducer will note the change in lake level and relate the occurrence to the weather station, water-quality probe, and our research laboratory via wireless transmissions. The camera on the weather station will automatically turn to the lake and begin rapidly taking photographs. The water-quality probe will begin to sample more frequently, as will the pressure transducer. Back at the laboratory we will be able to observe the event and, in an extreme event, alert people to the possibility of flooding. This is one application of the smart wireless sensor web used to monitor dynamic environmental phenomena. II. STUDY AREA Lemon Creek, located in Southeast Alaska, is a small, glacial watershed that hosts a diversity of temperate ecosystems. At the head of the watershed, 1200 m above sea level, lies the 15 km2 Lemon Creek Glacier. The Lemon Creek Glacier covers approximately 20% of the watershed with a layer of ice up to a few hundred meters thick. Following the watershed down from the mountain peaks surrounding the glacier toward the marine environment, the watershed encompasses a range of complex and diverse
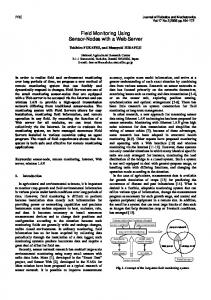
ecosystems in a fairly small spatial expanse. The ecosystems include sparsely vegetated alpine tundra, lush alpine meadows, new and old-growth temperate rainforests, cold streams, and, at the lowest reach, tidally-influenced wetlands and an estuary region. One aspect of note for this study area is that Lemon Creek Glacier was monitored during IGY (1957-58) [2] and is again being studied during IPY (2007-8), providing a relatively long-term record of watershed changes.
Fig. 1. Lemon Creek Sensor Web Study Area.
III.
HARDWARE COMPONENTS
single board computer that boots TS-Linux by default from 512+MB SD card and can be configured to run at one quarter watt power consumption. The single board computer supports 2 USB ports, 3 serial, Ethernet, PC/104 bus. A critical addition to the above computer is the Power Conditioning Subsystem (PCS) that is based on a custom power control board driven by low-power PIC microcontroller. The PCS is powered independently with internal LiSO2 batteries to provide approximately two years of operation. The PCS is field-programmable and senses external supply voltage. The provides and excellent sensor web platform—for example, if the PCS detects a low external voltage, the PCS can enter a “hibernate mode” for a recovery interval and then recheck the external voltage. The PCS carries a byte-wide communication channel to/from the Single Board Computer and has independent control of each (internal and external) power supply. Additionally, the Vexcel Microserver has 802.11g networking built in with a COTS Linksys WET54G wireless Ethernet bridge which can be replaced with a wireless Ethernet router, a 900 MHz radio modem, or a satellite uplink. A Novatel "Superstar II" GPS receiver provides timing and location for the Vexcel Microserver.
A. Vexcel Microserver Vexcel Microservers were originally developed with NASA STTR support beginning in 2002 in collaboration with Penn State University. They were conceived as highfrequency seismic recording devices with extensibility to many other types of sensors. Vexcel Microservers (VuS) are simple rugged computers with radio modems that can survive and operate outdoors in harsh environments like Antarctica. They are called Microservers because of their networking capabilities, particularly as they can act as anchor points for localized lightweight sensor networks built on motes. They also function as network nodes in a typically ad hoc configuration.
Fig. 3. Schematic of Vexcel Microserver Sensor Web Platform
B.
Sensors Every year a lake forms atop Lemon Creek Glacier and at some point during the summer it drains over a short period into Lemon Creek. Weather stations, based on Campbell Scientific data loggers, have been deployed at the top of Lemon Creek Glacier (near the lake) and near the terminus of the glacier to measure parameters such as air temperature and precipitation. The station near the lake also houses a high-resolution digital pan/tilt/zoom web camera. Installed in the lake is a pressure transducer that measures lake level. Mounted downstream in Lemon Creek is an YSI probe that measures water-quality characteristics. Fig. 2. View of internals of Vexcel Microserver Sensor Web Platform.
The Vexcel Microserver, seen in Figs 2 and 3, is built around the ARM-9-based Technologic Systems TS-7260
D. Data Storage, Flow, and Publication The SEAMONSTER project generates heterogeneous data sets at irregular time intervals. Managing the data with ease
of access, public outreach, and easy of comparison between the different instruments for researchers motivated our use of a single SQL database for storage of all data. As illustrated in Fig 4, all the data streams through sensors to the microservers and then into a postgreSQL database with GIS extensions enabled. The GIS extensions require that every data point be associated with a space and time entry. By coupling the postgreSQL+GIS database with the Open Geospatial Corsortium (OGC) GeoServer we are able to automatically disseminate the data streams through a web portal (http://semonaster.jun.alaska.edu/browser/), kml for 4D Geobrowsers (such as Google Earth or Microsoft Virtual Earth), services to more traditional GIS systems (such as the ESRI suite of Arc* software), and as part of an outreach GeoWiki. The PostgreSQL+GIS database does allow for both vector and raster (e.g. ESRI .shp files). We are using the mediawiki wiki-engine for our Geowiki. The mediawiki engine requires a SQL database for page storage and we are able to associate a spatio-temporal location with each wiki page and store the wiki in the same PostgreSQL+GIS database. The SEAMONSTER GeoWiki may be accesses at http://seamonster.jun.alaska.edu/geowiki/index.php/Tour_M ain_Page. Fig. 4 illustrates this data architecture with output to end-users. For readability, the data feedback loops enabling the sensor web aspects of SEAMONSTER are not shown, but are an inherent part of the SEAMONSTER sensor web. These feedbacks occur between the multiple Vexcel Microserver sensor web platforms deployed in the Lemon Creek Watershed.
conditions. Real time melt model runs with meteorological inputs from SEAMONSTER which result in discrepancies with real time stream flow measurements would provide a sensor web reconfiguration to more carefully monitor the glacier watershed dynamics. An example of this work from summer 2007 is shown in Figures 5 and 6. Fig 5 illustrates the measured temperature driving the melt on four different days in the watershed. By integrating the melt shown on the left panel, and using the model to constrain water residence time, we are able to compare the modeled and measured discharge in the right panel of Figure 5. The right panel of Figure 5 highlights the melt model and measured stream flow discrepancy associated with the lake drainage event.
Fig 5. Simulated daily melt for June 8,10,12, and 16 shows daily snow water equivalent (SWE) in cm across the upper portion of the Lemon Creek Watershed (above the gauging station). The plot of observed temperature from the terminus weather station is shown. (Note, lower temperatures mean less melt, and high temperatures yield higher melt rates.)
Fig 4. Schematic of Data Flow to end-user in SEAMONSTER database.
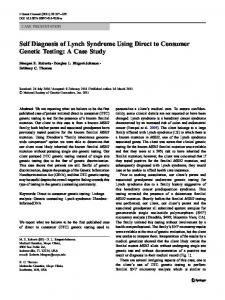
III. MODEL INTEGRATION One point of discussion at the NASA ESTO AIST Sensor Web PI Workshops has been the role of models in sensor webs. The SEAMONSTER dataset includes the USGS stream gauge measurements made at the same location as the lower meteorologic station (approximately 3 km downstream from the glacier terminus). We are able to use the Hock melt model [3] to constrain the snow pack in the watershed. In future years, we anticipate integration of real time stream flow measurements into the SEAMONSTER sensor web, along with multi-melt model runs to provide an input to sensor web behavior based on the seasonal dominant wind patterns (impacting snow pack redistribution) and real time
Fig 6. Snow and ice melt from the Hock melt model [3] are integrated over the watershed above the USGS stream gauge station to derive the above blue curve. The red curve is the USGS measured flow rate. The discrepancy between 7/13 and 7/23 is associated with the lake outburst flood.
III. CONCLUSIONS The SEAMONSTER sensor web project provides a timely scientific motivation for the application of sensor web technology, providing multiple use case scenarios. Additionally, SEAMONSTER provides a testbed for sensor web components and concepts.
ACKNOWLEDGMENT Funding for SEAMONSTER is provided through NASA Earth Science Technology Office grant AIST-05-0105, NOAA Education Partnership Panel Interdisciplinary Scientific Environmental Technology (ISET) Cooperative Science Center Grant, and NSF Research Experience for Undergraduates Grant No. 0553000. Marijke Habermann, Erica Halford, Logan Berner, Edwin Knuth, Nick Korzen, David Sauer, Shannon Siefert, Suzie Teerlink, and Nathan Rogers have provided SEAMONSTER support.
REFERENCES [1] [2]
[3]
NASA AIST Sensor Web Tech Meeting Report, Feb 13-14, 2007, http://esto.nasa.gov/sensorwebmeeting/files/AIST_Sensor_Web_M eeting_Report_2007.pdf Miller, M and M Pelto, 1999. Mass Balance Measurements on the Lemon Creek Glacier, Juneau Icefield, Alaska, 1953-1998, Geografiska Annaler, Series A: Physical Geography, Vol 81, No 4, pp 671-681. Hock, R, 2005. Glacier melt: A review on processes and their modeling. Progress in Phys. Geog. 29(3),362-391.