sw 3359 ms
8/20/01
2:29 PM
Page 123
A DATA ACQUISITION SYSTEM FOR SPRINKLER UNIFORMITY TESTING E. R. Zanon, R. Testezlaf, E. J. Matsura ABSTRACT. The scope of this work was to develop and evaluate a data acquisition system (DAS) to automate sprinkler uniformity distribution testing. The system was designed to perform indoor tests for low and medium pressure sprinklers using a two radii collector pattern. The data acquisition system consisted of a PC/AT 386 computer connected to an A/D converter, which received signals from 16 collector-transducer devices. The measuring principle of those collectors was to use the output of load cells to estimate the volume accumulated inside each collector. Four tests of the Naan 501-U sprinkler were conducted to evaluate the system performance. Weight readings were taken at 30, 60, 90, and 120 min during each test. The average volume weight readings taken at the end of the tests (120 min) were compared to volume values estimated using a digital scale. Those readings were used to create an overlapping grid pattern for a 6 m (19.7 ft) × 6 m (19.7 ft) sprinkler spacing. Statistical parameters and uniformity coefficients were calculated for both methods (DAS and scale). Sprinkler discharge and operating pressure were monitored by transducers connected to the system. No statistical differences were found between recording methods (P < 0.05). The same conclusion could be made for the uniformity coefficients. The maximum standard deviation of measurement dispersion for the data acquisition system readings was 0.35 mL (0.01 oz). The results showed that the DAS is a reliable system for sprinkler uniformity testing using a radius pattern. The developed automated system proved to be easy to install without requiring specific skills to assemble. Keywords. Irrigation, Sprinkler uniformity, Distribution, Uniformity test.
S
prinkler irrigation has been one of the most used systems worldwide, mainly due to its operational flexibility and adaptability to different soil, crop, and topographic conditions. Crop yield response to sprinkler irrigation is proportional to the quality of the water distribution pattern of the sprinklers. The uniformity distribution pattern is a measure of how evenly the sprinkler system applies water over the irrigated area. According to Silva et al. (1994), planning a suitable sprinkler irrigation system requires information about the water distribution pattern of the equipment. Economic decisions in sprinkler design should be based upon the measurement and prediction of water uniformity (Solomon, 1979). Knowledge of the water distribution pattern is also important for research applications, development of prototypes, and equipment manufacturing quality control. Sprinkler uniformity distribution tests are well-known for being time and labor consuming. A typical sprinkler distribution can be evaluated using a grid of catch cans or collectors. The most common test procedure is to use a square or rectangular grid and to manually read the water
Article has been reviewed and approved for publication by the Soil & Water Division of ASAE. Trade names are used for illustrative purposes and to describe in detail the hardware used. This does not imply endorsement by the authors. The authors are Edson R. Zanon, Graduate Student, Roberto Testezlaf, Associate Professor, and Edson E. Matsura, Professor, State University of Campinas (UNICAMP), Agricultural Engineering School, Soil and Water Department, Campinas, SP Brazil. Corresponding author: Roberto Testezlaf, CP: 6011, Faculdade de Engenharia Agricola, Unicamp, 13083 - 970 Campinas SP Brazil, voice: 55.19.788.1024, fax: 55.19.7881010, e-mail:
[email protected].
volume caught by containers. This procedure is not only laborious but also a good source of errors. Evaluation of simplified test procedures have been performed by different researchers. Bilansky and Kidder (1958) used a radius layout with a 0.60 m (1.97 ft) collector spacing to study how water distribution was affected by the sprinkler parts. Kincaid (1982) evaluated sprinkler wetted diameter in indoor conditions using a radius layout with a collector spacing of 0.5 m (1.64 ft). Villas Boas (1994) compared three different collector layouts: square grid, radius, and CEMAGREF (modified radius); and recommended the use of a radius layout for indoor tests. He justified the recommendation due to the simplicity of the system setup and reduction in data recording time. Research into automating uniformity tests has been performed in order to reduce test duration, increase precision, and allow repeatability among trials. Several studies can be found in the literature describing the use of data acquisition systems in irrigation applications. Bennett and Evert (1980) and Foroud and Hlibka (1989) used automatic systems to monitor water level continuously. Fischer and Wallender (1988) developed a lab apparatus to perform sprinkler uniformity tests. Seginer et al. (1992) used the same principles and included control of discharge, operating pressure, and sprinkler riser angle. Doebelin (1983) suggested that most instruments or measurement systems can be defined using three basic elements: the sensor, the conditioner circuit, and the reading circuit. The use of automated systems in distribution tests requires a reliable sensor to record the volume accumulated inside each catch can. Dally et al. (1984) considered the transducer the main part of the
Applied Engineering in Agriculture VOL. 16(2): 123-127
© 2000 American Society of Agricultural Engineers 0883-8542 / 00 / 1602-123
123
sw 3359 ms
8/20/01
2:29 PM
Page 124
measurement system. Fischer and Wallender (1988) and Seginer et al. (1992) used a pressure transducer connected to a series of solenoid valves by a manifold. In their case, a computer controlled the solenoid valve status and read the value of the weight of water in each collector connected to the valve. Zanon and Testezlaf (1995) evaluated two load cells with a nominal capacity of 5 N (1.12 lbf) and 10 N (2.24 lbf). They concluded that both cells showed similar results, with regard to suitable and reliable performance as well as volume sensor. The objective of this work was to develop a data acquisition system to collect and monitor sprinkler uniformity distribution tests for low and medium pressure sprinklers using a two-radii collector pattern. To achieve this objective, it was necessary to accomplish the following: (1) develop collector-transducer devices using load cells; (2) adapt a data acquisition system to an IBM PC compatible computer; and (3) evaluate the performance of the developed system by comparing with manual readings.
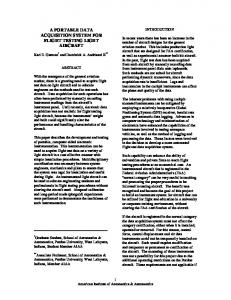
MATERIALS AND METHODS EQUIPMENT The developed data acquisition system consisted of a PC/AT 386 computer connected to an A/D converter that received analogue signals from the collector-transducer devices. Sixteen collector-transducer devices were built based on the load cell with the 10 N nominal capacity, manufactured by Alfa Equipamentos Eletronicos and evaluated by Zanon and Testezlaf (1995). Figure 1 shows a schematic view of the collector-transducer mounted device. The load cells produced an analog electrical output that was temperature-compensated and proportional to the weight of water accumulated inside the collectors. The cylindrical shaped plastic collector adapted to the load cell had a entrance diameter of 11 cm (4.3 in.) with a volume of 600 mL (20.3 oz). The output voltages from the load cells were interfaced to a PC/AT 386 computer through an analog/digital (A/D) board. The A / D boards were manufactured by Lynx Eletronicos with 12-bit resolution and 32 differential input channels. A computer program was supplied with the A/D boards for estimating and storing the calibration equations for the load cells. The A/D software recorded the output from the load cells in water volume units. For all measurements an acquisition frequency of 100 Hz was
Figure 1–Schematic view of collector-transducer. 124
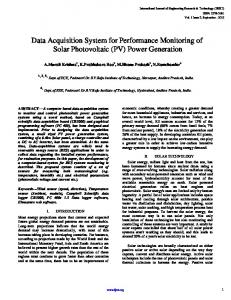
used, with a acquisition time of 15 s, generating 1,500 points for each reading time. PROCEDURE Three collector weight loading methods, increasing, decreasing, and random, were used to individually calibrate the load cells. Through this procedure it was possible to determine if the load cells displayed hysteretic behavior. To evaluate the performance of the data acquisition system under indoor environmental conditions, distribution uniformity tests were conducted at the Agricultural Engineering Division of the Agronomic Institute of Campinas—IAC (State of Sao Paulo, Brazil). Four tests of the Naan 501-U sprinkler using the same nozzle and working pressure were accomplished. The radius test layout was installed using two diametrical radii of collectors at 1 m (3.3 ft) spacings, with the first collector placed 50 cm (19.7 in.) from the sprinkler. The number of collectors used per radius was seven. Two collectortransducers filled with a known volume of water were placed outside the sprinkler wetted perimeter to estimate evaporation depth during each test. Figure 2 shows the sprinkler experimental setup. A centrifugal pump supplied water to the system from a constant level reservoir. The sprinkler flow rate was 120 L / h (31.7 gal / h ) for an operating pressure of 196 kPa (28 psi), which was controlled by a pressure regulator. The nozzle height was 1 m (39.4 in.) aboveground and around 60 cm (23.6 in.) above the top of the collectors. The test duration was 2 h. To verify the possibility of realtime use of the system, volume readings of each collector were taken by the DAS at 30, 60, 90, and 120 min after the beginning of the test. The average (over four tests) volume readings at the end of the test (120 min) for each collector position in both tested radius were compared to the average volume values estimated using a digital scale. The data obtained by both procedures were compared statistically and used to create an overlapping grid pattern for a 6 m (19.7 ft) × 6 m (19.7 ft) sprinkler spacing. Eight overlapping patterns were created using volume values from the single radius data of the four tests. The following uniformity coefficients were calculated and compared for the created overlapping pattern: Application efficiency of low quarter (AELQ), Distribution uniformity
Figure 2–Experiment setup. APPLIED ENGINEERING IN AGRICULTURE
sw 3359 ms
8/20/01
2:29 PM
Page 125
(DU), and Christiansen Uniformity Coefficient (CUC) (Christiansen, 1942).
RESULTS AND DISCUSSION The data obtained by both measurement procedures are presented in table 1 and compared statistically. The results show no statistical difference, at the 5% significance level, between the DAS and the scale readings in either sampled radii. In 75% of the compared volume readings, the collectortransducers showed values higher than the values obtained by the scale method. The mean difference was 1.26%. Table 1. Statistical comparison of collector mean volumes (ml) for both reading methods Radius 1 MeasureCollector ment Position Method
Mean Volume mL (oz)
Radius 2
Standard Deviation Tukey mL (oz) (5%)
Mean Volume mL (oz)
Standard Deviation Tukey mL (oz) (5%)
P1
DAS Scale
65.80 (2.22) 65.40 (2.21)
3.69 (0.12) 3.19 (0.11)
a a
67.58 (2.29) 1.83 (0.06) 67.31 (2.28) 1.32 (0.04)
a a
P2
DAS Scale
28.85 (0.98) 28.76 (0.97)
1.07 (0.04) 1.02 (0.03)
a a
29.03 (0.98) 1.56 (0.05) 28.66 (0.97) 1.57 (0.05)
a a
P3
DAS Scale
24.23 (0.82) 24.15 (0.82)
1.04 (0.04) 0.74 (0.03)
a a
23.19 (0.78) 1.37 (0.05) 22.91 (0.77) 1.05 (0.04)
a a
P4
DAS Scale
25.53 (0.86) 25.09 (0.85)
0.33 (0.01) 0.37 (0.01)
a a
24.47 (0.83) 0.77 (0.03) 23.87 (0.81) 0.63 (0.02)
a a
P5
DAS Scale
19.31 (0.65) 18.80 (0.64)
0.61 (0.02) 0.15 (0.00)
a a
18.71 (0.63) 0.56 (0.02) 18.20 (0.62) 0.54 (0.02)
a a
P6
DAS Scale
10.13 (0.34) 9.33 (0.32)
0.43 (0.01) 0.45 (0.02)
a a
7.96 (0.27) 0.75 (0.03) 7.86 (0.27) 0.55 (0.02)
a a
P7
DAS Scale
1.01 (0.03) 1.01 (0.03)
0.23 (0.01) 0.26 (0.01)
a a
0.83 (0.03) 0.34 (0.01) 0.70 (0.02) 0.27 (0.01)
a a
Though the differences were not significant, this bias could be explained by the experimental procedure. In all of the four performed tests, it was clear that there was a tendency of the water drops to adhere externally and internally to the catch can surface. Because the collector had to be removed from the load cell mounting to be weighed, its transportation distance of 10 m (3.48 ft) could result in the loss of this external water. The adhering volume of water decreased with the collector distance from the sprinkler. This variation can be explained by the drop size distribution pattern generated by the sprinkler along its radius. The application rate decreases and the droplet kinetic energy increases with the distance from the sprinkler, reducing water adhesion in the outer part of the wetted diameter. Figure 3 shows a comparison of the average volume values presented in table 1 for each of the 14 collector positions. Agreement of the readings was excellent when compared with the 100% accuracy line. The automatic and manual readings showed a linear correlation with the line slope approximately equal to one. Voltage readings from the load cells can be affected by different electrical noise sources. Data dispersions in all fourteen collectors readings were observed through the analysis of the standard deviation for 1,500 sampled points of each reading time. All four distribution tests had a maximum value of 0.35 mL (0.012 oz) for the standard deviation. Table 2 shows uniformity coefficient values for the overlapping grid pattern (6 × 6 m; 19.7 × 19.7 ft). The uniformity coefficients were not statistically different for
Figure 3–Comparisons of scale manually read and the data acquisition mean volume readings. VOL. 16(2): 123-127
125
sw 3359 ms
8/20/01
2:29 PM
Page 126
Table 2. Mean application rate, application efficiency of low quarter (AELQ), distribution uniformity (DU), and uniformity coefficient for (6 × 6 m; 19.7 × 19.7 ft) overlapping grid Method DAS Scale
Mean App. Rate mm/h (in./h)
AELQ (%)
UD (%)
CUC (%)
3.6 (0.15) 3.6 (0.15)
67.2 a 65.8 a
84.4 a 84.3 a
84.6 a 84.8 a
both reading methods, at the 5% significance level, as a result of statistical equality between the reading procedures. ACCUMULATED DISTRIBUTION PATTERN The developed data acquisition system allows observation of the variation in accumulated volume at intervals. Since there is no need to empty the collectors, the system can monitor the distribution pattern of the sprinkler and define the end of the test, based on the minimal applied depth criteria. Figure 4 shows the sprinkler accumulated volume for replication 1 with four application times (30, 60, 90, and 120 min). This feature of the data acquisition system makes it possible to observe how the applied depth increases with time, and to relate it to changes in the environmental conditions or in the sprinkler operating characteristics.
CONCLUSIONS The results demonstrate that an accurate, effective data acquisition system was developed for automatically performing sprinkler uniformity distribution tests indoors.
The following conclusions were derived from the study presented in this article: 1. No difference was found between the results generated by the data acquisition system and the manual measurement with digital scale, at the 5% significance level. 2. Since the output data are readily available in computerized format, it is possible to use the developed system on a real-time basis to monitor the changes in the sprinkler distribution pattern at specific time intervals. 3. The developed automated system proved to be easy to install, without requiring previous or specific skills for assembly. ACKNOWLEDGMENTS. Appreciation is extended to the Sao Paulo State Research Foundation (FAPESP) and the National Council for Research and Technology (CNPq) – Brazil for sponsoring this project, and to the Agricultural Engineering Division of the Agronomic Institute of Campinas for allowing the use of the its test sites.
REFERENCES Bennett, W. S., and C. Evert Jr. 1980. What Every Engineer Should Know About Microcomputers: Hardware/software Design. New York, N.Y.: Marcel Dekker, Inc. Bilansky, W. K., and E. H. Kidder. 1958. Factors that affect the distribution of water from a medium-pressure rotary irrigation sprinkler. Transactions of the ASAE 1(1): 19-28. Christiansen, J. E. 1942. Irrigation by sprinkling. Calif. Agric. Exp. Sta. Bul. 670. Berkeley, Calif.: University of California.
Figure 4–Accumulated water volume pattern for different application times. 126
APPLIED ENGINEERING IN AGRICULTURE
sw 3359 ms
8/20/01
2:29 PM
Page 127
Dally, J. W., W. F. Riley, and K. G. Mcconnell. 1984. Instrumentation for Engineering Measurements. New York, N.Y.: John Wiley & Sons. Doebelin, E. O. 1983. Measurement Systems: Applications and Design, 3rd Ed. New York, N.Y.: McGraw-Hill. Fischer, G. R., and W. W. Wallender. 1988. Collector size and test duration effects on sprinkler water distribution measurement. Transactions of the ASAE 31(2): 538-42. Foroud, N., and D. Hlibka. 1989. Instrumentation for simultaneous recording of water level in digital and graphical forms. Transactions of the ASAE 32(2): 538-42. Kincaid, D. C. 1982. Sprinkler pattern radius. Transactions of the ASAE 25(6): 1668-1672. Seginer, I., D. Kants, D. Nir, and R. D. von Bernuth. 1992. Indoor measurement of single-radius sprinkler patterns. Transactions of the ASAE 35(2): 523-33.
VOL. 16(2): 123-127
Silva, A. M., M. A. Vilas Boas, and M. S. Oliveira. 1994. Comparison of sampling methods for water spatial distribution in rotary sprinklers (in Portuguese). In Proc. XXIV Brazilian Congress of Agricultural Engineering, Paper No. 94-3-311, Campinas, SP. Brazilian Society of Agricultural Engineering. Solomon, K. 1979. Variability of sprinkler coefficient of uniformity test results. Transactions of the ASAE 22(5): 1070-80. Villas Boas, M. A. 1994. Sampling methods and analysis of water spatial distribution for rotary sprinklers (in Portuguese). M.Sc. thesis. ESAL, Lavras, MG. Zanon, E. R., and R. Testezlaf. 1995. Use of load cells in radius layout sprinkler uniformity tests (in Portuguese). In Proc. XXIV Brazilian Congress of Agricultural Engineering, 254, Viçosa., M.G. Brazilian Society of Agricultural Engineering.
127
sw 3359 ms
8/20/01
2:29 PM
Page 128