Keywords: traffic accidents, data mining, similarity index, learning systems. ... deployed soon: a construct of data mining system, simply by defining accident.
Urban Transport XVII
505
A data coding and screening system for accident risk patterns: a learning system F. Geçer Sargın1, Y. Duvarcı1, E. İnan2, B. Kumova3 & İ. Atay Kaya1 1
Department of City Planning, İzmir Institute of Technology, Turkey Department of Computer Engineering, İzmir University of Economics, Turkey 3 Department of Computer Engineering, İzmir Institute of Technology, Turkey
2
Abstract Accidents on urban roads can occur for many reasons, and the contributing factors together pose some complexity in the analysis of the casualties. In order to simplify the analysis and track changes from one accident to another for comparability, an authentic data coding and category analysis methods are developed, leading to data mining rules. To deal with a huge number of parameters, first, most qualitative data are converted into categorical codes (alpha-numeric), so that computing capacity would also be increased. Second, the whole data entry per accident are turned into ID codes, meaning each crash is possibly unique in attributes, called ‘accident combination’, reducing the large number of similar value accident records into smaller sets of data. This genetical code technique allows us to learn accident types with its solid attributes. The learning (output averages) provides a decision support mechanism for taking necessary cautions for similar combinations. The results can be analyzed by inputs, outputs (attributes), time (years) and the space (streets). According to Izmir’s case results; sampled data and its accident combinations are obtained for 3 years (2005 - 2007) and their attributes are learned. Keywords: traffic accidents, data mining, similarity index, learning systems.
WIT Transactions on The Built Environment, Vol 116, © 2011 WIT Press www.witpress.com, ISSN 1743-3509 (on-line) doi:10.2495/UT110431
506 Urban Transport XVII
1 Introduction Data management schemes have been popular lately, replacing mathematical or statistical models that are based on parameter estimation in predicting traffic accidents. Existing statistical models are not useful for different cultures. Dynamism that such models lack in estimating time (and case) sensitive results requires swifter traffic accident preventive methods, utilizing real-time data evaluation and dissemination processes. High capacity computers can handle evaluation of huge amounts of data and especially the real-time data. Inefficiently stored traffic accident report (TAR) data can be converted into more useful data for effective evaluation through a data management scheme for a possible early warning system. This study aims to solidly test the significance of the proposed scheme by comparing model years’ results with those of the test year. The scheme is expected to promise “learning” of accident attributes that will be useful for a dynamic database for timely notification of crash risks. Data mining techniques allow continuous data flow available for extraction of meaningful real-time information. However, the existing statistical model-based approaches tend rather towards general determination of specification of model parameters which do not always conform to the local conditions of a place and are not very useful in estimating the time and place (road segment possess risk) of accidents as well as the nature of the risk. This paper draws the major findings of the government-granted project started in the autumn of 2008. It proposes a novel method to evaluate the collected accident information from various sources, addressing the ITS needs to be deployed soon: a construct of data mining system, simply by defining accident classes starting from the most severe ones down to the least by coding plenty amount of accident attributes for pattern recognition. This process requires mass data processing. Each accident is assumed to be unique in its own attributes, leading to a vast conglomerate of combinations. The hypothesis is that if some factors compound, they may cause risk; identifying these combinations may let analyst to derive a pattern scheme that can be used for future estimation. This study examines the physical and spatial attributes of traffic accidents and thus, human factors are excluded. The final aim is to introduce an automata that has the capability of continuous “learning” for real-time early warning system on traffic safety on GIS, and the ITS applications.
2 Background Mathematical and statistical models are widely used in risk assessment for traffic accidents. Usually, the log-linear models are used in explaining the reasons of crashes on roads. For a defined duration, Poisson regression is suitable in determining the number of accidents [3]. On the basis of relationship between risk and traffic volume, Negative Binomial Model gave better solutions than Poisson [14, 16]. Kononov and Allery [14] defined an accident probability norm curve for road types and traffic volume.
WIT Transactions on The Built Environment, Vol 116, © 2011 WIT Press www.witpress.com, ISSN 1743-3509 (on-line)
Urban Transport XVII
507
In model-based studies especially, road and environmental factors have more effects [23, 25]. Additionally, weather and lighting conditions affect the accident risk [9]. The fact that accidents cannot solely be explained by stand-alone factors is the basic assumption on which this study rests [22]. The EU aims to prevent accidents by 50% by 2010, deploying all sorts of high technologies [13]. In the last decade, with the acceleration of informatics and ITS, it was seen that lots of traffic parameters can be tracked, thus, used in estimation models for accident risk. Video Detection Systems (VDS) are largely used in incident detection for dissolving. However, few studies concerned precautions before the accident happens. One study used the factor combinations concept and “Land use” and “environmental factors” are used as inputs. Data mining methods allows“pattern recognition” and “learning” mostly employing clustering techniques [15, 22]. Similarly, Chong and others state that artificial neural network approaches tree-based/artificial neural studies provided the most precise results. Sohn and Shin [21] was successful in explaining the severity of the accidents using categorical data analysis and data mining by degrading accident specifications. Technology, communication infrastructure, data management and data automation are important factors for such models. Data mining with massive data evaluation provides much more “usable” results, if not so precise and reliable, than statistical parametric models [10] especially for the overflowing data. In contrast, the other modeling approaches are highly dependent on rigorous pre-definition [6]. One of the famous data mining methods is CART (Classification and Regression Tree). Accordingly, strong relations between the accident rate and road infrastructure, environmental factors such as daily traffic density, weather conditions [5, 6, 27]. Al-Ghamdi [2] indicated that location and parameters are forthcoming amongst the others. Different studies have taken place for early warning systems. The basic assumption is to carry out surveillance of the roads in real-time, and detect possible risks, and finally alarm [11]. Recent studies of detection are to define firmly the black spots locations on GIS using cluster analysis [19]. For the accident frequency and persistence in time and location, similarity pattern between the observed year(s) is important. Similarity index method (SIM) is common in classification, clustering and CBR (Case-based Reasoning) studies [22]. SIM is used for matching and listing cases to measure similarities. While matching is executed by screening case database for indexes and weights, listing is ranked by last similarity grades [8]. Abdel-Aty and Abdelwahab [1] used a similarity index for crash severity goodness fits. The similarity index matrix represents unique frequency distribution of the accidents by chosen outputs for the street in question [26]. It is hard to point a standart protocol for similarity analysis, hence there is a variety of methods of statistical analysis and artificial intelligence techniques [12]. The important point in executing the similarity index is that the parameters must have comparable alpha-numeric values. Only then, the assigned similarity function can recall the new data and install it in the similar subgroups for listing [8]. WIT Transactions on The Built Environment, Vol 116, © 2011 WIT Press www.witpress.com, ISSN 1743-3509 (on-line)
508 Urban Transport XVII
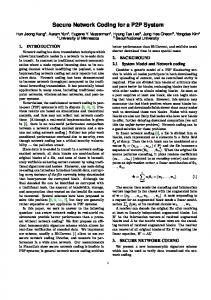
3 Data In Izmir, Turkey, the traffic department collects about 40 parameters, obtained from TARs. In this study, many more factors are added to these variables, mostly around the black spots and road infrastructure for 7 pilot streets (Figure 1), which are the most critical streets in Izmir city. The study is formulated around an analysis of plenty of data, to form a single large database.
Figure 1:
The seven streets concerned from where the TAR data is obtained (the accidents densities are shown by dots on the map).
Data is collected in three ways. Traffic Accident Reports (TARs): a three-year TAR data are used from 2005 to 2007. The first two years (2005-2006) is used for model building and 2007 data is used as the test year. In total 9784 data (of which 712 are fatal and 9072 are injured and material damage) were studied. Land use observations: road infrastructure and environs and its specifications (characteristics): In recent literature the “accident cause” term has been replaced with side effects term [17]. To detect these side effects, land use of road infrastructure and environs is an important tool. Traffic data from video detection system (VDS): The critical segments of the roads are determined where the accidents converge. The TraficonTM VDSs are located for collecting traffic data, and the data are analyzed by Traficon software. WIT Transactions on The Built Environment, Vol 116, © 2011 WIT Press www.witpress.com, ISSN 1743-3509 (on-line)
Urban Transport XVII
509
are located for collecting traffic data, and the data are analyzed by Traficon software. This study embodies an analysis scheme that allows multiple data treatment on one database (see Figure 2). For convenience in data analyses, a computer interface application (in Turkish), (using MYSQL database and Java EE language, Eclipse) which can be accessible through internet) is developed to pick parameters one-by-one, or as groups (input data groups) for the analysis in question (the red circled area). There are 6 basic input groups. In total, there are 40 input (cause) parameters and 17 output (consequence) parameters. Accident severity parameter results are aggregated and calculated as averages for every leading “accident factor combinations” and interpreted.
Figure 2:
Database interface of choosing inputs and outputs.
4 Categorical data conversion and combination ranking Before developing the software for ITS early warning application, all the parameters must be categorized into categorical codes that are defined with an alpha numeric correspondence, so that the computing and processing capacity is increased. Otherwise, the number of possible combinations would be infinite due to the uniqueness of each accident, if they were assigned open-ended parameter values. Thus, each parameter value was converted into relevant alpha-numeric code. Even in the case of obscurity, possible default value is assigned, rather than a “null” value, so that each accident can be identifiable under a discrete combination.
WIT Transactions on The Built Environment, Vol 116, © 2011 WIT Press www.witpress.com, ISSN 1743-3509 (on-line)
510 Urban Transport XVII Here, the aim is to sort combinations (i.e. accident types) according to a basic output parameter results starting from highest to the lowest value. The software developed does this automatically for the given output parameters, and for the chosen input parameter groups. The hypothesis is that every road will highlight different combination particular to its own environmental conditions. Primarily, an ordering of combinations by the numbers of accidents is listed, and then the severity (number of accidents with dead and/or injured). This is the projects’ major data mining rule. If a new accident happens and its values are entered to the database, the software scans the whole database for a similar combination set. The data evaluation protocol (algorithm) is beyond the limits of this paperwork presented here. The process of converting the parameter into alpha-numeric categorical codes has been processed as follows: If there are 3 input parameters such as A, B and C and the control output parameter is 0 as accident number. If A takes 2 values (1, 2); B takes 4 (1, 2, 3, 4) and C takes 3 (1, 2, 3), then the maximum number of combinations is defined by how many ways these values come together for all three parameters referring to 2×4×3=24 (or K1, K2, … , K24). It means that these parameter values may be combined in a maximum of 24 different and unique ways.
5 Method of similarity index Any accident is unique due to its special combination of factors (inputs). Yet, as mentioned before, if the factor values are reduced to few categorical values and if the combining factors are coded, many similar accidents can be grouped into the same combinations that can later be identified easily; not the accidents but the accident combinations are the database. Thus, the work load is reduced. Today’s vast computing capabilities ease managing this mass amount of data. Main aim is to explore the forthcoming accident combinations, and their features, of which the most severe ones will be subject to the early warning database. The basic outputs for which the combinations are found can be ‘number of accidents’, ‘number of fatal injured accidents’, ‘number of vehicles’, etc. This way of data analysis brings together the learning of risk patterns. The method is made up of 5 steps: 1. Determination of accident-dense pilot streets from the 2005 accident data and defining the most accident-dense segments on GIS. 2. Data collection a. TAR data collection from the Local Police Department for the concern streets b. Land use and environmental data collection (which are constant data per street) c. Traffic data collection from the VDS video cameras 3. Conversion of non-categorical (integer) values into categorical values (for input type data). Original data dispersions are regarded for better and homogeneous categorical value assignments. Usually, 3 or 4 categorical values are assigned at most to represent the original value dispersions for WIT Transactions on The Built Environment, Vol 116, © 2011 WIT Press www.witpress.com, ISSN 1743-3509 (on-line)
Urban Transport XVII
511
each parameter, which is very important to reduce the value space into few values, so that similar accidents can arise and be merged into same combinations. This way, the data can more easily be managed. 4. Construction of single database for all 4 types of data, but split into input (factors) and output (dimensions), and the design of internet interface for the data communication (data entrance and query). 5. Data management and communication through software: a. totaling the “same value” accidents under the common accident combination, aggregating (averaging) their output values, b. listing (ranking) the most severe 50 accident combinations, by various output parameters, or by a bundle of outputs, c. executing the same processes with the 2007 test year data using clustering, d. comparing the model years’ results with those of test year results for each street using similarity index: If the results are similar to each other, conclude that the data management scheme is useful for a possible “early warning system” to be deployed on the urban streets. If the results do not match, then announce that the developed approach has no use and is not worth being applied on real ground. 2007 test years’ combinations listing results 1. row 2005-2006 model years
1. row
results
3. row
2. row
2.row
3. row
4. row
* ** ***
4. row * White area is the most similar (parametric values have 0, 1 or 2 difference) ** Grey area is more-or-less similar (3, 4 or 5 difference) *** Dark area is not so similar (6 or above difference in parametric values) Figure 3:
Ideal matrix model explanation for similarity analysis.
As seen in the ideal similarity index matrix (see Figure 3:), to compare the two-year combinations, the similarity levels are expected to be higher at the upper-left of the matrix where the coloring is lighter (ideal value is 0). At the darker cells, similarities decrease and 0 values are rare. For data evaluation first, accident frequency is listed down from highest to lowest value to determine the combinations that more number of accidents is caused (First 50 rows). Then data of 2005-2006 are compared to test year 2007 data for each road separately. A unique similarity value (Bkl) is obtained with the comparison. While x indicates any individual similarity parameter (factor), k is the combination pair that is compared, p is the individual parameter that each two combination compared one-on-one, o vector is the learning from model years, and t is the test year value:
WIT Transactions on The Built Environment, Vol 116, © 2011 WIT Press www.witpress.com, ISSN 1743-3509 (on-line)
512 Urban Transport XVII Bkp = xokp – xtkp After B is calculated, the derived values converted into binary system: If B ≠ 0, takes value 1, B = 0, takes value 0. It can be derived that if the similarity takes value 0, then the factors for compared combinations are the same (if all the values take 0, two combinations are completely the same), if the value takes 1, there is dissimilarity, for at least one parameter. The basic listing rule of the data mining for similarity analysis is that as an accident X0 is ranked by the chosen parameters (outputs), when the new accident data is processed, it is added to the total number of X0 listing, if not a new X1 is defined. Listing, at the same time, is done according to the crash severity by chosen parameters. If the value of X1>X0 then X1 rise up within that listing. The software scans the new data as it enters the database for similar incidents, revealing a pattern for learning risk levels on the streets. For the similarity comparison, ideally every combination of the model years had to be compared with every combination of the test year. This way, for each same input, there would be a Bkl in every combination pair. Yet, the aim is to find one total value for the compared combination pair: M: Combination comparison total value: Combination pair is “similarity index”. Mot = ∑nn=1Bkp Here, M value is calculated in o and t combination pair dimensions and an o×t matrix (one dimension is the model years of 2005-2006), o, is the combination order and the other dimension is the test year (2007) combination orders) values are inserted. For every combination pair processed, Combination Similarity Index matrix is formed and called “CSI matrix”. Ideal index number for CSI values (Mot) is 0 and it is expected to have the highest value in number of accidents of both the model and test years, hence, placed at the top-left of the CSI matrix. The model “consistency” analysis (model and test year consistency) searches if it is realized and to what extent. If the results of the consistency analysis fit then the proposed data management scheme is testified for the next step of the early warning system, and the method can be used in real life. For legibility, the CSI results have been formed in monochromatic color order from white to dark grey. According to this, in the matrix, total value of 2 or less are white (CSI values are ideal or close), if it is between 3 to 5 are grey (less similar), and values 6 and above are dark grey (non-similar) to elicit legibility. To put forward the results of the analysis and the similarities, a matrix is formed for each street and color codes are used to see if it matches to the ideal matrix. The cells are colored from white to dark grey according to the values they take. Furthermore, for some streets, first rankings (first years’ first rows and second years’ latest rows) a 4×4 frame value sums are compared. As a general rule, the sums of the first comparisons must be small, and the latter ones must be WIT Transactions on The Built Environment, Vol 116, © 2011 WIT Press www.witpress.com, ISSN 1743-3509 (on-line)
Urban Transport XVII
513
high, which was observed in this study. See Figure 4: for the CSI matrix for 3 of the pilot streets in question as an example.
6 Similarity index results and discussion It is determined that when the first year’s first 10 rows are compared with the second year’s first 10 rows, there are more combinations matching. It is wiser to compose raw orders such as first 10 with first 10, then continuing with the next
CSI Matrix for Yeşildere Street
CSI Matrix for Cumhuriyet Boulevard
CSI Matrix for Altınyol Street Figure 4:
CSI Matrix examples for 3 different pilot streets.
WIT Transactions on The Built Environment, Vol 116, © 2011 WIT Press www.witpress.com, ISSN 1743-3509 (on-line)
514 Urban Transport XVII 10, and so on. To execute this routine, the first frontcoming combination raws were also compared to the last raws and the results are in general quite disparate from each other as expected as the degree of non-matching. If the similar combinations were not to be found at the front lines, it can be infered that the accidents occur independent from the environmental and infrastructural factors. initial raws seem similar whereas the latter listings are different, as expected. For the time being, the CSI matrixes are executed only according to “number of accidents” as of severity output. Output for accident number promises a meaningful similarity matrix layout for some exemplary streets, as can be seen in Figure 4. In the figure, only the best results (3 streets out of 7) were presented. The combination rankings are promising: the frontier cells (upper-left cells in the matrices) are much “whiter”, and the dawnward (lower-right) cells are darker. This means that the factors and levels causing the risk in model years are almost the same with the ones for the test year. As hypothesized, this situation proves the reliability of the scheme proposed for the ITS data management system. On the other hand, number of vehicles involved and fatal-injured accidents outputs for accident severity do not confirm. Likewise, in terms of all the street studied, for all the inputs, the similarity analysis doesn’t give meaningful distributions. The first 4×4 frame value sums the ideal values are for the first listings should be closer to 32 for ideal similarity. For the light grey area this sum cannot be more than 80. The results of CSI Matrixes of three streets above according to the mentioned rule of sums are in an acceptable range. As moving to the latter frames, the sums are higher which indicate dissimilarity as expected. The results are satisfying for the multiple factors any accident indicates, and a slight deviation to some extent is normal due to the uncertainty, and unconsidered other factors. According to the analysis, accidents do occur in almost ideal road, environment and weather conditions. Especially when the accident risk combinations indicate approximately normal parameter values, it may be concluded that the human factor (including cultural variables) is still the most explanatory determinant in the happening of the accidents.
7 Conclusion In this study, the main purpose is to obtain ranking of accident factor combinations starting from the highest to the lowest by the chosen output parameters such as the number of accidents, so that the critical combinations (compounding factors) causing the risk can be obtained systematically. This listing is effectuated by similarity analysis techniques as of data mining rule. ITS is a possible area where the data mining method of combination ranking results provided in this study can be used as the database in revealing the risk levels depending on the changing road, weather or traffic conditions. This “pattern learning” database would serve for the VDS-based accident risk evaluation system for the major urban streets (critical ones, at least) continuously collecting data, and screening the mentioned conditions whether they are severe conditions or not. If severe conditions repeat at a given time, then the system produce early warning signal for the safety authorities. The abovementioned WIT Transactions on The Built Environment, Vol 116, © 2011 WIT Press www.witpress.com, ISSN 1743-3509 (on-line)
Urban Transport XVII
515
similarity index (CSI) matrices are tested for three-year accident data and for the seven case streets and proves that the proposed system promises to be fruitful as far as the model year’s combination rankings appeared to be highly similar to the test year’s rankings. CSIs are exemplified according to number of accidents output parameter for measuring severity levels. Yet, it is impossible to manage the data manually. Thus, an automata can be embedded to ITS to make the data manageable for an early warning system and for its “learning” capability. To intensify learning, a k-nearest neighbor algorithm can be introduced to inquire if CSI falls within a convergence criterion, let say 20% of similarity coefficient. The rankings can be obtained according to the case, either by input, output, time, or place. CBR and k-nearest neighbor algorithm may be a meaningful approach for similarity analysis. After the testing and learning phase for a while, software can process the real-time data for early warning system.
Acknowledgement This research study is sponsored by The Scientific and Technological Research Council of Turkey (TUBITAK).
References [1] Abdel-Aty M. & Abdelwahab H. T., Predicting Injury Severity Levels in Traffic Crashes: A Modelling Comparison. Journal of Transportation Engineering, 130 (2), pp. 204-210, 2004. [2] Al-Ghamdi, A.S., Using Logistic Regression to Estimate The Influence of Accident Factors on Accident Severity. Accident Analysis and Prevention, 34, pp. 729-741, 2002 [3] Andrey, J. Risk Assessment. The Geography of Transport Systems, (eds. J.P. Rodrigue, C. Comtois and B. Slack), Routledge: New York, 2003 [4] Bernardo N. & Ivan J., Predicting Number of Crashes Versus Crash Rate Using Poisson Regression. Transportation Research Board Annual Meeting, Washington DC, 1998. [5] Chang L.Y. & Chen W.C., Data Mining of Tree-Based Models to Analyze Freeway Accident Frequency. Journal of Safety Research, 36(4), pp. 365375, 2005. [6] Chang L.Y. & Wang H.W., Analysis of Traffic Injury Severity: An application of Non-Parametric Classification Tree Techniques. Accident: Analysis & Prevention 38(5), pp. 1019-1027, 2006. [7] Chong, M., Abraham. A. & Paprzycki, M., Traffic Accident Analysis Using Machine Learning Paradigms. Informatica, 29(1), pp. 89-98, 2005. [8] Çınar, A.K. Vaka Tabanlı Mantık Yürütme ve Coğrafi Bilgi Sistemlerinin Şehir Planlamada Entegre Kullanımı, 1. Ulusal Planlamada Sayısal Modeller Sempozyumu, İstanbul, pp. 161-193, 2010 [9] Golob, T.F. & Recker, W.W., Relationships among urban freeway accidents, traffic flow, weather and lighting conditions. ASCE J. Transport. Eng. 129, pp. 342–353. 2003. WIT Transactions on The Built Environment, Vol 116, © 2011 WIT Press www.witpress.com, ISSN 1743-3509 (on-line)
516 Urban Transport XVII [10] Gylmour, C., Madigan, D., Pregibon, D., & Symith, P., Statistical Inference and Data Mining. Communications of the ACM, 35(11), pp. 35-41, 1996. [11] Hernández, N., Thesis. Toulouse: LAAS, 1999 [12] Holt, A., MacDonell, S., & Benwell, G. Assessing the Degree of Spatial Isomorphism for Exploratory Spatial Analysis, 1998, http://www.geocomputation.org/1998/17/gc_17.htm [13] Hook, P. Preventative Medicine, Traffic Technology, pp. 25-27, 2004 [14] Kononov, J. & Allery, B. Level of Service Safety; A Conceptual Blueprint and Analytical Framework. Transportation Research Record: Journal of the Transportation Research Board, 1840, pp. 57-66, 2003 [15] Kulmala, R., 1995. Safety at Rural Three- and Four-Arm Junctions: Development and Application of Accident Prediction Models. Technical Research Center at Finland, VTT Publications, Espoo. [16] Kusumawati, A. & Diew V.Y. Road Traffic Accidents Model for Signalized Four-Legged Junctions. Civil Engineering Research, 19 pp. 86, 2006 [17] Lee, S.B., Lee, T.S., Kim, H.J. & Lee, Y.K. Development of Traffic Accidents Prediction Model with Intelligent System Theory. Computational Science and It’s Applications ICCSA International Conference, eds. O. Gervasi, M.L. Gavrilova, V. Kumar, A. Laganà, H.P. Lee, Y. Mun, D. Taniar, C.J.K. Tan, Springer-Verlag: Berlin Heidelberg, pp. 880-888, 2005. [18] Nelson L. J. Appetite for Dedection, Traffic Technology, pp. 20-25, 2005. [19] Petzold, R., Herbel, S. & Franceschi, T. Conscious Objector: Reducing Highway Fatalities, Traffic Technology, pp. 19-22, 2003 [20] Sabel, C.E., Kingham, S., Nicholson, A., Bartie, P., Road Traffic Accident Simulation Modelling – A Kernel Estimation Approach. SIRC 2005 – The 17th Annual Colloquium of the Spatial Information Research Centre, University of Otago, Dunedin, New Zealand, 2005 [21] Sohn, S Y and Shin, H, “Pattern recognition for road traffic accident severity in Korea”, Ergonomic 44 (1), 2001, pp. 107-117 [22] Steenberghen, T., Thomas, I. & Geert, W. Scientific Support Plan for a Sustainable Development Policy SPSD II. Project CP/34: Innovative Spatial Analysis Techniques for Traffic Safety, 2003 [23] TRB Committee, Safety Data, Analysis and Evaluations: Summary of Recent Work Transportation Research Board, 2004. [24] Tuncuk M. & Karaşahin M. Determining Traffic Accident 'Black Spots' Locations By Using GIS: A Case Study In Isparta City. Third Geographic Information Systems Informatic Days, 2004 [25] Vogt, A. & Bared, J. Accident models for two-lane rural segments and intersections. Transport. Res. Record 1635, pp. 18–29, 1998. [26] Williams, W.T., Principles of Clustering, 1971. Annual Reviews Online, pp. 311, www.annualreviews.org [27] Yan X., Radwan E., Analyses of Rear-end Crashes on Classification Tree Models. Traffic Injury Prevention, 7(3), pp. 276-282, 2006.
WIT Transactions on The Built Environment, Vol 116, © 2011 WIT Press www.witpress.com, ISSN 1743-3509 (on-line)