To exploit the abilities of the new hardware monitor, a software infrastructure .... Valgrind CPU emulation layer, the cache simulator and monitor simulator are.
A Data Structure Oriented Monitoring Environment for Fortran OpenMP Programs� Edmond Kereku, Tianchao Li, Michael Gerndt, and Josef Weidendorfer Institut f¨ ur Informatik, Technische Universit¨ at M¨ unchen, Boltzmannstr. 3, D-85748 Garching bei Mu¨ nchen, Germany {kereku,lit,gerndt,weidendo}@in.tum.de
Abstract. This paper describes a monitoring environment that enables the analysis of memory access behavior of applications in a selective way with a potentially very high degree of detail. It is based on a novel hardware monitor design that employs an associative counter array to measure data structure related information at runtime. A simulator for this hardware monitor is implemented, providing the capability of on-thefly simulation targeting shared memory systems. Layers of software are constructed to operate and utilize the underlying hardware monitor, thus forming a complete monitoring environment. This environment is useful to help users to reason about optimizations based on data reorganization as well as on standard loop transformations.
1
Introduction
This paper describes a novel approach for analyzing the memory access behavior of OpenMP applications developed in the German project EP-Cache. It is based on a hardware monitor designed to be integrated into cache controllers which provides counters that can be configured to measure events for certain address ranges. This hardware monitor enables nonintrusive analysis of access overhead to data structures in the program. While state of the art hardware counters in modern CPUs can only be used to measure access behavior for program regions or program lines, this hardware monitor is capable to give, for example, information about the number of cache misses for a specific array in a loop of the program. This information can then be used in the identification of transformations for optimizing the cache behavior of applications. Especially for data structure transformations, such as padding, it will be very useful. To exploit the abilities of the new hardware monitor, a software infrastructure is required to collect and map the measured information back to the symbols in the program. This paper describes this software infrastructure as well as a simulator for the hardware monitor which enables us to investigate the advantages �
The work presented in this paper is mainly performed in the context of the EPCache Project, funded by the German Federal Ministry of Education and Research (BMBF).
M. Danelutto, D. Laforenza, M. Vanneschi (Eds.): Euro-Par 2004, LNCS 3149, pp. 133–140, 2004. c Springer-Verlag Berlin Heidelberg 2004 �
134
E. Kereku et al.
obtained from having this data structure-related information in the optimization process. Section 2 gives an overview of the monitoring infrastructure. Section 3 describes the individual components of the infrastructure. Section 4 presents a monitoring scenario and Section 5 the analysis and optimization of Gauss Elimination.
2
An Overview of the Monitoring Infrastructure
Monitoring data structures in a selective way is a demanding task. It requires knowledge about the involved data structures, the state of application execution, as well as the state of different memory levels present in the system - all of these have to be taken in account in a coordinated way. We designed our monitoring system to meet those requirements in the first place, but taken others into consideration as well, such as portability and extendibility. The primary goal is to give more detailed information about memory access behavior in Fortran OpenMP programs targeting specific data structures. Programs written in other programming languages as well as MPI programs can also be analyzed with our environment provided that the language-specific instrumenters for program regions and data structures are available.
Performance Analysis Tools
F90 OpenMP Program
Code Regions Instrumenter
Data Structures Instrumenter
Executable
Compiled and Linked with: Monitoring Library DS Mapping Library Simulator Library Monitoring Library
Instrumented F90 OpenMP Program
Monitoring Library Interface
Application
MRI Monitor Control Component
ADAPTOR Runtime System Mapping Data Structures to Virtual Addresses
Execution includes Monitor and Cache Simulator
ePAPI Interface
Hardware Monitor
(a)
MRI
Performance Analysis Tools
(b)
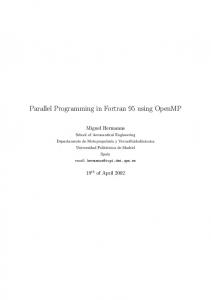
Fig. 1. (a) The central component is the Monitoring Control Component(MCC), which controls the application’s execution, and manages different hardware and software monitoring resources. (b) An application must go through several preprocessing procedures before it can be monitored.
Figure 1 depicts the building blocks of our monitoring system, focusing on the Monitor Control Component (MCC). The MCC provides two APIs: Monitoring Request Interface (MRI)[4] and the monitoring library interface. Via MRI, performance analysis tools1 can specify monitoring requests and retrieve runtime data. The MCC converts MRI requests into many low level 1
In the rest of the paper we interchangeably use the terms “Tool” and “Performance Tool” always refereeing to a Performance Analysis Tool.
A Data Structure Oriented Monitoring Environment
135
requests which are addressed to different sensors2 . Those sensors can be hardware counters, e.g. counting cache misses, or software sensors, e.g. information about the current state of program execution. The information provided by the sensors is subsequently processed by the MCC - for example, the information is aggregated through region instances or threads upon request from the tools, producing in this way the required profile or trace data. The monitored application calls the monitoring library at instrumented regions. This library implements parts of the MCC. Some preprocessing procedures are necessary before we can start monitoring an application (Figure 1). First, a Code Region Instrumenter (see Section 3.3) inserts calls to the monitoring library(Section 3.5) at the entry and exit of regions in a selective way. A second instrumentation is done by the Data Structure Instrumenter based on ADAPTOR [7] to generate information about the application’s data structures, such as their virtual address range. In the next step, the application is compiled and linked with libraries, including the monitoring library, the simulator libraries and the ADAPTOR runtime system library, producing an executable. Finally the program is executed which includes a simulation of the cache hierarchy and the new hardware monitor. During the execution, performance tools request and access performance data via the MRI. The whole process can be automated. We provide a simple script which takes source files of the application as input and generates the executable.
3
Resources for Data Structure Monitoring
3.1
The Hardware Monitor
The proposed hardware monitor [6] enables non-intrusive performance monitoring of access overhead for specific data structures. It can be configured into two working modes. The static mode allows to count predefined events or accesses to specific memory regions of interest. This can be used to monitor given data structures or parts of arrays, in order to get such information as L1 cache misses for array A, L2 caches hits for array B etc. The dynamic mode enables a finegrained monitoring of memory accesses to selected address ranges. It provides a histogram, e.g., for the cache misses of array A. The histogram’s granularity can be configured as multiples of cache lines. 3.2
Hardware Monitor Simulator
While the hardware monitor is still only a concept, currently, a simulation of the monitor is used instead. Though this environment can only catch memory accesses happening in user space of target processes, this enables the development of performance tools and optimization techniques. 2
Our Hardware Monitor plays in the Figure 1 the role of sensor. MCC accesses it through ePAPI, a PAPI [10] alike interface with the extension of histogram support.
136
E. Kereku et al.
The simulation and monitoring environment is capable of providing detailed information about the runtime cache access behavior, and is composed of the following modules: a runtime instrumentation module which instruments the program’s load/store operations while the program is executing, a cache simulation module which simulates a hierarchy of caches on processors with shard memory, and a monitor simulation module which simulates the hardware monitor exactly as it was described in the last section. The runtime instrumentation module provides the capability of on-the-fly cache simulation for OpenMP programs, which is enabled by the Valgrind [9] runtime instrumentation framework. This allows catching all memory references of an IA-32 binary, including SIMD instructions introduced in modern Intel processors (MMX/SSE/SSE2). While the instrumentation is done inside of the Valgrind CPU emulation layer, the cache simulator and monitor simulator are linked to the target binary, and are notified via a callback mechanism each time there is a memory access. 3.3
Code Region Instrumenter
To be able to measure performance data for regions in the program code, the application has to be instrumented. We developed a Fortran 95 instrumenter based on the NAG compiler frontend. It instruments sequential regions, taking into account multiple exits from regions, as well as OpenMP regions [5]. For OpenMP we follow the work of Bernd Mohr et. al. in Opari [3] and POMP [1]. The programmer can select which regions are instrumented by using appropriate command line switches. This is especially important when instrumenting sequential loops. Sometimes it might be beneficial to instrument nested loops, although the measurement overhead can be quite high. The instrumenter generates information about the instrumented region in an XML-Format that was designed in the APART working group. It is called the Standard Intermediate Program Representation (SIR). Besides the file and the lines covered by a region and the region type, we also collect information on the data structures accessed in the region. For arrays, the generated XMLrepresentation specifies the data type as well as the array size if it is statically known. This information can be used to help the user and automatic tools to select appropriate data structures for measurements. 3.4
Data Structure Instrumenter
To be able to measure, for example, the L1 cache misses of a data structure with the hardware monitor, we need to know the virtual address range of the data structure at runtime. Our current implementation uses some components of the ADAPTOR compilation system. ADAPTOR inserts for all arrays code which handles array descriptors at runtime. These store, besides other information, the address range to which the array is mapped. For scalar variables this information can easily be obtained without special support. The ADAPTOR runtime system
A Data Structure Oriented Monitoring Environment
137
also provides an interface through which our monitor can retrieve the current virtual address range for a specific data structure. This kind of implementation restricts our monitoring to data structures in code regions that are already allocated when the region is entered. 3.5
Lightweight Monitoring Library
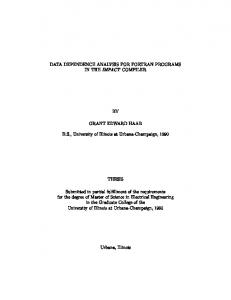
The monitoring library implements the function calls that are inserted into the application by the Program Region Instrumenter. Although the instrumentation is done only for selected regions, most of the instrumented regions will actually not be measured. The tools can and should request only information required for the analysis via the MRI. Thus, most of the calls will actually be empty calls and should have as little overhead as possible. Due to the numbering scheme of code regions, which is based on a file number and the regions first line number, we had to implement the Configuration Table for storing MRI requests as a hash table (see Figure 2). Each table entry represents an instrumented region. It has a flag that is only set if there is an MRI request appended to the region. This way, the minimal weight of a library call is basically reduced to the access time for the hash table. 3.6
Monitor Control Component
MCC (ref. Figure 2) is the central component that glues all the resources described in the previous sections together and communicates with the performance analysis tool. It is responsible for the initialization and configuration of resources, for handling MRI requests, and for postprocessing and delivery of the runtime information. For handling MRI requests for specific data structures, the MCC translates the variables names into virtual addresses and vice versa. Configuration Table
Monitoring Control Component
Application Region_Enter()
Monitoring Library
Region_Exit()
LOAD STORE
Current Region Information
42 42 42 42 46 46 46 46 47 47 1 12 27 39 1
8 31 38 7 14
X
X
X
X
X
X
File ID Line Number
X
Performance Analysis Tool
MRI Request
Configure
Configure
Simulator Get Results
Monitoring Resources Configurator
Aggregator
Results Put Results
Add MRI Request
Next Get Results
Runtme Information Producer
Shared Memory Space
Fig. 2. A more detailed view of our system revealing some internal functionality and implementation details.
138
4
E. Kereku et al.
Monitoring Scenario
Our monitoring system is structured into two processes, the application process and the tool process. These processes communicate via a System V shared memory segment. Accordingly, the system is implemented as two libraries. The first library, linked to the application, contains the monitoring library, the MCC functionality and the simulator. The other library, linked to the analysis tool, implements the Runtime Information Producer (RIP) responsible for MRI processing at the client side (Figure 2). At runtime, the first statement executed by the application is the initialization of the MCC. The application is blocked during initialization until the analysis tool specified MRI requests and released the application. The MCC initializes all monitoring sensors, retrieves the region structure of the application from SIR, and builds up a configuration table in the shared segment. The configuration table is implemented as a hash table, where the couple of file ID and region first line number serves as the key. When the tool is started, it will first initialize the RIP and wait for a READY signal of the MCC. It will then specify MRI requests which are validated and attached to the appropriate region entries in the configuration table by the RIP. The requests specify the requested runtime information (e.g. the number of L1 cache hits), information about the target code region and eventual data structures, and any desired aggregation. The data structure provides also space for the measurement results. Once the tool finished its initial requests3 , it specifies where the program should stop (usually the end of a region) and the MCC is notified to start the application’s execution. At the enter and exit point of each instrumented region, the region instrumenter inserted a call to the monitoring library. When the control flow enters the library, MCC looks up the configuration table for an MRI request that is appended to the current region. If such a request exists, symbolic data structure information will be translated into virtual addresses if necessary and the monitor will be configured accordingly. After that, the control is returned to the application. At the end of the monitored region, MCC stops the monitor, retrieves the results, aggregates the results if required, and transfers the results to the space reserved by the MRI request. When the end of a region corresponds with the specified halting point, the tool is notified and the application, together with MCC, is blocked again. 3
We say initial because the tool can make other requests at any time. The synchronization between MCC and RIP allows interruption of the program for getting partial results or for making new requests. This is particulary useful if the Tool can make new decisions (followed by new requests) starting from the data gathered until the present state of application’s execution.
A Data Structure Oriented Monitoring Environment
5
139
Analysis and Optimization of Gauss Elimination
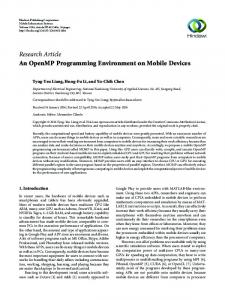
In order to illustrate the usefulness of the monitoring system, we use a Fortran 90 program for solving linear equations, Ax = b, using Gauss elimination without pivoting. Variable A, a two dimensional real array (100x100), is chosen as the target data structure of monitoring. Figure 3 presents two access histograms for L1 cache, including events of read hits, read misses, write hits and write misses. The x-axis shows the relative position of the access, with the whole memory range for A evenly divided into 25 portions. The y-axis represents the number of events. Both measurements target code regions that constitute the numerical kernel, excluding the initializations etc. counts
counts
Original
Optimized
80000
80000 LC1_WRITE_MISS LC1_WRITE_HIT LC1_READ_MISS LC1_READ_HIT
70000 60000 50000
LC1_WRITE_MISS LC1_WRITE_HIT LC1_READ_MISS LC1_READ_HIT
70000 60000 50000
40000
40000
30000
30000
20000
20000
10000
10000 0
0 1234 5678 9 101112 13
14 15 16 17
18 19 20 21
22 23 24 25
LC1_READ_HIT LC1_READ_MISS LC1_WRITE_HIT LC1_WRITE_MISS
1234 5678 9 101112 13
14 15 16 17
18 19 20 21
22 23 24 25
LC1_READ_HIT LC1_READ_MISS LC1_WRITE_HIT LC1_WRITE_MISS
Fig. 3. Cache access histograms for the original and optimized Gauss program.
The left part of Figure 3 illustrates the access histogram of the original Gauss elimination program. The most significant feature of this histogram is the high value of read misses and very low level of read hits. This encouraged us to optimize the original program with different optimization techniques, such as loop unrolling etc, and we finally derived an optimized version of the Gauss program with better utilization of the hardware. The right part of Figure 3 presents the access histogram of the optimized program. It can be clearly seen from this diagram, that the read misses are significantly reduced.
6
Future Work
This paper presents the current status of the development of a monitoring system for measuring the memory access behavior for specific data structures. It is based on a novel hardware monitor design.
140
E. Kereku et al.
In the near future we plan to enhance the automation scripts driving the preprocessing and to make a full implementation of the monitor available. We will develop a version of the monitor that works with the PAPI interface and will thus be able to access the current hardware counters of modern microprocessors. Another effort will be made to port our ePAPI interface to Itanium architectures taking advantage from this processor’s support on monitoring predefined data address spaces. We are also working on mapping variables to virtual address based on debug information. Within the EP-Cache project we will also develop an automated performance analysis tool that does an incremental online analysis as described in the monitoring scenario on top of our monitor. The tool will be based on a formalization of performance property with the APART Specification Language (ASL).
References 1. B. Mohr, A. Malony, S. Shende, F. Wolf: Design and Prototype of a Performance Tool Interface for OpenMP, Journal of Supercomputing, Vol. 23, pp. 105 - 128, 2002 2. A. Malony, B. Mohr, S. Shende, F. Wolf: Towards a Performance Tool Interface for OpenMP: An Approach Based on Directive Rewriting, EWOMP 01, Third European Workshop on OpenMP, 2001 3. OpenMP Pragma and Region Instrumentor, www.fz-juelich.de/zam/kojak/opari 4. M. Gerndt, E. Kereku: Monitoring Request Interface Version 1.0, http://wwwbode.in.tum.de/∼kereku/epcache/pub/MRI.pdf 5. M. Gerndt, E. Kereku: Selective Instrumentation and Monitoring, to be published: 11th Workshop on Compilers for Parallel Computers (CPC 04), Kloster Seeon, 2004 6. M. Schulz, J. Tao, J. Jeitner, W. Karl: A Proposal for a New Hardware Cache Monitoring Architecture, Proceedings of SIGPLAN Workshop on Memory System Performance (MSP 2002), Berlin, Germany. June 2002 7. ADAPTOR (Automatic DAta Parallelism TranslaTOR) http://www.scai.fraunhofer.de/291.0.html 8. A-T. Nguyen, M. Michael, A. Sharma, J. Torrellas: The Augmint Multiprocessor Simulation Toolkit for Intel x86 Architectures, Proceedings of 1996 International Conference on Computer Design. October 1996 9. N. Nethercote and J. Seward: Valgrind: A Program Supervision Framework, Proceedings of the Third Workshop on Runtime Verification (RV’03), Boulder, Colorado, USA. July 2003 10. S. Browne, J. Dongarra, N. Garner, G. Ho, P. Mucci: A Portable Programming Interface for Performance Evaluation on Modern Processors, The International Journal of High Performance Computing Applications, 14(3), Fall 2000. Pp. 189–204.