Submitted to International Journal on Automated Software Engineering
A Debugging and Testing Tool for Supporting Software Evolution D. Abramson R. Sosic School of Computing and Information Technology Griffith University Kessels Rd, Brisbane, Queensland, 4111 {davida, sosic}@cit.gu.edu.au Phone: +61-7-3875 5049 Fax: +61-7-3875 5051
ABSTRACT
This paper describes a tool for debugging programs which develop faults after they have been modified or are ported to other computer systems. The tool enhances the traditional debugging approach by automating the comparison of data structures between two running programs. Using this technique, it is possible to use early versions of a program which are known to operate correctly to generate values for comparison with the new program under development. The tool allows the reference code and the program being developed to execute on different computer systems by using open distributed systems techniques. A data visualisation facility allows the user to view the differences in data structures. By using the data flow of the code, it is possible to locate faulty sections of code rapidly. An evaluation is performed by using three case studies to illustrate the power of the technique.
1. INTRODUCTION The high cost of software development, in combination with advances in software engineering, has caused the emergence of a software development methodology based on evolution. In this methodology, new programs are built from existing ones, utilising sections of code from old programs to perform functions in the new application. The methodology is most commonly applied when the functionality of a program is expanded incrementally, or when code is ported from one system to another. In the latter case, the old code is moved to a new platform with as little modification as possible. However, this simple minded approach often fails. For example, it may be necessary to modify sections of code which are system dependent, and in some circumstances it may even be necessary to rewrite the entire program in another programming language. Further, subtle differences in the semantics of programming languages and operating systems mean that the code may behave differently on two systems. Because of these practical considerations, it is desirable that software tools are available to simplify the process as much as possible. Traditional debuggers such as dbx [5, 11, 23] and gdb [21], and others [14, 15, 16, 17, 7] do not emphasise the debugging and testing of applications which change during their development cycle. Debuggers of this type allow the user to manipulate the new program through process control commands, and to examine and modify the state of the program. In debugging the program, the user must determine possible modes of failure, and then stop the execution at key points to examine the state. In determining whether the state is correct or not, the user must be able to predict the state values. The prediction is usually based on a detailed knowledge of the operation of the code. This can be extremely difficult for complex code, especially if the person performing the debugging is not the author of the original program. Most importantly, existing debuggers do not try and make use of any other versions of the program in helping the user form sensible predictions for state values. In this paper we discuss a new debugging tool which can be used to test programs which change over time Our tool incorporates conventional debugger commands as well as a new set of commands which facilitate comparison of the new program with an existing version. The paper begins with a discussion of the current techniques used to test evolutionary programs. It then describes GUARD1 (Griffith University Relative Debugger), a new debugger developed at Griffith University, followed by some implementation considerations. Finally, we provide an evaluation of the technique using a number of case studies which highlight different aspects of GUARD.
1 Patent Pending
2
2.
HOW DO WE TEST AND DEBUG EVOLVING PROGRAMS?
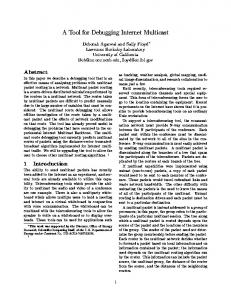
Figure 1 shows a number of classifications for changes that a program may encounter during its lifetime. It often begins as a small program for testing some basic functionality and design. It may be augmented and incrementally expanded into a large software system, and some of the core algorithms may even be altered. These types of modifications can be attributed to changes in the functionality or operation of the code. In Figure 1 changes which alter the core algorithms or augment the program with new ideas are classified as functional changes. The program may be converted for execution on different hardware and software platforms, and may even be re-written in another language to allow it to take advantage of new hardware. These types of modification can be classified as migratory ones. In Figure 1 changes attributed to rewriting the program in another language or porting it to another computer system are classified as migratory. Regardless of the cause of the changes, at each of these stages the programmer must determine whether the program is still operating correctly, and if not, must determine which of the alterations caused the new behaviour. Functional Changes
Migration
Original program
Program rewritten in another language for new hardware
Program ported to another computer system
Augmented Program with new ideas
Core algorithms altered
Figure 1 - Classification of Program Changes Currently, there are very few tools which assist porting and debugging of evolving programs across different hardware and software platforms. Traditional debuggers have a number of severe limitations which significantly reduce their applicability. The most serious limitation is that they are incapable of dealing with several programs running at the same time and possibly on different computers. They have no facilities for comparing the output and internal state of different programs, which must be done by tedious and error prone manual methods. The most common technique for testing and debugging evolved programs is to use the data flow of the code to locate the point at which the data structures in the new program diverge from those in the existing one. Thus, the existing code acts as a reference version by defining a set of expectations. In this way, the user typically works back to determine the last point at which the data was correct by comparing data structures with the reference version. The process is applied iteratively until the faulty
3
region is refined to a small segment of the program. Once this point has been established, most errors can be traced quickly to a small section of faulty code, and the error can be corrected. This technique is illustrated in Figure 2, which shows that relatively few stages can be used to refine the faulty region to a manageable size. Debugging real programs using this technique with currently available tools can be tedious and error prone. Typically, output statements are placed in both the reference and the debugged code, and the values are either compared by visual inspection, or by a file comparison program [9]. If the two programs execute on different computer systems then the data must be transferred before it can be compared. These shortcomings have motivated the development of a new debugging tool, which is described in the next section. CORRECT
CORRECT CORRECT Program
INCORRECT
Program
INCORRECT
Program
FAULT
Program
INCORRECT
STEP 1
STEP 2
STEP 3
STEP 4
Figure 2 - Refining the erroneous region
3.
GUARD: A RELATIVE DEBUGGER
3.1 What is GUARD? GUARD is a distributed debugger which operates in an open heterogenous computing environment [3, 18]. GUARD provides the user with functionality to control more than one program and to make assertions about the correctness of a new program with reference to an existing one. Consequently, GUARD supports the evolution of programs because it acknowledges the existence of working versions of the code. Figure 3 shows the way that GUARD interacts with both the reference code and the code being debugged. Because GUARD works in a distributed environment, it is possible to execute the reference code, the program being debugged and GUARD itself on three different computer systems, as shown in Figure 3.
4
GUARD communicates with the programs it is controlling via a network and makes use of a special debugger support library (called Dynascope [20]) which interacts with the applications. GUARD relies on the premise that differences between the contents of the data structures in the reference code and the one being debugged can be used to detect faults. This assumes that the two programs utilise comparable data structures, or at least provide a set of conversion routines which make them appear equivalent. GUARD makes no assumptions about control flow in the two programs, which may be different. It requires the user to determine key points in the two programs at which various data structures should be equivalent. The overall debugging process is as follows. The user determines that the new code is erroneous by observing that key data structures are incorrect after execution. GUARD is then used to test equivalence of these data structures between the reference and debugged programs at various points in the code. By tracing the data structures back to their sources using the dataflow of the program, it is possible to find the latest point at which the two codes are equivalent and the earliest point at which they diverge. The error then lies between these two points. This overall technique is used routinely in many disciplines, such as debugging electronic circuits. In electronics, test equipment is used to compare observed signals with those recorded on working equipment. When applied to debugging computer programs, the process is normally performed manually using very little computer support and it is usually quite laborious. The main power of GUARD is that it provides the facilities to make the process very simple and efficient. It is effective because the user can use a divide-and-conquer technique on very large systems and reduce the suspect section of code to a manageable size. GUARD complements conventional debuggers, rather than replacing them. By allowing the user to determine quickly whether two programs compute the same values it is possible to find out where the two codes diverge. Once the point of divergence has been located, conventional debugging techniques can be used to isolate the faulty code. For this reason, the core G U A R D functionality may be embedded in a conventional debugger. The availability of other supporting tools can dramatically improve the effectiveness of this overall technique. For example, if the data flow of the code is available during the debug and test phase, then this can be used to assist the user in determining where to test the new code against the reference. Consequently, GUARD could be embedded in a CASE environment which gives concurrent access to the source, various call tree graphs and dataflow representations of the program.
5
Machine 1
Machine 2
Machine 3
Program being debugged
Reference Program
Guard Debugger Support Library
Debugger Support Library
Computer Network
Figure 3 - GUARD - A relative debugger 3.2 Network independent debugging GUARD makes use of open distributed processing techniques to allow the reference code and the debugged code to execute concurrently on different computer systems. This means that when a program is being ported to another system, the reference code operates in an environment which is known to produce the correct results. Consequently, the user is able to concentrate on the causes of deviation of the code to be debugged. Network independence and support for heterogenous computing platforms make heavy demands on the underlying technology, and some of these issues will be discussed in Section 4. Network location information is restricted to the GUARD command invoke, which starts executing a process. In this command a logical name is bound to the process for use in future commands. After the invoke command has been issued, all other GUARD commands use the logical name when referring to the process. GUARD hides the details of the underlying architecture from the user, and thus it is possible to compare data structure contents across widely different machines. For example, one machine may represent integers using 64 bit big endian addressed words, and the other may use 32 bit little endian addressed words. GUARD automatically translates the external data into a generic internal form before it performs the comparison. We have tested GUARD across a wide range of Unix platforms using the Internet as the underlying network. This feature of GUARD will be illustrated by one of the case studies reported in this paper. 3.3 Using GUARD
6
GUARD relies on the user to make a number of assertions which compare data structures in the code to be debugged and the reference version. These assertions make it possible to detect faulty code because they indicate where (and when) the data structures deviate from those in the reference code. The choice of data structures and test points must be determined by the user based on some knowledge of the application. It is not necessary to test all data structures, but only those which will help uncover the source of the error. Likewise, it is not necessary to test the structures after each executable statement. A search which refines the faulty region, such as a binary search, can be very effective. GUARD can be used in two modes: one in which the assertions are specified declaratively, and the other using procedural techniques. Both techniques do not require any recompilation of the code and make use of debugger breakpoints to interrupt the code being tested. The procedural scheme relies on the user manually placing breakpoints in both the reference code and the debugged code. These are planted by the user at key test points. Both programs are then executed until they reach these breakpoints, after which the user tests the equality of arbitrary data structures using a compare statement. The following example shows the syntax of the compare statement by comparing the values of variable test in the reference code and the debug code. In this example, reference and debug are names which are bound to the two processes under examination by the invoke command. compare reference::test = debug::test If the two data structures are not equivalent, then the nature of the error is reported. If the variables are simple types like integer or real, then it is possible to report the two values. If they are compound structures like arrays, then the location of the difference in the two structures must be reported as well. Later in the paper we will describe the method for reporting differences in array structures. After the comparison, the user can resume execution of the two programs using a continue statement. It is possible to compare a number of data structures after the breakpoints have been reached. New breakpoints can also be set to further refine the erroneous code at any stage of the debugging process. This process closely resembles the way a conventional debugger is used. However, it allows the user to control two processes concurrently and compare their data structures. This manual scheme can become unwieldy on large programs because there are two processes to control. Further, it is not wellsuited to using the debugger to automatically test whether a new version of program matches a previous one, because it requires a great deal of user interaction. Consequently, we have developed an automatic mode of operation called declarative assertions. Declarative assertions allow the user to bind a set of breakpoints to comparison operations at any time prior to, or during, execution of the code. In this way, the comparisons are invoked automatically each time the breakpoints are reached. If the compare statements do not detect an error, then the code is
7
automatically resumed without any user interaction. Declarative assertions provide a convenient mechanism for stating a set of conditions for correct execution, and thus are well suited for automatically testing a new program against previous versions. If the assertions do not cause any errors, then the code is assumed to conform to previous versions. Declarative assertions are also effective when an error is detected only after a number of iterations of a particular statement. Because the user is not involved until an error is detected, little user interaction is required to actually detect the erroneous lines. The following syntax is used to declare an assertion: assert
reference::variable1@line1 = debug::variable2@line2
where reference and debug are bound to the two processes as discussed previously, variable1 and variable2 are arbitrary variables in the programs, and line1 and line2 are source code line numbers. In section 5 we will illustrate the use of declarative assertions for detecting errors in a large scientific modelling program. 3.4 Data Types Like conventional debuggers, GUARD needs to understand the types of variables in the programs it controls. On many systems (e.g. Unix) the type information is embedded in special symbol table information stored in the executable image. This can be automatically extracted by the debugger at the beginning of a debug session. In a conventional debugger, this information allows it to display variables in a way which is meaningful to the programmer. In GUARD, the information is also required so that it knows how to compare variables. For example, variables must be type compatible before they can be compared. Further, GUARD needs to understand the structure of the variables during the comparison operation so that it can traverse the basic elements. Other complications arise because the reference code may execute on a system with different attributes from the code being tested. For example, byte ordering may differ and the two programs may even be written in different languages. Consequently, GUARD must map types from one system onto another. GUARD currently handles variables of base types integer, real, character and multi dimensional arrays of these base types. The base types are compared for equality. Arrays are compared by traversing their elements in order. Differences are reported together with their position information. This allows GUARD to compare arrays in programming languages which use different ordering, such as Fortran and C. GUARD allows also comparisons of sub-arrays. These base types have been sufficient to demonstrate the effectiveness of GUARD in debugging a number of large scientific programs. In future versions of GUARD we will add support for data types such as records and dynamic structures like linked lists. Records can be handled by walking through
8
the elements of the record recursively until a base type is found. Linked lists require more sophisticated procedures for mapping the data structures into an intermediate form prior to comparison and for interpretation of this intermediate form. It would also be possible to compare user defined types in an object oriented environment by allowing GUARD to call the object access methods of the appropriate class. 3.5 Tolerances A program may not be in error simply because its variables do not exactly match those of a reference version. The most obvious example is when the two systems use different floating point representations or libraries. In this case numbers may be deemed to be equivalent if they are within a predefined tolerance of each other. Accordingly, GUARD includes a user controlled tolerance value, below which numbers are considered equivalent. Further, individual assertions may specify their own tolerance value rather than using the global one. We have experimented with two different types of tolerance, one absolute and the other relative. When absolute tolerances are used, the magnitude of the difference between the reference and the test variables is compared to the tolerance value. When relative tolerances are used, the difference is divided by the larger of the two variables. The latter is required when the numbers are quite small, because even a small absolute difference may constitute a large variation. User interaction is required in order to determine which type of tolerance to use. 3.6 Displaying the results If two scalar variables differ then it is possible to display the two values and report the difference. However, when complex data structures differ, it is difficult to interpret the nature of the difference by viewing the numeric values alone, particularly if they are floating point numbers. Consequently, we have developed a simple visualisation system for GUARD which uses a pixel map to show array differences. GUARD also reports the maximum and average differences between arrays as numeric values. The most intuitive display is formed when two dimensional arrays are visualised. In this case, a two dimensional pixel map is created in which each pixel corresponds to one array element. Errors which are caused by incorrect loop bounds and strides are displayed as regular patterns, making them easy to detect. GUARD currently maps all other shaped arrays onto two dimensional ones by either expanding the one dimensional arrays or merging higher dimensions.
9
Figures 4a and 4b show some sample visualisations which were produced by GUARD when it was used for testing a new version of the Shallow Water Equations [2]. The original code was written in FORTRAN and the new version was written in C and ran on a different computer system. Figure 4a shows the effect of floating point differences between the two dimensional data structures used to hold the pressure of the wave. In both visualisations, a black pixel means that the data is different at the specified row and column of the arrays. From Figure 4a it can be seen that the two data structures are similar but not exactly the same because many of the values are incorrect, but the maximum difference is quite small (4.3 x 10-06). Moreover, the maximum difference increases in time as the two programs diverge further. Figure 4b shows the effect of a wrong loop bound in the new code. The section of the array which has not been calculated can be clearly seen as a band of black pixels covering the missing columns on the right.
10
Figure 4a - Numeric instability causing errors
11
Figure 4b - Incorrect loop bound In Figure 5a we illustrate a more powerful visualisation of differences. In this case, we show a three dimensional error iso-surface of a particular data structure. The example comes from the comparison of two different weather models, and the displays show an error iso-surface where the error exceeds 0.1% between the temperature variable in the two models [1]. Such images convey powerful debugging information to the programmer. For example, by rotating this image in three dimensions it is possible to note that some of the differences are present in the upper layers of the atmosphere, and some are present in the lower levels. This helps to isolate the sections of code which could be causing the divergence, because different pieces of code are responsible for some of the processes which occur in the upper and lower levels of the atmosphere. Also, since there is significant structure to the error surface, it is unlikely to be caused by simple floating point divergence through rounding differences. In this example, there were multiple separable differences, and these are superimposed on the one image. The image in Figure 5b shows the result of removing one source of errors, as identified using GUARD. It is notable that some errors are still present in the second image. These images were produced using a
12
commercial visualisation package (IBM's Data Explorer). The data is extracted by providing a file name to the assert command, and the data is dumped to the file each time the assertion exceeds the tolerance. A subsequent program processes the data file and imports the data into the visualisation system.
Figure 5a - Visualisation of differences 3.7
Figure 5b - removal of one source of error
Partial Assertions
Assertions contain the names of data structures to compare and the line numbers in the sources where they should be equivalent. In order to create assertions the user must consult the code to determine the correct line numbers. This approach can be error prone when the source changes frequently, because the line numbers also change. Accordingly, we have implemented an additional way of specifying assertions which does not require the user to enter line numbers. In this case, the user writes a partial assertion for each of the programs, naming the data structure and an assertion name, and then embeds these in the source files as comments. Partial assertions are extracted from the programs automatically, using a filter program which constructs a file containing assertion names with their corresponding data structure names and line numbers. GUARD has a special command called build, which takes two files with partial assertions and builds a set of complete assertions. If the assertion name appears in both lists then it is matched to form a complete assertion, containing two sets of data structures and associated line numbers. The user is also free to add any additional assertions using the assert command. Figure 6 shows how a partial assertion list can be generated. The assertions appear as comments in the code, and thus the program does not need to be recompiled in order to run the program without using the debugger. The partial assertion list contains the name of each assertion and its corresponding variable and line number information. The partial lists are then merged by GUARD into a set of complete assertions.
13
do 100 j= 1,n do 100 i= 1,m cu(i+1,j) = 0.5*(p(i+ 1,j)+ p(i,j))*u(i+ 1,j) cv(i,j+1) = 0.5*(p(i,j+1)+ p(i,j))*v(i,j+1) z(i+1,j+1) = (fsdx *(v(i+1,j+1)-v (i,j+1)) -fsdy*( u(i+1,j+1) 1 -u(i+1,j)) )/(p (i,j)+p( i+1,j)+ p(i+1,j+1)+ p(i,j+ 1)) h(i,j) = p(i,j)+ 0.25*(u(i+1,j)*u(i+1,j)+u( i,j)*u(i,j) 1 +v( i,j+1)*v (i,j+1)+ v(i,j)*v( i,j)) ketot = ketot + p(i,j)* 0.25*(u(i+1,j)*u(i+1,j)+u(i,j)*u(i,j) 1 +v( i,j+1)*v (i,j+1)+ v(i,j)*v( i,j)) c$as sert ch eck _ptot ptot ptot = ptot+( p(i,j)-pmean)**2 etot = etot+ h(i,j) enstot = ens tot + z(i+1,j+1)**2 * 0.25* 1 (p(i,j)+p( i+1,j)+ p(i+1,j+1)+ p(i,j+1)) 100 continue c$as sert ch eck _cu cu c$as sert ch eck _cv cv :
Pre-processor
ch eck _pto t
[email protected]:11 ch eck _cu
[email protected]:17 ch eck _cv cv@fs hallow.f18
Partial assertions
Source for Reference Code
Figure 6 - generation of assertions from source code 3.8
Trace files
The discussion to date has assumed that the user wishes to execute both the reference code and the program being tested each time the assertions are to be evaluated. However, this is not always convenient. First, the reference program may be executed on a much slower system than the new version, thus evaluating the assertions may take a long time. For example, the new program may be run on a supercomputer. Second, it may not be possible to run the reference code on the original hardware platform, because it may no longer be available. These problems can be solved by storing sufficient information when assertions are first evaluated, so they can be re-executed without running both the application programs. Instead, it is only necessary to re-run the program under test. This technique effectively caches the contents of the data structures for later re-use. GUARD implements this caching mechanism through a process called ghost execution. Ghost execution is performed in two phases. First, the reference code is executed without the new code together with all the necessary assertions. In this phase, the contents of variables being traced are dumped to a file. During the second phase, this file is used as the source of variable values rather that a real reference program being executed. After the user requests ghost execution the debugging can proceed as though the reference code were actually being executed. Providing the user does not specify any assertions which contain variables that have not been cached, the reference code does not been to be re-executed. 3.9
Data Extraction and Permutation
The discussion to date has assumed that the data structures being compared in the reference and debugged code are identical. Often when code is ported from one system to another there are subtle
14
changes in the data which make this assumption unrealistic. In the case of arrays, it is often necessary to alter the dimensions in the new code to implement additional functionality, or to alter the order of the indexes. Accordingly, GUARD implements array extraction operators and index permutation functions which make it possible to map one array structure to another. Array extraction is performed using rectangular sub arrays. For example, the description A[5..19][5..19] describes a 15 x 15 sub-array of A starting at row 5 and column 5. This sub-array can be compared with another sub-array providing the sizes are conformant. For example, the following assertion is possible: Assert p1::A[5..19][5..19]@C.c:11 = P2::B[4..18][6..20]@F.f:15 Further, changes in index order mean that the new array may be equivalent except that it has a different shape. This permutation is often performed to optimise a program for a new architecture in which the use of vector hardware or cache memory dictates that certain indexes be scanned as inner loops. Accordingly, GUARD implements an arbitrary permute function on every assertion, which makes it possible to map index values from one array to another. The following example compares array A with array B using a permutation function which maps index 0 of array A onto index 1 of array B, and index 1 of array A onto index 0 of array B. Assert p1::
[email protected]:11 = P2::
[email protected]:15/permute (0:1,1:0) Both of these types of assertion were used in comparing the two weather models discussed the third case study in section 5.3. The new model contained extra rows and columns to allow for interprocessor communication in a parallel form of the program, however, the core data was the same. Also, its row and column ordering was optimised to improve the cache performance.
3.10
Forcing equivalence
Each time an assertion detects a difference in the data between the two programs it reports the divergence to the user and restarts the processes. An option to the assert command instructs GUARD to also copy the data from the reference code data structure into the one in the program being tested, thereby forcing them to contain the same information. This feature has enormous benefits when the user is trying to determine whether the error which has been detected is responsible for some other divergence later in the execution. In one of the case studies in this paper we illustrate the power of the force option when small errors accumulate into larger significant ones after the program has run for some time.
15
4.
IMPLEMENTATION ISSUES
The functionality discussed in the previous sections raises many implementation issues. In this section we briefly touch on some of these, but a more complete discussion is found in [18, 4]. 4.1
Debugger structure
GUARD is built as a user client which attaches itself to a number of debugger servers. The user client contains all of the user interface code together with the code to manage multiple processes and handle assertions. The client/server structure makes it possible to run the user interface and control logic on one processor and the reference and debugged code on different systems. GUARD is isolated from the implementation details of debug servers by a novel debug library called Dynascope [20]. Dynascope provides functionality which makes it possible to control programs through breakpoints, and to allow extraction of data from variables. A generic interface is provided regardless of the target platform, thus GUARD is portable to the platforms which are supported by Dynascope. Dynascope is currently available on SUN Sparcstations, Next, DEC Alpha, SGI Indy, and IBM RS6000 machines. 4.2
Assertions, Event firing and Control
Assertions make use of the breakpoint capability which is inherent in most debuggers. However, the logic is more complex than for simple breakpoint handling. When assertions are processed by GUARD, the information relating to the data structure and breakpoint information is stored in an assertion structure. This includes an exact description of the process identifiers, data structures to be compared and the breakpoint addresses. Subsequently, breakpoints are placed in the two programs at the appropriate places. Then the programs are executed and GUARD waits for breakpoints to be reported. Each time a breakpoint is encountered, the appropriate data structure is extracted from the program and stored in temporary debugger variables, and the program restarted. When both data structures in an assertion are available, the comparison can be performed. This simple event management technique allows the programs to encounter the breakpoints in any order. GUARD performs the comparison only when both breakpoints for an assertion are encountered. If a process encounters another breakpoint at the same address before the previously stored data has been compared, then the data is held in a first-in-first-out queue. This preserves the temporal ordering of the data. Allowing each program to continue execution immediately means that the programs can follow different control structures, at the cost of more complex resource management within the debugger. Data must be retrieved from the user program and saved until it is required, and sufficient space must
16
be available for multiple data structures. At present, we impose a limit on the number of outstanding items for every assertion. If the limit is exceeded the application program is blocked until the assertions are evaluated. Providing the other process encounters a breakpoint in the meantime, the assertion will execute and the two processes can be restarted. However, it is possible to dead-lock a process by limiting the number of items too severely given a particular set of assertions. In our experience, this has not proved to be a limitation2 . 4.3
Issues in Heterogenous Distributed Computing.
Heterogeneous computing platforms pose some interesting challenges for a relative debugger, which must possess the following characteristics: • The debugger must support the execution of more than one program concurrently; • The debugger must inter-operate with different platforms; • The debugger must perform all the necessary data type conversions between platforms and language environments in order to perform meaningful comparisons. As discussed previously, GUARD uses a debug server, called Dynascope [19, 20], which hides most of the issues related to the exact process for starting and running programs on distributed platforms. The invoke command contains sufficient information to inform Dynascope of the process location, after which there is no need to re-issue this information. Dynascope uses remote execution commands to start remote debug servers, and data is transported using Unix sockets [22]. Dynascope also contains mechanisms to manage heterogenous representations of the same data, including differences in byte ordering, character sets, data sizes and floating point representations. Data from remote systems is mapped into a generic representation before it is returned to the debugger. In this way it is possible to compare data between widely different architectures, and this information can be hidden from the debugger itself. More details of Dynascope can be found in [19].
5.
EVALUATION
In this section we evaluate GUARD by considering three case studies, involving real world applications of the technology. Each case highlights a different aspect of relative debugging. In the first case study, GUARD is used to track a difference in a scientific modelling code which occurred as
2 The current limit is set so that the process always blocks after its breakpoint has been encountered. This appears to be
satisfactory for many cases.
17
a result of software maintenance. In this case the error is traced to one erroneous source statement in the new version of the code. In the second case study GUARD is used to determine why the same source program behaves differently on two different computer systems. In this example the error is isolated to different behaviour of a mathematical library function. In the final case study, GUARD is used to compare the execution of two different models which should compute the same results. In this case one of the models is a version which has been modified for parallel execution, and is substantially different from the sequential version. In this case, GUARD helps isolate two independent differences in the two models. 5.1 Case Study 1 - Finding a Source Error In this section we describe an application of GUARD for finding a subtle error in a scientific code. The program, a photo chemical pollution code, models the chemical processes which occur during smog formation [12]. It has been used as part of a number of real world studies involved with formulating pollution control strategies. This software has characteristics which are typical of many other scientific modelling programs. It is written in Fortran and spans 15,000 lines of code over 15 source modules. One of the key data structures in the program is an array, named C, which holds the concentrations of all chemical species for each of the cells in three dimensional space. The array is conceptually indexed by two co-ordinate indices (column number in 2D space and vertical level) and a chemical species number. Whilst this would normally require a three dimensional array, it is actually represented as a one dimensional array. This assists with the vectorisation of the program, and also with dynamic memory allocation. However, it also makes the code harder to understand and debug. In this study we show how GUARD was used to track an error in the numeric integration code. The problem was detected after the program failed to generate correct results for a particular simulation. A reference version of the code was established and used for the comparison of key data structures. Whilst both versions were run on the same computer, it would have been possible to execute them on different networked systems. Figure 7 shows the basic computational structure of the program at the outer level. After initialising the key data structures the program enters a loop in which the concentrations of each of the chemical species are calculated at discrete time steps. The program works on sections of the concentration vector (C) corresponding to each column of the 3 dimensional space. Once the new concentrations have been computed horizontal transport is performed in 2 directions. The program uses a set of hourly wind vector values a number of times before reading in a new set of vectors. These operations are mostly performed in the source file airshed.F.
18
Structure
Airshed.F PROGRAM AIRSHED
Initialise Data Structures
Line 1849 DO 570 ICOLM = 1, ... Loop for all columns of 3D space Perform chemistry with hourly values for wind vectors Perform simulation for required number of hours
Solve Chemistry and vertical mixing for one column of 3D space
Perform transport in x direction
Assertion (1) CORRECT
Line 1906
CALL COLLOOP(, , C, ,
570 CONTINUE Line 1931
Assertion (2) INCORRECT
Perform transport in y direction
Read new set of hourly wind vectors
Assertion (3) INCORRECT Line 2071 END
Figure 7 - Overall structure of code plus source in Airshed.F The assertions shown in Figure 8 were used to determine the point at which the concentration vector (C) became corrupt. As discussed earlier, the assertions were placed at strategic places in the code to try and locate where the C vector became corrupt. These assertions detect that the vector C was incorrect at lines 2071 and 1931 but still correct at line 1906. Consequently, the error must be contained in the routine COLLOOP.
assert old::
[email protected]:1906 = assert old::
[email protected]:1931 = assert old::
[email protected]:2071 =
new::
[email protected]:1906 new::
[email protected]:1931 new::
[email protected]:2071
Assertion(1) Assertion(2) Assertion(3)
Figure 8 - Assertions relating to Airshed.F Figure 9 shows the structure and source of the routine COLLOOP. The appropriate cells from C are copied to a temporary concentration vector called CNT. The new concentrations for the species are calculated by solving the ordinary differential equations which govern the rates of production of each chemical species. Then the concentrations are adjusted to take account of vertical mixing in the
19
column. These two operations are mostly performed in colloop.F. The assertions shown in Figure 10 were used to conclude that the values in CNT were correct at line 305 and incorrect at line 321. Consequently, the error must be contained in the routine INTEGR2. Colloop.F
Structure
SUBROUTINE COLLOOP( .... ) Copy part of C to CNT Solve differential equations for column in CNT
Line 255
Copy part of C to CNT
Assertion (1) CORRECT Line 305
CALL INTEGR2(, CNT, , ,)
Perform vertical transport within column CNT
Assertion (2) INCORRECT Copy CNT to part of C
Line 321 Copy CNT back to C Line 412 RETURN
Figure 9 - Structure and code of COLLOOP in Colloop.F assert old::
[email protected]:305 = assert old::
[email protected]:321 =
new::
[email protected]:305 new::
[email protected]:321
Assertion(1) Assertion(2)
Figure 10 - Assertions relating to Colloop.F Figure 11 shows the structure and code of the routine INTEGR2, which performs a numeric integration. This makes use of a number of working vectors (such as C3). Figure 12 shows the assertions related to INTEGR2. These assertions determine that C3 was incorrect at 711 and 595, but the switch variable IS was correct at line 587. From the information gathered by these assertions the error was found at line 587 of numerics.F as shown in Figure 13. Structure
Numerics.F SUBROUTINE INTEGR2( ... ) Line 587 IF(IS(I) .GT.0) GO TO 70
Compte new concentrations using working vector C3 Copy new concentrations back to CNT
Line 591 Line 595
Compute C3 based on CNT 70 CONTINUE
Line 711
RETURN
Assertion (1) CORRECT
Assertion (2) INCORRECT
Assertion (3) INCORRECT
Figure 11 - Structure and code of INTEGR2 in Numerics.F
20
assert assert assert
old::
[email protected]:587 = old::
[email protected]:595 = old::
[email protected]:711 =
new::
[email protected]:587 new::
[email protected]:595 new::
[email protected]:711
Assertion(1) Assertion(2) Assertion(3)
Figure 12- Assertions relating to Numerics.F
IF (IS(I).GT.0) GO TO 70
IF (IS(I).LT.0) GO TO 70
Correct
Incorrect
Figure 13 - Correct and incorrect source in numerics.F This error caused only some of the array elements to be incorrect, and would have been extremely difficult to trace using a conventional debugger. The difference visualisations allowed the error to be detected very quickly using a simple search in combination with the data flow in the code. One of the main attractions of GUARD was that it was not necessary to alter the code during the debugging phase, and thus new assertions could be developed and refined without the need to recompile the code. 5.2 Case Study 2 - Finding Errors across Platforms In this case study GUARD was used to locate the source of a divergence in the pollution code described in the previous section, which occurred after it had been ported from a DEC Alpha workstation to a SUN Sparc Station 5. These two platforms (and their associated operating systems and compilers) differ in a number of important respects. They use different architectures and byte ordering, different default floating point options and different sizes of integers and addresses. Since the source code for the pollution model was identical on the two machines, the divergence could have been due to a variation in any of the hardware, operating system, compilers or run time libraries. Location of this type of problem is a daunting task. The exact nature of the error can be seen in the error surface plotted in Figure 14. This shows where the contents of the concentration array exceeds a 10% relative error tolerance value in the three dimensions of the model. The error appears to be distributed vertically through the atmosphere, which would suggest that the vertical advection code in the model actually transports the error vertically throughout the atmosphere. Also, the error is not present in half of the data structure (the front region as displayed in Figure 14), which happens to correspond to a region of space which is above water rather than land. This would suggest that the error is only propagated by some of the physics code relating to pollution transport above land. Finally, the random nature of the error surface suggests that the fault was not caused by a simple array indexing error. More importantly, by viewing the progress
21
of the error surface after each time step of the program, the error can be seen to grow after each iteration of the algorithm. This suggests that the original source of error may be actually be very small, and that it is then magnified by the subsequent computations.
Figure 14 - Error Surface in Pollution Model after 60 time steps The same technique of divide-and-conquer was used as on the last study. The program was divided a number of times and the key data structures were examined. By using the dataflow of the code it was possible to track a divergence down to a call to the library function EXP. GUARD showed that EXP was returning a result which differed only in the bottom but of the mantissa for some values of operand. However, the error observed after a complete simulation was in the order of 40%. Accordingly, it was not clear that this final error was a result of the small discrepancy detected by GUARD. In order to prove the connection, we used the force option discussed in section 3.10. This option makes it possible to instruct GUARD to force the two programs to use the same concentration array contents whenever a divergence is detected, by copying the data from one program to the other. After performing this operation, the programs produced identical output down to the last binary digit after a complete simulation. Thus, we were able to conclude that the error observed after a complete simulation was caused by an accumulation of very small errors, which happened to be introduced by a different algorithm for EXP. GUARD was able to highlight a much more serious problem with the code, that it was exhibiting chaotic behaviour in the light of very small errors. This experiment highlights the power of being able to detect differences, and then to force the two programs to use the same data, and continue execution. Without this feature it would have been necessary to write an EXP function which behaved the same on the two systems, and debugging would have taken much longer. GUARD was particularly valuable in this context because it was possible to execute the two programs on the hardware on which the error could be exhibited, and the underlying differences in the platforms could be ignored by the user.
22
5.3 Case Study 3 - Finding Multiple Errors In the previous two case studies the program being debugged was almost identical to the reference version. In this case study we used GUARD to track a divergence in a large weather model, which was rewritten so that it could be run on a parallel supercomputer. Unlike the previous two examples, this model, MPMM [8, 13], required substantial changes in order to take advantage of the underlying hardware. The original version, MM5 [6, 10], was written for sequential vector supercomputers. MPMM had changes in some of the underlying mathematical methods which were better suited to parallel execution. Also, some of the inner-loops in MM5 were promoted to outer loops in MPMM, which appears as a significant change to the source. Further, the order of the indexes in the arrays of MPMM were reversed to improve the performance of the program. In spite of the differences, MM5 and MPMM are supposed to compute the same output. However, one of the output variables of MPMM, the air temperature, was seen to drift from the reference code over some number of time steps. Figure 15 shows an iso-surface of error above 0.1% between the temperature reported by the two models after 45 times steps. Figure 15 yields a great deal of information about the source of the underlying error. One region of error can be seen (marked in the oval region) in the bottom of the three dimensional space, which corresponds to the lower levels of the atmosphere. Similarly, another marked region can be seen in the upper levels of the atmosphere. Because of the underlying numerical scheme used to compute these quantities, it is impossible for both errors to be caused by the same fault, and thus they must be generated by two independent causes. After some further investigation it was discovered that the top error surface was due to differences in the radiation code of the two models, and the bottom region related to differences in the planetary boundary layer physics. Armed with the approximate location of the errors, it was possible to construct a number of assertions which refined the region of error as in the previous studies. This investigation showed that the two models were inconsistent in two separate pieces of code. In one case, a source modification that was applied to MM5 has not be applied to MPMM. In the other case, MPMM was computing one of the quantities using a different numeric scheme, one which was better suited for parallel execution. Whilst the scheme used in MPMM was numerically correct it still generated slightly different results to the one used in MM5.
23
Figure 15 - Multiple errors in Global Circulation Model This case study highlights a number of interesting aspects of GUARD. First, visualising the error surface can yield very important information about the nature of the underlying error and its locations. Second, when multiple independent errors are present, the visualisation is necessary to determine whether the assertions have passed or failed, rather than a simple error metric. Third, the two programs can have quite different internal structure, and it is still possible to compare key data structures. The case study is discussed in more detail in [1].
6.
CONCLUSIONS
In this paper we have described a new tool which supports the debugging and testing of programs developed with evolutionary software engineering techniques. The tool makes use of previous versions of a program because it allows comparison of data structures between new and old versions. Since it operates in a distributed heterogenous computing environment it is ideal for use in program porting because the original implementation can act as a reference site. Through a number of case studies, we have illustrated the power of the system. GUARD is also useful for automatically testing new versions of programs against existing ones. The declarative assertion makes it possible to specify a number of assertions about key data structures before any changes are made to the code, and the program can be executed under the control of the debugger to verify that these assertions are met. More details about the implementation ofGUARD can be found elsewhere [18, 4].
24
GUARD has been ported successfully to a range of sequential platforms, namely SUN, Next, DEC Alpha, IBM RS6000 and Silicon Graphics machines. This is a substantial achievement because each of these machines use different computer architectures and support debugger software in different ways. Further, because GUARD can compare data between systems it is necessary to convert exact data formats between systems automatically. In one of our case studes we illustrated the utility of this mode of opertion for finding subtle differences in system software. Current research involves expanding GUARD to support the testing of parallel programs, supporting more data types and increasing the range of data structure visualisations which are possible. We are currently building a parallel version which can control the multiple processes of a parallel application. This has required us to redesign the logic used in the debugger for evaluating assertions, and this is discussed in another paper [4]. The current version of GUARD interfaces with external visualisation systems by writing the data to files, which must then be processed by a separate data extraction program before the data can be visualised. It should be possible to define a higher level interchange format for this file which makes the process of setting up new visualisations easier for the user, and this is worthy of further consideration. All of the functionality which has been described as part of GUARD could be intergrated into existing debugger software. The key requirement is that the debugger implements a client-server architecture so that it can control programs on more than one computer system. This approach would allow the technology inherent in GUARD to be used as part of a much wider CASE environment, providing software developers with a powerful debugging and testing system. The authors are currently actively pursuing this approach with a number of computing vendors.
Acknowledgments This work has been sponsored by the Australian Research Council. The authors wish to acknowledge the work of Lisa Bell, who has performed most of the programming necessary to implement GUARD. Thanks go to Simon Wail from IBM and Professor Geoff Dromey for proof reading a draft of this paper, and to Ian Foster and John Michalakes from Argonne National Laboratories for their work in applying GUARD to some real world scientific codes. Thanks also go to the CASE-95 program committee and the anonymous referees for their helpful comments.
References [1]
Abramson D., Foster, I., Michalakes, J. and Sosic R., "Relative Debugging and its Application to the Development of Large Numerical Models", IEEE Supercomputing 1995, San Diego, December 95.
25
[2]
Abramson, D.A., Dix, M., Whiting, P., "A Study of the Shallow Water Equations on Various Parallel Architectures", 14th Australian Computer Science Conference, pp 06-1 - 06-12, Sydney, 1991.
[3]
Abramson, D.A. and Sosic, R. "A Debugging Tool for Software Evolution", CASE-95, 7th International Workshop on Computer-Aided Software Engineering, Toronto, Ontario, Canada, July 1995, pp 206 - 214. Also appeared in proceedings of 2nd Working Conference on Reverse Engineering, Toronto, Ontario, Canada, July 1995.
[4]
Abramson, D.A., Sosic, R. and Watson, G."Implementation Techniques for a Parallel Relative Debugger ", School of Computing and Information Technology, Technical Report. "http:://www.cit.gu.edu.au/~davida/papers/pact.ps"
[5]
Adams E. and Muchnick, S. "Dbxtool: a window-based symbolic debugger for Sun Workstations", Software-Practice & Experience, 16, (7), pp 653-669 (1986).
[6]
Anthes, R., "1986 summary of workshop on the NCAR Community Climate/Forecast models", Bull. Amer. Meteor. Soc., 67, pp 194-198, 1986.
[7]
Cheng D. and Hood, R., "A Portable Debugger for Parallel and Distributed Programs", Proceedings of Supercomputing 94, Washington D.C, pp 723-732, Dec 94.
[8]
Foster, I. and Michalakes, J., "MPMM: A Massively Parallel Mesoscale Model", In Geered-R Hoffmann and Tuomo Kauranne, editors, Parallel Supercomputing in Atmospheric Science, pages 354-363. World Scientific, River Edge, NJ 07661, 1993.
[9]
Galbreath, N., Gropp, W., and Levine, D. "Applications-driven parallel I/O", Proceedings Supercomputing-93, Portland, Oregon, pages 462-471. IEEE, 1993.
[10]
Grell, G., Dudhia, J., and Stauffer, D. "A Description of the Fifth-Generation Penn State/NCAR Mesoscale Model (MM5)", Technical Report NCAR/TN-398+STR, National Center for Atmospheric Research, Boulder, Colorado, June 1994.
[11]
Linton, M., "The evolution of Dbx", Proceedings of the Summer 1990, USENIX Conference, June 1990, pp. 211-220.
[12]
McRae G.J., Russell A.G. and Harley R.A., 1992. "CIT photochemical airshed model - users manual", Carnegie Mellon University, Pittsburgh, PA and California Institute of Technology, Pasadena, CA.
26
[13]
Michalakes, J., Canfield, T., Nanjundiah, R., Hammond, S. and Grell, G. "Parallel Implementation, Validation, and Performance of MM5", In Parallel Supercomputing in Atmospheric Science. World Scientific, River Edge, NJ 07661, 1994.
[14]
Moher, T. "PROVIDE: A process visualization and debugging Transactions on Software Engineering, 14(6), pp 849-857, June 1988.
[15]
Olsson, R., Crawford, R. and Ho, W. "A dataflow approach to event-based debugging", Software-Practice and Experience, 21(2), pp 209-229, February, 1991.
[16]
Ramsey, N and Hanson, D. "A retargetable debugger"., Proceedings of SIGPLAN'92 Conference on Programming Language Design and Implementation, pages 22-31. ACM, 1992.
[17]
Satterthwaite, E. "Debugging tools for high level languages", Software-Practice and Experience, 2(3):197-217, July-September 1972.
[18]
Sosic, R. and Abramson, D. A. "GUARD: A Relative Debugger", Griffith University Technical Report, School of Computing and Information Technology, Report # CIT-94-21. "http:://www.cit.gu.edu.au/~davida/papers/GUARD.ps"
[19]
Sosic, R. "Design and Implementation of Dynascope, a Directing Platform for Compiled Programs". To appear in Computing Systems, 1995.
[20]
Sosic., R. A "Procedural Interface for Program Directing.", To appear in Software - Practice and Experience, 1995.
[21]
Stallman, R. "GDB Manual", Free Software Foundation, Cambridge, MA.
[22]
Stevens, W. R. "Unix Networking Programming.", Prentice-Hall, Englewood Cliffs, NJ, 1990.
[23]
Sun Microsystems, "Debugging Tools Manual", Sun Release 4.1, 1990.
27
environment", IEEE