Int. J. Procurement Management,, Vol. X, No. Y, xxxx
A decision support tool, implemented in a system dynamics model, to improve the effectiveness in the hospital emergency department Elpidio Romano*, Guido Guizzi and Daniela Chiocca Department of Chemical, Materials Engineering and Operations Management, University of Naples Federico II, Corso Umberto I, 40, 80138, Napoli, Italy E-mail:
[email protected] E-mail:
[email protected] E-mail:
[email protected] *Corresponding author Abstract: The emergency department of a hospital is, among all areas in which lean policies are focused, the one that has received the most attention. The emergency room, in fact, plays a vital role in providing primary care to patients and is also recognised for the contribution it gives to society. The important results in terms of cost savings and improving the flow due to the reduction of the waiting time of the patients, obtained from major international hospitals, were crucial to assess whether it was possible and useful to implement similar improvements in Italy, certainly not without to many problems in the provision of health services. This paper explores what can be improved for the department to be more efficient, using simulation techniques based on dynamic and continuous logics (system dynamics). Keywords: system dynamics simulation; lean techniques; lean healthcare; emergency efficiency; causal loop diagram. Reference to this paper should be made as follows: Romano, E., Guizzi, G. and Chiocca, D. (xxxx) ‘A decision support tool, implemented in a system dynamics model, to improve the effectiveness in the hospital emergency department’, Int. J. Procurement Management, Vol. X, No. Y, pp.xxx–xxx. Biographical notes: Elpidio Romano graduated in Transportation Engineering, and holds a PhD in Transportation Systems and Theory. At the moment, he is a Contract Researcher at the Department of Chemical, Materials Engineering and Operations Management of the University of Naples Federico II. He is a tutor at Uninettuno University. His research activities are mainly concerned about the following topics: simulation modelling, implementation of model construct in system dynamics environment, traffic and transportation simulation and analysis, maintenance strategies, supply chain management models, quick response manufacturing, sustainable production processes, location – routing and vehicle routing problem, lean service, and lean production implementation. He has authored several papers presented at international conferences and published in international journals of industrial engineering.
Copyright © 200x Inderscience Enterprises Ltd.
1
2
E. Romano et al. Guido Guizzi graduated in Engineering Management, and holds a PhD in Aerospace Engineering, Naval and Quality. At the moment, he is a Researcher at the Department of Chemical, Materials Engineering and Operations Management of the University of Naples Federico II. His research field are mainly concerned about the following topics: simulation modelling, logistics, scheduling problems, implementation of model construct in system dynamics environment, maintenance strategies, supply chain management models, quick response manufacturing, sustainable production processes, location – routing and vehicle routing problem, lean service, and lean production implementation, maintenance. He has authored several papers presented at international conferences and published in international journals of industrial engineering. Daniela Chiocca graduated in Management Engineering. She obtained her University Master title in Supply Chain Network confirmed by University Federico II. Currently, she is a PhD student at the Department of Chemical, Materials Engineering and Operations Management. She has gained experience in aircraft production field. She is an expert in control and certification management systems. Her research activity is mainly focused on applications of lean techniques in manufacturing production and services, such as healthcare processes. This paper is a revised and expanded version of a paper entitled ‘A decision support system to improve the effectiveness of a hospital department’ presented at the Summer School 2013, Senigallia, Italy, 11–13 September 2013.
1
Introduction
The traditional configuration of healthcare that is based on a hierarchical and functional approach is no longer able to respond appropriately to the organisational needs in recent years. This has meant that, from the organisational point of view, the need for more flexible solutions has emerged, in which coordination and managerial roles appear, and project teams able to develop collaboration across a horizontal dimension of organisation, or between those activities that arrange processes for the provision of specific performances or services. The instrument of process management allows you to get a complete picture of the company’s organisational problems, recovering in full view of the overall company performance. The individual activities become part of an integrated process of responding to the needs of the patient, which is to play the role of fulcrum of the delivery process of the health service. In process management, we can understand the activities that create added value for the patient and for the elimination of the non-value added just through the use of lean tools and techniques. In the description of medical processes, the first step involves the identification of activities that make up the overall health process of patient/user. Knowing what is actually done in a healthcare process, it can ask questions about how and why specific activities are provided. One can observe, how the activities are combined, how the organisation makes them available, integrating different participating units in the overall process, when and where. Specifically, the time factor has assumed an extraordinary importance in the business management and, in particular way, the lead-time, and the actual time of crossing process. Measuring times of different business process, lead time of different phases that constitute the overall healthcare process are obtained.
A decision support tool, implemented in a system dynamics model
3
The triage nurse takes charge of all incoming users and decides if they should be admitted into the visit room or sit in the waiting room, assigning them a colour code depending on the severity of the patient’s condition. The red colour patient (top priority) immediately receives all cares he needs in the emergency room area to which he is dedicated. After receiving performances of first aid, patient, if does not die, is admitted in a specific department for his health problem. The other colour codes, sharing the resources of the ER, wait in the waiting room for the availability of a bed, if necessary, or the availability of a doctor.
2
Lean techniques in healthcare
Lean techniques allow, if correctly implemented in the health sector, to create an organisational system based on common ownership and clarity of the role of each operator to increase the value and reduce waste (activities without value). It is a new way, then, to manage the process in a lean, characterised by a reduction of time, money, space, effort and defects, to the benefit of increased efficiency and quality of services offered (Deborah, 2010; Aronsson et al., 2011). A lean process is therefore a continuously meeting of all involved parties to create a channel in which to view the complete value stream. The analysis of the value stream, to be viewed together among stakeholders, led to identify three kinds of activities in each process analysed: value-added activities, activities that do not create value but are not visible, activities that do not create value and that can be eliminated immediately. The biggest waste in hospital organisations is the process not defined, therefore not standardised. Providing an adequate service with the wrong process is still a waste. The definition of value is therefore the first step towards lean thinking. Furthermore, we must always look for solutions that make visible a job easier, with less downtime and more convenience to both primary customers (patients) and secondary (healthcare workers). It is necessary to create streams of activity, streamline, standardise the activities of the group, redefine roles, redefining priorities, and establish indicators of improvement.
2.1 The theory of flows in hospital John Black remembers in The Toyota Way to Healthcare Excellence (2008) that seven critical flows may be distinguished in hospital.
2.1.1 Patient flows The transition of patients in hospitals should be fast and easy. Instead, patients and their families find themselves struggling to be taken into account. Behind a request for treatment there is always a queue. It is possible to develop a hospital system that provides a flow without useless interruptions: •
create open-cell, flexible, interchangeable equipment and staff
•
adjust the on-site process that stops, without deferring the problem
•
if the process must be stopped for time machine, use it to productive activity
4
E. Romano et al.
•
start the process so that you do not have to repeat several times the same things
•
use the technique of one piece flow.
2.1.2 Flow of clinical staff The movement of physicians between one department and another should be easy and fast to enable to spend time in contact with the patient and colleague seeking a special consultation. It very often happens that the path to get to the different places to visit is so long, complex and requires much time, to reduce time available to patients. For this reason it is important: •
to create an ergonomic environment, sending a clear message of attention to the employee by the organisation
•
to eliminate chairs and armchairs that lead to be parked
•
to avoid commitments overload, but to distribute the commitments between the service personnel
•
to provide support for the recovery room nurse by ICU nurse, when the flow in this area is occasionally reduced, represents an improvement of clinical workflows.
2.1.3 Flow of drugs Drugs and medications flows follow the patients flows, so the formers must accompany the latters closely. It is necessary: •
to locate medications and drugs close to patients as in ICU
•
to create small pharmacies nearby to patients, all managed by Kanban system
•
to plan the discharge the night before, preparing the pharmacy for drugs delivery whose will be discharged.
2.1.4 Flow of department It is necessary to reduce the stock of hospitals up to 50% and create systems kanban peripheral, not smaller warehouses in the suburbs that have the same margin of inefficiency as the central ones. The technique of filling only when there is consumption is not difficult to apply and leads to immediate efficiencies, by reducing waste and inventory.
2.1.5 Information flows The information must accompany the client (patient) in continuous, real and correct way, according to the rules of respect and sharing as well as aid in making decisions.
2.1.6 Equipment flow It must avoid putting medical equipment in places to be reached, that require excessive times for doctors and nurses as well as for patients, when necessary.
A decision support tool, implemented in a system dynamics model
5
It is necessary: •
that the medical equipment are put in sequence during the path using the one piece flow technique
•
to optimise the size of the equipment: lightweight, transportable by one person without difficulty, small and made in easiest way
•
to have collection areas because they are not in the middle activities flows but are easily accessible when need (Goyal and Jain, 2013).
2.1.7 Process flow-technical engineering Layout structure must be able to change according to the needs of flows changes; for this reason, it is necessary to do simulations on the logistics.
3
The current implementation of lean techniques in healthcare
It is possible identify five critical issues with which all hospitals are required to deal with: finding an adequate conformity between the areas of first aid and emergency and the rest of the hospital to receive, treat, discharge or admit with the greatest appropriateness; manage waiting lists for surgery; reduce overall costs; considering the length of stay; increased hospital-acquired infections. Interaction between these points shows that the length of stay is the most critical, having an impact on infections, on costs, waiting lists, and the impossibility of hospitalisation due to lack of available beds. The Virginia Mason Medical Centre in Seattle has pursued the Virginia Mason production system, the Toyota model, which includes six operations: •
the patient is considered at the centre of all processes
•
the creation of an environment where people feel safe and free to engage in the improvement, including the adoption of a no layoff policy
•
implementation of a company-wide alert system for defects called the patient safety alert system
•
promoting innovation and brainstorming
•
creating an economic organisation thrives mainly by eliminating waste
•
responsible leadership.
By engaging in the elimination of waste, the Virginia Mason has made it a more effective and efficient system in order to eliminate the planned expansions, saving significantly in terms of expenditure, in particular have been saved $1 million for a further chamber, 1 to 3 million dollars for the rooms for endoscopy, $6 million for new operating rooms that were no longer needed. The experience of Lean ThedaCare in Wisconsin began in 2004, the year in which the structure has reduced its costs by more than $27 million, managing to successfully apply the techniques of Lean Management to countless hospital wards. The redesign of business processes has been developed along two lines: relationship with patients and internal organisation.
Comment [t1]: Author: Please confirm if the amended citation was inserted correctly in the text. If not, kindly please provide a more specific and clearer instruction/s on where to insert the said citation in the text.
6
E. Romano et al.
As regards the first aspect, some services have been identified, such as obtaining an appointment, the reception of a diagnosis, of a medication and of clinical tests results that are perceived by users as quality indices (Kolb et al., 2007; Briano et al., 2010). From the internal organisation point of view, however, the most critical operations have been identified, such as the supply pharmaceutical materials, returns management, standardisation of work activities, the realisation of the performance of clinical and wards staff, and monitoring of care plans and information patients flow. It is therefore proceeded to the realisation of its value stream maps and based on the results of the mapping, waste elimination and rapid improvement of processes, obtained through several Kaizen events cycles followed follow-up meetings. The first problem was the Flinders Medical Centre Emergency Department (ED), which, starting from mid-2003, has been subjected to a terrible overcrowding with an attendance of about 50,000 patients a year, of which 40% required subsequent hospitalisation. In this condition of overcrowding in the emergency department, was joined by then the inadequacy of the complex triage system in force at the Flinders. Flinders’ Medical Centre triage system was based on Australian Triage Scale divides incoming patients into five urgency categories. The purpose of the same was the adoption of Lean thinking in order to improve the flow of patients and reduce waste in the core medical services and support within the ED. Associating conceptually the patient’s symptoms to the ‘raw materials’ and the path of patients – from acceptance until discharge – the ‘finished product’, said the group, first of all, mapped the steps of that process in the emergency room. The value stream, which it refers are the following: •
patients who subsequently received the ED treatments, in all probability could be immediately discharged
•
patients who subsequently be admitted in another part of the hospital to undergo further treatment.
It is a change made in the triage system, implementing a separation upstream of the two value streams. Each flow has been attributed to two distinct areas of the department, as well as two different teams of doctors and nurses, thus making it possible to apply differential treatment. In conclusion, in terms of ‘Lean’ in the department of emergency Flinders Medical Centre in Adelaide objectives were to reduce waste and make more fluid processes. These goals have been achieved with the creation of ‘production cells’ in sync with the flow of value within the department. Each of these cells has been structured, furthermore, in such a way as to have its focus on a specific ‘patient-care family’ and to complete the job rather than insert the patients in queues.
3.1 Community hospital of Lexington According to the survey of the National Hospital Ambulatory Medical Care in 2006, the number of annual visits to the ED in the USA has grown from 90.3 million in 1996 to 119.2 million in 2006, and the number of emergency departments in hospitals decreased from 4,019 to 3,833, which implies an increase of 32% of visits to ED and a reduction of 5% of the capacity of the emergency room.
A decision support tool, implemented in a system dynamics model
7
This crowding may result in a delay in the administration of treatment, waiting times and longer hospital stay, work overload for staff, flight of the patients, and low productivity. It appears, therefore, of significant importance to improve the efficiency of ED to reduce crowding. To achieve this level of efficiency is necessary to realise an accurate mapping and analysis of the flow of patients in the emergency room. The simulation model can represent the flow of patients and the distribution of the processes of care, emulate the process and its dynamics in certain random distributions, and provide predictions for the performance measurement. This tool can help in the management of the health service to assess the effectiveness of current practice, also makes it possible to perform the analyses ‘what if’ scenarios to predict the impact of staff, resources and operational changes on the determination of the optimal configurations system, in addition to the evaluation of trade-offs between system variables. The community hospital with 468 beds is a medical centre that provides health services to the communities of central and eastern areas of the state of Kentucky. The emergency department of this hospital is faced with the following issues: •
increased patient visits (48,000 per year)
•
shortage of nursing staff
•
long delays.
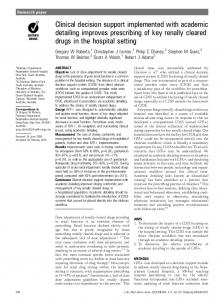
To improve the efficiency of the emergency room, a simulation was performed to assess the optimal configurations of labour and resources, and, in order to improve management strategies. The SIMUL8 software was used to simulate the flow of patients in the emergency department (Figure 1), with the objective of evaluating and, if it is possible, to improve the following parameters: length of hospital stay, waiting times, and ‘drain’ of patients without being visited. Figure 1
Map of patient flow in the emergency room
In the simulation model, all the services provided by doctors and nurses along with laboratory tests, expectations, and discharge are characterised as ‘machines’, and doctors, nurses, and equipment are modelled as ‘resources’. These machines (medical service, nursing, and testing service) must unite with the corresponding resources (doctors, nurses, and equipment for testing) to work and then release their performance. By grouping all the processes carried out in a room (occupied by one patient) and
8
E. Romano et al.
considering these activities as one activity for 30 rooms, the authors have obtained a complete model of a hospital emergency room. An important experiment carried out on the data provided by the simulation model is the improvement that can be achieved by the introduction of a nursing team: no longer just a nurse who takes care of three rooms assigned, but two nurses who share the work of six rooms.
3.2 Boston hospital At the University Hospital of Boston was made a ‘fast track’ department with four beds and with a doctor and a nurse dedicated. Given an increased demand in the emergency room, the hospital administrators have sought new ways to provide a more efficient treatment. In the emergency room, this translates into the need to find new ways to organise and classify patients according to the severity and nature of their illness and how long does the treatment of their disease. To this end, some hospitals dedicate resources to patients who cross the system quickly. This technique is known as fast track (FT). In practice, the FT is specifically reserved for less severe patients, as these patients tend to have shorter treatment times. Currently, the triage is essential for patients to be sent to the fast track using the parameter (ESI – Emergency Severity Index). In particular, it will access the FT those less severe patients for which it is assumed a crossing time of the system shorter (Oumlil and Williams, 2011; Nash et al., 2007). Triage has two main tasks: to prioritise based on urgency of conditions; and sorting patients to facilitate the flow of the process in the emergency room. Currently both tasks are performed using the same parameter: the ESI, this can lead to errors that can spread throughout the system. The solution, therefore, was, to use a different index to sort patients in the emergency room, i.e., Park Index (PI) assigns a certain level to patients on the basis of an estimate of treatment time, no matter how serious their condition. We used a discrete event simulation model of the emergency room in order to test the effect that the PI would have to improve the flow of patients. This simulation has been carried out with the ARENA Software Rockwell. Five levels of PI with a relative difference of 30 min. have been proposed: •
PI 1, in ED time between 0 and 30 min.
•
PI 2, in ED time between 30 and 60 min.
•
PI 3, in ED time between 60 and 90 min.
•
PI 4, in ED time between 90 and 120 min.
•
PI 5, in ED time greater than 120 min.
Each level of the PI corresponds to a certain percentage of patients with each level of ESI. The capacity of PS remains at about 4,800 patients, which increases with the use of FT and in particular with the allocation criterion PI. Another result is the reduction of time-to-bed (TTB) in the presence of FT. Changes to the TTB for ESI levels between the scenarios and the scenario in PI 28 beds are for the scenario PI 1: +14%, PI 1–2: –32%, PI 1–3: –49%, PI 1–4: –4%, PI 1–5: +27%. It should be noted, moreover, that the scenario PI 1–3 improves the TTB for all patients at over 49% and the improvement is for all levels of ESI (Peck and Kim, 2010).
A decision support tool, implemented in a system dynamics model Figure 2
4
9
Process map at Boston Hospital
The main areas of emergency room in a typical Italian hospital
To better understand the subsequent presentation of the entire process that a patient undergoes in the emergency room, the main areas of this important department are given below.
4.1 Triage The triage, as the first moment of reception of people arriving to ER, is a nurse function to define care priorities through the evaluation of clinical status of patients and their evolutionary risk. It ensures taking charge of patients and defines the order of access to treatment. Its function does not reduce the waiting time of all patients but redistributes them in favour of those who need urgent intervention, assigning to each patient a colour code. •
Red code (patient are in critical condition): it is the top priority; these are patients with very serious diseases that lead to the alteration or impairment of vital parameters. The user is accepted and treated immediately.
•
Yellow code (patient are potentially in critical condition): they are patients with looming threat of vital functions failure. Particular aspects contribute to the allocation of this code: intensity of the symptom, altered vital parameters related to the main symptom. For patients who have been given ‘yellow code’, that access to medical examination is consistent with other urgent/emergency in place, almost immediately. In the event that the patient is not treated within 20 minutes, it must be re-evaluated by checking that there have arisen conditions to classify it as a red code.
10
E. Romano et al.
•
Green code: patient who needs a deferrable medical service (does not require a medical evaluation immediately and has no signs/symptoms of severity described for red and yellow codes); at time of assessment his vital functions are intact and vital parameters are normal. Access to clinics is done after red and yellow codes.
•
White code: criteria to assign a white code are: there is no alteration of vital functions; there is no critical symptom or at aggravation risk; the symptoms are minor or has been present for a few days or is chronic; the user may find a solution to the problem using the healthcare pathways alternative to the ER. Access to clinics is done after red, yellow and green codes.
4.2 Shock room This is an area equipped for the access to red codes, at any time of the day, with all resources necessary for all life saving interventions and ready to welcome the team (including multidisciplinary) which will be called to intervene. The ensemble of this area with the area of yellow codes management endangers to reduce the efficiency (for consumption of resources, overcrowding, etc.) of team in an absolute emergency. It has a size such as to provide the contemporary work on the patient of a multidisciplinary team (up to three doctors and four nurses).
4.3 Urgency (yellow/green codes) This is an area with boxes/multiple and equivalents modules and in any case individually equipped for life saving interventions, in which the assessment and initial treatment of patients with yellow and green codes take place. The distinctive feature of this area is the flexibility of the system in taking on even additional flows of patients (crowding) with the activation of new points of view/treatment.
4.3 Minor codes Area dedicated to the evaluation and treatment of patients with minor problems (interventions mono-resources).
4.4 Assisted waiting The holding area for patients who need to complete diagnostic and/or therapeutic treatment and therefore they are still in ‘process’ phase (four to six hours) and obviously they are in need of nursing and personal care. In this department can also be stationed those patients who, having completed the diagnostic/therapeutic, should be transferred to a specialist department, because they have serious problems, but cannot access to the overcrowding of the hospital (access block and overcrowding).
4.5 Short observation (OB) Short observation is reserved for those patients for whom it is not possible to make an outcome decision (discharge or admission) within the first four to six hours after arrival in ER and therefore require a longer period of assessment to achieve the highest possible
A decision support tool, implemented in a system dynamics model
11
appropriateness in recovery and discharge. This area is located in a space adjacent to the ER, which is functionally connected. The patient may remain under observation up to a maximum of 36 hours. Its functions are: longitudinal clinical-instrumental observation; deepening diagnostic; completion and verification of effectiveness of urgency therapy. Patient must have a single clinical preeminent problem to define or solve.
4.6 Short intensive observation (OBI) The activity of this area includes the management of patients with different clinical problems and of varying complexity (including trauma and toxicology), in which the diagnostic and therapeutic procedures are not exhaustible in a few hours.
5
Our approach
The simulation approach, in a system dynamics, allows us to consider two distinct aspects: qualitative and quantitative. The first involves the construction of a causal loop diagram, which represents graphically the way in which the elements of the system are connected, thus identifying such feedback mechanisms are active within that system and what to produce, consequently, the relative dynamics. The process represented describes interactions among variables (Chiocca et al., 2011; Guizzi et al., 2012; Holimchayachotikul et al., 2011): •
patients in the emergency room
•
rate of discharge
•
rate of hospitalisation
•
patients waiting.
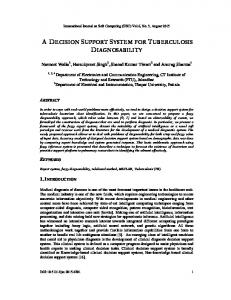
By CLD in Figure 3, therefore, it is clear that the increase in the arrival of patients increases the number of patients in the emergency room; more than this number grows the greater the rate of hospitalisation and the rate of patients waiting. Similarly, then, can be seen that the increase in the discharge rate and the rate of hospitalisation produces a reduction of the patients in the emergency room and those waiting. This creates two loops of balance, one of the patients in the ward and the rate of discharge and the other among patients on the ward and the rate of hospitalisation. The variables to consider in order to have a complete picture of the dynamics and the influence of the variable characteristics of a hospital ward so complex, are numerous. It is noted, therefore, that the loop is a balancing cycle, since the increase of the capacity in the emergency department decreases the number of patients treated, an increase of this variable implies the increase in the output rate and consequently decrease the waiting patients. The identification of links between the variables characterising the process indicate a dynamic relationship between them. Our approach is to identify an optimal solution of both effectively and efficiently, in accordance with the dynamic interactions between the variables. For this reason, we developed a simulation model in system dynamics (SD) to consider the dynamic changes and feedback of the system variables. The quantitative modelling SD consists, successively, in converting the CLD in a stock-flow diagram (Briano et al., 2000; Gallo
12
E. Romano et al.
et al., 2011; Giribone et al., 2007). It is built at first as a physical flow (Figure 4), which consists in the representation of the entire synthetic process that involves the patient from access to the output (Murino et al., 2011; Guerra et al., 2009).
If not, kindly please provide a more specific and clearer instruction/s on where to insert the said citations in the text.
Casual loop diagram (see online version for colours)
Figure 3
-
Waiting Time
+
Tolerance
+
Patients unserved exit rate Capacity
+
-
-
-
GAP=(cap.- patients)
Processing Time of the Petient Resources
+
Saturation
+
-
Diagnostic Capability
Lead Time
number of pathological tractability
number of pathological severity
+
+
Standard Time + Δ=(Lead Time-standard time)
% severity
% trattability
-
Exit Time
Queue Patients at the ED
-
-
+ +
patients arrive
+
+
+
number of stabilized patients
Quality System Perception
return patients
-
+
% stabilized patients
+
+ dead
-
% dead % partially stabilized + partially stabilized
Figure 4
Physical flow in a S&F diagram (see online version for colours)
%_red_codes red_rate
total_red shock_room
red_codes
patients
exit_red ev_end_shock_roo m
% _yellow_green_cod es perc_gialli_verdi
triage
total_y-r yellow_green_code s
polivalent_box
exit_yellow_green total_exit_yg_patients
white_codes genaration_rate_patien ts total_white white_codes_area
Comment [t2]: Author: Please confirm if the amended citations were inserted correctly in the text.
exit_white
ev_end_evaluation
We can understand the path of the patients in the emergency department. The incoming stream goes through the triage where it is divided into three different flows according to the colour code assigned.
13
A decision support tool, implemented in a system dynamics model 1
the red code (highest priority) are sent to the shock-room, at the end of care the patient are to flow out, and then accumulate in the level red_total
2
patients coded yellow and green (medium priority) are sent to the department polyvalent, and at the end of treatment accumulate in a virtual stack
3
patients with white code are sent to the area dedicated to the end of treatment. They accumulate in a virtual stack of white_code_level name.
In our case there are four level variables: •
Triage: represents the number of patients who need to enter into the department, then identifies the number of patients outside waiting to get in the department. This level is filled by patient_arriving flow, given by a random generation rate, which tells us how many patients are generated between a minimum and a maximum value.
•
Shock room: i.e., the actual number of patients entering into the department and precisely in the red codes area.
•
Multi-purpose box: i.e., the actual number of patients entering the department, or number of patients with yellow and green codes.
•
White codes area: i.e., the actual number of patients into the zone of the department reserved to white codes.
The flow variables are: •
Patient_ arriving: patients coming to the emergency room
•
Red_codes: patients flow to which is assigned by triage a red code
•
Yellow_green_codes: patients flow to which is assigned by triage a yellow or green code
•
White_codes: patients flow to which is assigned by triage a white code
•
Exit_patients_r: patients flow with red codes who have finished their path in that department, and then leave the system
•
Exit_patients_gv: patients flow with yellow or green code who have finished their path in the department and then leave the system
•
Exit_patients_b: patients flow with white code who have finished their path in that department and then leave the system.
The two constants, %_red_codes and %_yellow_codes are precisely equal to the percentage of patients with red codes and yellow and green codes together. The percentage of white codes is, instead, calculated as the ones’ complement compared to the two percentages listed above, in the following way:
whitecodes = triange − ( yellow_green_code + red_codes)
(1)
Variables SnapShot have been built in the model. They serve for the connection of variables placed elsewhere in the model. We have, for example, in the physical flow, ‘ev_end_schockroom’, ‘ev_end_evaluation’, ‘total_exit_green_codes’ which are events
14
E. Romano et al.
that occur if the patient terms that guarantee its path and exits, freeing resources for subsequent patients. In particular, the logic of the flow variables is of the if/then/else: IF ( ins hock_room = 1 and intervention_time_lifesave ≤ 0 then 1)
(2)
This logic means that if there are patients in the red codes area and if, at the same time, necessary time is spent in order that the patient who has occupied the bed previously had been treated, then a new patient is brought in the shock-room for treatment. This treatment is equivalent to Petri net logic. In particular, the physical flow is triggered by events. When these events occur, they enable level variables and ensure that the product/patient can move forward until its complete realisation, in this case to the exit.
5.1 Red codes The shock_room level is simulated by an events chain in Figure 5 that describes the sequence of events that characterise each operational phase of the process. The levels represent the different activities in which the patient is subject to within the area, from the moment when the bed releases, to the time he exits. The flows, instead, represent the impulses that generate state changes and allow to switch from operation to the next, allowing the progress of patients. To trigger the events, it has to satisfy the constraints, which are identified graphically by SanpShot, seen as resource management: one resource is the time that passes, called intervention_time_lifesave, the other is physical resource that is the availability of beds, free_bed_shock connected by an arrow to the events themselves (Figures 6 and 7). Figure 5
Schock_room level 2,00
free_bed_shock 1
1,00
2
1,00
1
0,00
2
0,00 1
0,00
red_codes
2 control_variable
0,00
real_time_to_save
in_shock_room
IN ev_in_shock_room
ev_end_shock_roo m
A decision support tool, implemented in a system dynamics model Figure 6
15
Bed resource for red codes
ev_in_shock_room 2,00
0,00
in_shock
free_bed_shock
occupied_bed_shock exit_shock
ev_end_shock_roo m
Figure 7
Time resource for red codes
ev_in_shock_room
1
00.00.00
2
00.00.00
in_shock_room
real_time_to_save start
end_operation_in_s hock
time_shock
The trigger of the chain is given by in level, initialised with a value equal to one. Immediately after it has ‘ev_in_shock_room’ event influenced by the level: ‘free_bed_shock’. The event unlocks in fact, it becomes equal to one, only when there is at least one free bed. The logic is as followers: IF ( IN = 1 and free_bed_shock > 0 then 1)
(3)
One of the two levels is the resource available (free_bed_shock) and the other represents the resource occupied (occupied_bed_shock). It starts from the level that represents the layout of the resort, when the ‘ev_in_shock_room’ is activated, the level that keeps track
16
E. Romano et al.
of the resources employed grows by one, and consequently the variable that keeps track of free resources decreases by one. This happens every time that the ‘ev_in_shock_room’ is active and until ‘free_bed_shock’ event does not end. When ‘free_bed_shock’ is equal to zero, resource is no longer available and therefore patients do not enter within the department. These activities are characterised by a time, ‘real_time_to_save’, after which patient leaves the shock-room. Figure 7 shows how the ‘real_time_to_save’ is influenced by: start = ev_in_shock_room × time_shock
(4)
where ‘ev_in_shock_room’ is seen such as an on/off switch that take the value: •
0 if the event there is not present (closed switch)
•
1 if the event there is present (open switch)
The ‘real_time_to_save’ represents the mean time required to stabilise the patient’s vital signs, and it is equal to one hour (on the average). This means that ‘real_time_to_save’ empties itself of one unit for each hour. When ‘ev_in_scock_room’ is equal to 1, ‘real_time_to_save’ enables itself, which empties as an hourglass in the function of the flow variable exiting ‘end_operation_in_shock’, affected by ‘in_shock_room’ level; the ‘end_operation_in_shock’ variable is equal to:
real_time_to_save ⎞ ⎛ end_operation_in_shock = min ⎜ in_shock_room; ⎟ TIMESTEP ⎝ ⎠
(5)
5.2 White codes A similar argument to that for red codes can be done for patients who have been assigned a code white (Figure 8). Even in this case, we used a variable which takes the value 1 if, and if there is the availability of a bed and in the area white codes generates a patient: IF ( IN b = 1 and free_bed > 0 and codes_white_area > 1 then 1)
(6)
This means that the user undergoes a medical examination, receiving the subsequent diagnosis. After necessary ‘in_diagnosis’, patient is subjected to the necessary therapy, increasing the ‘in_therapy’ level. After ‘in_therapy’ the ‘ev_evaluation’ event triggers and ‘real_time_evaluation’ begins to flow during which the doctor establishes the possibility to discharge the patient or possibly he predicts the hospitalisation, but in any way with the ‘ev_end_evaluation’ given by: IF ( In_therapy = 1 and real_time_evaluation ≤ 0 then 1)
(7)
The patient leaves the white codes area releasing the occupied resource and going to constitute the ‘ev_end_evaluation’ flow shown in Figure 8.
A decision support tool, implemented in a system dynamics model Figure 8
17
White codes flow 10,00
white_codes
1
00.00.00
2
00.00.00
3
00.00.00
4
00.00.00
5
6
free_beds 1
1,00
2
1,00
3
1,00
4
1,00
5
6
1
0,00
2
0,00
3
0,00
4
0,00
real_time_diagnosis control_b
IN_b
in_diagnosis ev_VM_&_diagnosis
5
real_therapy_time
6
in_therapy ev_therapy
ev_evaluation
in_evaluation ev_end_evaluation real_time_evaluation
It shows, also, the management of bed resource for white codes in Figure 9 and time resource in Figure 10, whose logics are the same with Figure 7. Figure 9
Bed resource for white codes
ev_VM_&_diagnosis 10,00
entry_rate
free_beds
occupied_beds exit_rate
ev_end_evaluation
0,00
18
E. Romano et al.
Figure 10 Time resource for white codes to therapy
ev_VM_&_diagnosis
1
00.00.00
2
00.00.00
3
00.00.00
4
00.00.00
5
00.00.00
5 in_diagnosis 6
real_time_diagnosis start_diagnosis
end_diagnosis
diagnosis_time Figure 11 Time resource for white codes to evaluate patient
ev_therapy
1
00.00.00
2
00.00.00
3
00.00.00
4
00.00.00
5
6
in_therapy
real_therapy_time start_therapy
end_therapy
therapy_time
5.3 Yellow and green codes Because of the excessive complexity of the operations, for patients with the code yellow and those with a green code further physical flow has been constructed, shown in Figures 12 and 13. Patients with codes yellow and green are first visited, then the flow is divided between the patients who are in need of analysis (level ‘analysis_lab’), which after the event ‘ev_end_analysis’ must receive a diagnosis and treatment required; and those that do not need analysis and immediately receive a diagnosis and therapy (level ‘diagnosis_therapy’). The flow at this point, it is again duplicated between:
A decision support tool, implemented in a system dynamics model 1
patients_therapy_not_completed: patients that did not complete therapy in the expected time (about one hour), and continue the cure in a zone called assisted waiting
2
patients_therapy_completed: patients who completed therapy in the expected time.
19
Both are merged in ‘total_patients_evalutated’ flow. Figure 12 Yellow and white codes physical flow
ev_evaluation
1
00.00.00
2
00.00.00
3
00.00.00
4
00.00.00
5 in_evaluation 6
real_time_evaluation start_evaluation
end_evaluation
evaluation_time
After the doctor has assessed the conditions, patients can go to increase the following flows: 1
patients_discharged: they leave the department to go home
2
patients_admitted: they come out of ER to be admitted to a specific department
3
patients_ob: as a result of the performed therapy, in this area patients can:
4
5
•
be admitted (patients_ob_admitted)
•
be discharged (patients_ob_discarged)
•
be dead (patients_ob_dead)
patients_obi: as a result of performed therapy; in this area patients can: •
be admitted (patients_obi_ admitted)
•
be discharged (patients_obi_ discarged)
•
be dead (patients_obi_ dead)
patients_dead: very rarely, it happens that a patient may die despite the received treatment, but it is still a possibility to be taken into account.
0,00 paziente
0,00 paziente
yellow_green_code s
patients_whitout_t herapy
green_yellow_queue examination to_examination yellow_& _green_patients
0,00 paziente
accepted_service_tim e
ev_end_visit
%_analysis
in_analysis
queue
0,00 paziente
ev_end_visit
exit_wthout_exami nation
patients_no_examination
0,00 paziente
to_analysis
analysis_lab
0,00 paziente
incomplete_therapy
ev_endlab_analysis ev_end_diagnosis_t herapy
5 6
total_patients_eval uated
0,00 paziente
%_copleted
completed_therapy
paziente
ev_fine_attesa_assi stita after_assisted
waiting_assisted
diagnosis_&_therapy
5 6
analized_patients
paziente
ev_end_diagnosis_t herapy
patients_in_ob
0,00 paziente
%_dead
dead_patients
0,00 paziente
%_obi
patients_in__obi
0,00 paziente
ev_end_evaluation _cond
%_hospitalization
ev_end_evaluation _cond
evaluation_patients
0,00 paziente
inpatients
0,00 paziente
patients_discharge d %_discharged
obi 0,00
paziente
5 6
1
ob
patients_in_ob_dea d
dead
0,00 paziente
6
5
ev_end_ob
%_ob_dead
%_obi_dead
paziente
5 6
ev_end_ob
%_ob_discharged
ob_patients_discha rged
home
0,00 paziente
ev_end_ob
ob_patients_hospit alized
patients_in_obi_dis charged
ev_end_obi paziente %_obi_dimessi
0,00
paziente
patients_obi_dead
1
0,00 paziente
patients_in_obi_ho spitalized 5 6
0,00 paziente
hospitalization_in_the_depart ment
ev_end_evaluation _cond
20 E. Romano et al.
Figure 13 Main activities
A decision support tool, implemented in a system dynamics model
21
Figure 14 Examination activity 1
1,00
2
1,00
3
1,00
4
1,00
5
1,00
5
6
1,00 to_examination
7
1,00
8
1,00
9
1,00
10
1,00
control
11
1,00 free_bed_in_visit
12
1,00
real_examination_tim e
6
patients_in_visit
in_visit ev_in_visit
ev_end_visit
Figure 15 Laboratory analysis activity
to_analysis 1
0,00
2
0,00
3
0,00
3,00
free_analysis_res 1
1,00
2
1,00
3
1,00
1
0,00
2
0,00
3
0,00
4
0,00
5
6
control_var 1
0,00
2
0,00
3
0,00
in_lab_analsysis
start_analysis ev_in_analysis
real_lab_time 1
0,00
2
0,00
3 ev_endlab_analysis
0,00
All influenced by ‘ev_end_eval_cond’ event. Each level present in the physical flow shown in Figure 12 represents an activity, which the patient suffers, and is simulated by an events chain and relative management of beds and time resources. The main activities (in Figure 13, its events chain is shown) necessary for the patient’s care, then, are the following:
22
E. Romano et al.
•
examination: for this activity we have hypothesised 17 beds and 30 minutes for a visiting period (Figure 14)
•
laboratory analysis: three resources for the analysis and a duration of one hour (Figure 15)
•
diagnosis and therapy: 15 available beds and one hour for diagnosis and therapy timing (Figure 16)
•
assisted waiting: 11 beds for waiting and two hours of assisted waiting time (Figure 17)
•
assessment of conditions: for this activity a bed resource is not binding but a time equal to 15 minutes is however estimated (Figure 18)
•
OBI hospitalisation: ten beds and ten hours of mean residence time (Figure 19)
•
OB hospitalisation: 25 beds and ten hours of mean residence time (Figure 20).
The purpose of this paper is, therefore, to ‘snapshot’ the current state of a generic department emergency room and, having identified any problems, proposing improvements in optical lean. The results of these possible improvements can be evaluated with the simulation model previously described. Currently, emergency departments of Italian hospitals are in critical situation of an increasing demand that is not always possible to meet because of poor material resources, economic and insufficient staff. It is, therefore, sought to identify what could be a possible intervention that was able to improve the flow of patients, avoiding waste and then the non-value added. Figure 16 Diagnosis and therapy activity pa zie nte
5 6
1
0,00
analized_patients 2
0,00
3
0,00
4
0,00
17,00
5
1
1,00
2
1,00
3
1,00
free_therapy_beds
4
1,00
6
in_diagn
5
6
controllo_4 real_diag_time
in_diagnosis_therapy ev_in_diagnosis_th erapy
ev_end_diagnosis_t herapy
23
A decision support tool, implemented in a system dynamics model Figure 17 Assisted waiting activity 11,00
1
1,00
2
1,00
3
1,00
letti_attesa_liberi 1
0,00
2
0,00
3
0,00
4
1,00
4
0,00
5
1,00
5
0,00
6
1,00
7
1,00
8
1,00
9
1,00
10
1,00
11
1,00
1
0,00
2
0,00
3
0,00
4
0,00
5
paziente
5
6
1
0,00
2
0,00
3
0,00
4
0,00
5
5 0,00 incomplete_therapy 6
0,00
7
0,00 6 tempo_attesa_assisti ta
controllo_3 6 in_attesa_assistita
in_att
ev_in_attesa_assist ita
ev_fine_attesa_assi stita
Figure 18 Assessment of conditions activity 0,00 paziente
evaluation_patients
1,00
0,00
00.00.00
0,00
real_time_to_evaluat e_cond
in_evaluation_cond start_in_evaluation_co nd ev_in_evaluation_c ev_end_evaluation ond _cond
In particular it has been proposed a decoupling of the flow of patients through the introduction of an area dedicated to not severe patients (white code). It has also been proposed to introduce an additional colour-coded triage, blue in colour, allowing the nurse to triage to overcome the obstacle of white assign the code when there is an intermediate severity between the number of white and green. The triage operators, in fact, very often assign ‘conservatively’ code green which in reality turns out to be a code white. The proposal is to locate resources that are not saturated, which can be assigned to a different use (reallocate resources), to be dedicated to the management and care of patients only non-serious.
24
E. Romano et al.
Figure 19 OBI hospitalisation 10,00
0,00 paziente
free_beds_in_obi 5 patients_in__obi
1
1,00
2
1,00
3
1,00
1
0,00
4
1,00
2
0,00
5
1,00
6
3
0,00
1,00
7
1,00
4
0,00
5
0,00
6
5 controllo_6 real_time_obi 1
0,00
6
5
6
1
0,00
5 6
in_obi
in_o ev_in_obi
ev_end_obi
Figure 20 OB hospitalisation
6
Scenario I: current situation
The hospital should be a facility for patients in critical condition or with problems that can be treated only in hospital. Now, however, frequently hospitalised patients who complain of minor illnesses and the result of that is the overcrowding of the department, saturation and dispersion of resources, the expenditure of energy. The department ultimately represent a sort of ‘container’, having to deal with problems ranging from sprained ankles to the most severe heart attack. Currently, only a small percentage of patients entering the emergency department are assigned a code red which, however, are devoted to specific resources. The rest of the patients, therefore, are to crowd the already
A decision support tool, implemented in a system dynamics model
25
inadequate facilities creating many difficulties in managing not only of structural but also the medical and nursing staff. Figure 21 shows the current layout of the emergency department, where it can be seen that only two beds are dedicated to red codes (area circled in red), while the rest of the department serves all other codes. The input parameters used were as follows: •
assuming that the structure must reproduce a real situation, as a function of the catchment area, to determine the number of inputs was used a random function with a minimum value of 200 patients and a maximum value of 360, which simulates the load of users that are likely to require the use of emergency services.
•
the simulation involved a day ‘type’ derived from analysis of time series data collected in similar situations relating to infrastructure.
•
a proportion of patients with red code is 2%, the remaining 98% are patients with code yellow, green and white
•
bed for diagnosis and therapy: 15
The graph of Figure 22 shows the difference between the patients received in the department and those released after being served. The graph in Figure 22 shows that about 36% of patients remain on the queue within the department, locked to perform certain tasks. This situation is wasteful, and it is critical that we acted on this. Going, then, to assess the level of bed occupancy, we realised that the resource is underutilised. It is clear that it exploited only 50% of the available resources. Figure 21 Current layout of emergency room (see online version for colours)
26
E. Romano et al.
Figure 22 Difference between received (red colour) and released patients (green colours) (see online version for colours)
7
Scenario II: new configuration
In order to improve the progress of the flow and saturate the available resources, it was decided to devote part of the resources of unused bed, and a group of doctors and nurses to patients only with white code. Figure 23 Results of new reconfiguration (see online version for colours)
A decision support tool, implemented in a system dynamics model
27
Figure 24 New emergency layout configuration (see online version for colours)
It is assumed, therefore, to reserve an area for only white codes, identified by the orange box in the layout of Figure 24. In this scenario, patients no longer overload the department, but a certain percentage of them use bed resources and dedicated medical and nursing team. The graph of Figure 23 shows the results that are achieved as a result of the introduction of the said intervention. The last figure suggests reducing the proportion of patients still on the ward from 36% to about 10%. After turning the load on the system therefore has streamlined the flow of patients by making them carry on without a hitch in their course of treatment. The resource bed_therapy continues to be exploited without ever completely saturated.
8
Conclusions
The implementation of lean improvements led to positive results by improving the flow of patients, allowing you to serve almost everyone on the ward and allowing you to reallocate resources in a timely manner. The purpose of this paper is not to declare a definitive solution to the problems of Italian hospitals. It wants to represent, however, a cause for reflection on issues which, if carried out with depth and conviction and method can indeed play a key role in the reorganisation of hospitals. This is even more evident if one considers the Department of Emergency as part of a whole, or, in other words, as a node of a network characterised by other departments and services of a hospital such as intensive care or service emergency.
28
E. Romano et al.
References Aronsson, H., Abrahamsson, M. and Spens, K. (2011) ‘Developing lean and agile health care supply chains’, Supply Chain Management: An International Journal, Vol. 16, No. 3, pp.176–183, Emerald Group Publishing Limited. Briano, E., Caballini, C., Giribone, P. and Revetria, R. (2010) ‘Design of experiment and Monte Carlo simulation as support for gas turbine power plant availability estimation’, 12th WSEAS International Conference on Automatic Control, Modelling and Simulation, ACMOS ‘10, pp.223–230. Briano, E., Caballini, C., Mosca, M. and Revetria, R. (2000) ‘A system dynamics decision cockpit for a container terminal: the case of Voltri Terminal Europe’, International Journal of Mathematics and Computers in Simulation, Vol. 3, No. 2, pp.55–64. Chiocca, D., Guizzi, G., Murino, T., Revetria, R. and Romano, E. (2012) ‘A methodology for supporting lean healthcare’, Studies in Computational Intelligence, Vol. 431, pp.93–99. Deborah, J. (2010) ‘Nightingale, service systems innovation for treatment of post-traumatic stress in the U.S. military: an enterprise systems approach’, MIT-SDM 2010 Systems Thinking Conference Massachusetts Institute of Technology, October. Gallo, M., Romano, E. and Santillo, L.C. (2011) ‘A methodological approach to manage WEEE recovery systems in a push/pull logic’, Proceedings – Winter Simulation Conference, Art. no. 6147827, pp.1035–1047. Giribone, P., Oliva, F., Revetria, R. and Catania, A. (2007) ‘Models for supporting sea transportation evolution: a case study for an international harbour system’, WSEAS Transactions on Systems, Vol. 6, No. 4, pp.668–676. Goyal, S.K. and Jain, R. (2013) ‘Synchronising marketing and supply chain management policies for improving system performance’, International Journal of Procurement Management, Vol. 6, No. 5, pp.609–619. Guerra, L., Murino, T. and Romano, E. (2009) ‘Reverse logistics for electrical and electronic equipment: a modular simulation model’, Proceedings of the 8th WSEAS International Conference on System Science and Simulation in Engineering, ICOSSSE ‘09, pp.307–312. Guizzi, G., Chiocca, D. and Romano, E. (2012) ‘Healthcare lean thinking: simulation of an intensive care unit (ICU)’, Advances in Computer Science, Proceedings of the 6th WSEAS European Computing Conference (ECC ‘12). Holimchayachotikul, P., Leksakul, K. and Guizzi, G. (2011) ‘Robust design for etching process parameters of hard disk drive slider fabrication using data mining and multi response optimization’, WSEAS Transactions on Systems and Control, Vol. 6, No. 1, pp.15–24. Kolb, E., Peck, J. and Lee, T. (2007) ‘Effect of coupling between emergency department and inpatient unit on the overcrowding in emergency department’, Proceedings of the IEEE Winter Simulation Conference, pp.1586–1593. Murino, T., Romano, E. and Santillo, L.C. (2011) Supply chain performance sustainability through resilience function, Proceedings – Winter Simulation Conference, Art. No. 6147877, pp.1600–1611. Nash, K., Zachariah, B., Nitschmann, J. and Psencik, B. (2007) ‘Evaluation of the fast track unit of a university emergency department’, Journal of Emergency Nursing, Vol. 33, No. 1, pp.14–20. Oumlil, A.B. and Williams, A.J. (2011) ‘Strategic alliances and organisational buying: an empirical study of the healthcare industry’, International Journal of Procurement Management, Vol. 4, No. 6, pp.610–626. Peck, J.S. and Kim, S-G. (2010) ‘Improving patient flow through axiomatic design of hospital emergency departments’, CIRP Journal of Manufacturing Science and Technology, Vol. 2, pp.255–260.