5th International Conference on Advanced Technology & Sciences (ICAT'17)
May 09-12, Istanbul /TURKEY
___________________________________________________________________________________________________________
A Deep Learning Approach for Optimization of Systematic Signal Detection in Financial Trading Systems with Big Data Sercan Karaoglu#, Ugur Arpaci#, Serkan Ayvaz+ #
Foreks Inc. Sarıyer 34396, Istanbul, Turkey {sercan.karaoglu, ugur.arpaci}@foreks.com + Department of Software Engineering, Bahcesehir University Besiktas 34353, Istanbul, Turkey
[email protected] Abstract— Expert systems for trading signal detection have received considerable attention in recent years. In financial trading systems, investors’ main concern is determining the best time to buy or sell a stock. The trading decisions are often influenced by the emotions and feelings of the investors. Therefore, investors and researchers have aimed to develop systematic models to reduce the impact of emotions on trading decisions. Nevertheless, the use of algorithmic systems face another problem called “lack of dynamism”. Due to dynamic nature of financial markets, trading robots should quickly learn and adapt as human traders. Recently, a solution for detecting trading signals based on a dynamic threshold selection was proposed. In this study, we extend this approach by adopting several different rule based systems and enhancing it by using the Recurrent Neural Network algorithm. Recurrent Neural Networks learn the connection weights of subsystems with arbitrary sequences of inputs that make them a great fit for time series data. Our model is based on Piecewise Linear Representation and Recurrent Neural Network with the goal of detecting potential excessive movements in noisy stream of time series data. We use an exponential smoothing technique to detect abnormalities. Trading signals are produced using fixed time interval data from Istanbul Stock Exchange. The evaluations indicated that our model produces successful results in trading data. Future work will focus on further improvements and scalability of the model. Keywords— Big Data, Deep Learning, Recurrent Neural Networks, Expert Systems, Intelligent Trading Systems
I. INTRODUCTION Trader Decision Support Systems (TDSS), in short Expert Systems (ES), have become one of the hottest topics in the financial trading market. Since emotions can affect trading decisions, traders could benefit from using automatic trading systems to decide more logical and less emotional way. The continuing development of electronic trading led the traders to execute their trading decisions automatically by using software. Due to the dynamic, complex and volatile, nature of the stock markets, effective trading systems should react to the market dynamically. Many social, economic and political
situations continually affect the stock markets. Therefore, the parameters that the trading systems use must also be optimised automatically depending on the market fluctuations. Thus, the expert systems must possess an ability to learn and decide the market movements in a logical and mathematical way. Macroeconomic indicators and stock market technical indicators provide a certain level of insights to traders regarding the direction of stock prices. These insights can be beneficial for the traders in making buy or sell decisions. One of the widely known trading methods is technical analysis. The primary tool of technical analysis is the price of a stock itself and stock transaction volumes. The indicators of technical analysis are a collection of time series data in financial securities. Within the last two decades, many soft computing techniques have been developed in addition to technical analysis methodologies in financial instrument analysis. The majority of the current stock trading expert systems are based on these computational techniques. Composed of software developed using a scripting or programming language, the stock trading expert systems produce trade signals by exploiting technical indicators. Recently, there have been many studies investigating Artificial Neural Network(ANN) techniques in various context to improve the accuracy of trading decision support systems ( [1]–[5], [5]). Some studies have successfully applied an ANN approach to trading decision support systems that uses technical analysis indicators. With that said, one of the biggest challenges of using such systems is that the price variations contain numerous local minima and maxima points. Thus, these ANN systems may settle on a local minimum. The authors in [6] has developed a solution for detecting trading signals based on a dynamic threshold selection. In the study [7], Genetic Algorithm is used to improve technical analysis by optimising the parameters of trading rule to find as close as possible prices to reversals of trends. Expert systems using soft-computing methodologies seek relationship between input features and the output at the learning phase of the system. Therefore feature selection is one of the most important parts of these systems.
117
5th International Conference on Advanced Technology & Sciences (ICAT'17)
May 09-12, Istanbul /TURKEY
___________________________________________________________________________________________________________
The authors in [8] have focused on automated feature selection methods with neural networks in financial time series forecasting. The goal of this study is to develop an intelligent trading decision support system by applying the recurrent neural network methodology on top of financial trading subsystems to detect systematic signals in Big Data. In this study, we used data from Istanbul Stock Exchange to evaluate the model. II. RELATED WORK The stock market signal detection problem and the development of intelligent decision support trading systems have attracted significant attention from the research community recently. Ever-growing interest to the stock market signal detection can be partially attributed to potential financial rewards. Despite that, the prediction of the stock market prices is a very challenging task as the stock markets are complex and dynamic systems. There are various factors affecting the market. Amongst many factors, the noisiness of the stock market data plays important role in hindering successful detection of signals and prediction of the stock prices. While the stock market data are dynamic, volatile and noisy [9], there are some factors including macroeconomic forces, technical indicators and market sentiment that provide some insights to predict potential market movement over a period of time [10]. Many researchers proposed statistical and probabilistic systems to detect stock trading signals. Some studies have focused on the regression models [3], [11], [12]. While others proposed methods based on the time series models such as the ARIMA (Autoregressive Moving Average) model [13]–[16] and the GARCH (Generalized Autoregressive Conditional Heteroskedasticity) model [17]–[19]. The probabilistic models such as Bayesian [1] and other methods [20] have also been explored by some studies. From data mining perspective, some studies investigated application of Decision tree and Support vector machines in trading signal detection [1], [21]. There have been many approaches, e.g. [21] using intelligent systems to predict stock trading signal. With recent advances in hardware, data storage, Big data processing technologies, have made it more efficient and affordable to use complex machine learning algorithms in various computational problems [22], [23]. With availability of large amounts of computational power, an increasing number of research studies have investigated the stock market detection problem using pattern recognition and machine learning techniques in the last decade. Recently, many studies approaches suggested using Neural Networks in financial trading systems [24]–[27]. III. OVERVIEW OF SYSTEM ARCHITECTURE During the training phase, the deep learning algorithm goes through lots of iterations and intermediate stages. Moreover, finding the most optimal parameter values ends up running the same set of program packages iteratively, over and over again.
This is a very time consuming and repetitive process, which also requires powerful set of resources in terms of computation. Thus, we need a computation setup to automate the repetitive computation process. The underlying system should also support horizontal scaling at runtime. This optimum architectural setup saves a lot of resources in terms of time and money. In our system, all the computational workloads run on AWS public cloud. We also followed the best practices and tunings in order to make efficient use of the platform. A. Flow of data We store the stock market data in Amazon Simple Storage Service (S3)1, which is the ultimate data lake on the cloud. They are compressed in gzip format for each day, ready to be consumed. Format of the data is raw, because the algorithms need them in various types and shapes; therefore it is their responsibility to format specific interval of days accordingly. B. Intermediate Data Store When a work is scheduled to make analysis on the data stored on S3, it simply pulls the required dataset from S3, uncompresses it, converts the format with respect to specified columns and inserts into an intermediate Apache Cassandra2 database service. At this stage, dataset is formatted and becomes ready for future analysis. When a worker node requires data, it simply pulls the dataset by making queries to Cassandra service. If the result of an algorithm is a field, it is also inserted as a column in the database. As a result, the dataset is served to the worker nodes via Cassandra service.
Fig. 1 Overview of the system component and data flow
C. Notebook Notebooks are very popular in data science world. They allow developers to write, deploy code and analyse the aggregated result sets by generating tables or charts. Notebooks are actually products themselves. They provide location transparency as well. Therefore, any application that is deployed or any results that are stored on S3, becomes accessible over the Internet with proper credentials, as shown 1
https://aws.amazon.com/blogs/big-data/introducing-the-data-lakesolution-on-aws 2 http://cassandra.apache.org/
118
5th International Conference on Advanced Technology & Sciences (ICAT'17)
May 09-12, Istanbul /TURKEY
___________________________________________________________________________________________________________
in Fig. 1. Throughout the analysis, the motivation is to obtain an aggregated result set or a chart, which makes it easy to interpret the returned data. D. Mesos Operating System and Spark Nodes During the analysis phase, we simply schedule the algorithms as deployable artifacts. This can be deployed directly to a Spark master node. However, this will be on a standalone mode. In order to obtain a location transparent, distributed computation service, we needed to operate multiple virtual machines on the cloud. Therefore, Spark cluster needs to be transparent to the client and managed by a third party service.
Every member of Mesos processes are deployed as Docker 5 containers. Docker containers simply do not save any state for running processes and are ideal solution for automating the deployment. Whenever a new virtual machine labelled as worker (Mesos slave) wants to join to the cluster, we simply deploy Mesos slave with proper configuration set including the masters address in the network, Zookeeper cluster etc. Hence, we expand our computational resources with execution of one command only.
Fig. 2 Architectural Overview of Mesos Operating System and Spark Nodes
Apache Mesos3 is so called a data center operating system which operates multiple set of virtual or physical servers by making abstractions on their resources. Mesos is deployed in master-slave relationship; masters are simply the nodes that are aware of the cluster’s state and responsible to schedule any task attempts. Slave nodes simply obey the Mesos master node. Furthermore, they also include Spark binaries bundled with them which is required when a Spark job scheduled for execution on any of them. Mesos masters and slaves discover themselves dynamically via a 3-node Zookeeper 4 cluster. Therefore, any new member of Mesos slave will increase the total capacity of the cluster by the means of computational resources automatically, as shown in Fig. 2. After we finish the work on a slave node, we simply remove the corresponding virtual machine to scale down.
E. AWS Spot Instances Amazon Web Services6 have variety of services almost in every part of the computation. As other public cloud providers, one of their major services is virtual machines on the cloud, called EC2. AWS sells the EC2 (elastic compute instances) instances in different forms and one of them is called “spot market”. In order to optimally utilize the machines in data centers, Amazon AWS simply sells unused instances at a very lower price than usual. However, if there is a higher bid for these instances, the bidders can possibly lose some or all of them. Therefore, we have applied an automation logic for maintaining specific number of spot instances up and running at a very reasonable cost.
3
5
4
http://mesos.apache.org/ https://zookeeper.apache.org/
6
119
https://www.docker.com/ https://aws.amazon.com/
5th International Conference on Advanced Technology & Sciences (ICAT'17)
May 09-12, Istanbul /TURKEY
___________________________________________________________________________________________________________ TABLE I LIST OF MARKET MICROSTRUCTURE INDICATORS IN THE MODEL
IV. METHODS A. Data Collection and Pre-processing The stock market dataset that was used in our evaluations is in the standard raw format of Istanbul Stock ExchangeNasdaq suite. In 2015, a set of agreements were made between Istanbul Stock Exchange and NASDAQ 7 . The agreements simply state that the Istanbul Stock Exchange would regulate and process the business with respect to new standards defined as manifested. As data publishers, we have been involved in this transformation project which is required to implement the new connectors and transformation engines of the stock exchange stream data. Since our connectors have access to the real-time stream data, we can log and store it in raw format simultaneously. For evaluations in this study, we used entire stock trade data for year of 2016 to train our model. The size of decompressed 2016 data is 46.5 GB in total.
Feature TradeCount15, TradeCount30, TradeCount60 Spread
PriceVwapDiff, PricePeriodicVwapDiff
BidAskTotalTradeVolumeDiff TradeVol15, TradeVol30, TradeVol60
B. Market Microstructure Indicators The input parameter selection is a vital step for developing successful machine learning models. In order to improve the accuracy of predictions, the machine learning models should be trained on the market microstructure features that have real impact on the market book and allow learning the policy to condition. Although there are many potential features that might be used in stock market learning models, we found that the features that are listed in Table 1 are useful in our Machine Learning Model.
lambda15, lambda30, lambda60 FirstLevelImbalance, SecondLevelImbalance, ThirthLevelImbalance, ForthLevelImbalance, FifthLevelImbalance Volatility
C. Piecewise Linear Representation Piecewise Linear Representation (PLR) is a simple time series data modelling method which allows dynamic incremental update of time series. The granularity of approximation of PLR can be changed dynamically by setting the number of line segments [28]. The trading time points may vanish quickly. The quick variations in trading points can be difficult to be detected and used in prediction systems. Thus, we use PLR as a sliding window for finding the troughs and peaks in the stock market data. Using PLR, our system determines turning points as trade signals. D. Model Development using Recurrent Neural Networks For data modelling, we use a bidirectional and full gradient version of Long short-term memory (LSTM), also known as Graves LSTM [29], [30] in our system. As a type of recurrent neural network (RNN), LSTM [31], [32] is a powerful method for analysing time series data with gaps of unknown size between important events. The main advantage of LSTM when compared to traditional RNNs and hidden Markov models is its relative insensitivity to lag length. LSTM solves problem with the flow of backpropagation errors [33] in traditional RNNs consisting of long time lags by introducing a network architecture containing memory blocks. The recurrently connected memory blocks are composed of the input, output and forget gates. Each cell multiplies the input 7
http://www.borsaistanbul.com/en/news/2015/12/12/borsa-istanbulgoes-live-on-nasdaq-technology-suite
Pt15, Pt30, Pt60
DifTotalTurnoverPercent, DifTotalTurnover BidOrAskDirection OpenChangePercent, LowChangePercent, HighChangePercent, PriceOpenDiff, PriceHighDiff, PriceLowDiff TotalVolume DailyChangePercent
Description The trade counts within 15,30,60 second windows The gap between Bid and Ask price Indicates the differences between the price and Realtime Volume Weighted Average, between price and periodic Volume Weighted Average Orderflow => Difference between trades occurred at Bid price and trades occurred at Ask price The trade volume within 15,30,60 second windows The computed Kyle’s Lambda values within 15,30,60 second windows Orderbook Imbalance for 5 Levels (BidVolume-AskVolume) / (BidVolume+AskVolume) Represents the difference between highest daily price and lowest daily price Indicates the difference between sum of trades occurred at the Bid and Ask prices within 15,30,60 second windows times Kyle’s Lambda values Represents the difference between Turnover occurring at Bid and Ask prices and Turnover percentage Indicates that if trade realized at bid or ask level The differences between previous closing price and the current day lowest and highest opening prices, and the changes in percentage respectively Daily total volume until current moment The difference between current price and previous closing price
with the activation of the input gate. The previous cell values are multiplied by the forget gate. The output to the network is multiplied by the output gate. Hence, the cells in the network interact using the gates [29]. Our system uses Graves LSTM because it outperforms the original LSTM [29], [34]. Moreover, our system uses Exponential smoothing (ES) approach. ES is a commonly used for applying low-pass filters to eliminate the short-term fluctuations when analyzing time
120
5th International Conference on Advanced Technology & Sciences (ICAT'17)
May 09-12, Istanbul /TURKEY
___________________________________________________________________________________________________________
series data. By smoothing noise, ES retains the longer-term trend. It decreases weights over time exponentially as opposed
to feed into LSTM. More precisely, we used 20 timesteps for 36 features in a sliding window approach. Our target values
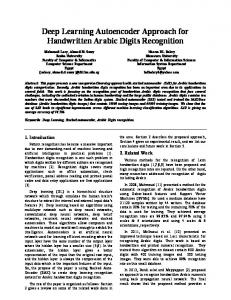
Fig. 3 Mean Square Error over Iterations
to moving average that assigns equal weights for past observations. V. RESULTS To evaluate the performance our model, we used three months of Garanti Bank’s trade data from September 2016 to January 2017 which corresponds to last quarter of 2016. The reason for choosing Garanti Bank stock is that it is the most liquid stock in Istanbul Stock Exchange. TABLE 2 EVALUATION RESULTS
Evaluation Metrics
Mean Squared Error Root Mean Squared Error Mean Absolute Error Relative Squared Error Correlation R-square
Values
0.087 0.296 0.256 1.060 0.018
The data contained more than 400.000 trades during the period. We applied a sliding window approach for each trade
were piecewise linear representations with the threshold of 0.06 points for prices. After evaluating several different parameters within the hyper parameter space, we found the following parameters as a good fit for our model consisting of three layers. We initialized their weights using Xavier init method. First two layers are Graves LSTM and the last layer is RNN output layer. Graves LSTM layers’ width is 32 and RNN output layer has 1 output for 20 timesteps. We chose learning rate as 0.1, updater function as RMSProp and activation function as ReLU. Training phase started with mean square error of 14 and dropped to as low as 0.001, as shown in Fig. 3. We noticed that error dropped consistently when we apply batch size of 20. Less than 20 caused error function to be noisy. All layers appeared to be learning almost equally when considering the standard deviations of gradients as shown in Fig. 4. Furthermore, we improved the model’s accuracy by applying standardization first and max-min normalization as a second step. We used first quarter of 2017 as test interval which makes train-test split as almost 50%. Table 2 demonstrates the results of evaluation parameters of the model for Quarter 1-2017 data.
Fig. 4 Gradient Standard Deviations
121
5th International Conference on Advanced Technology & Sciences (ICAT'17)
May 09-12, Istanbul /TURKEY
___________________________________________________________________________________________________________
VI. CONCLUSIONS In this study, we proposed a Recurrent Neural Network with Graves LSTM Layers approach for detecting buy-sell pressure of movements which can be used in automated stock trading algorithms. For detection of the trend strength, one can take difference between last time step and first time step of output of LSTM-RNN net. Our focus was to develop a metaindicator based on features related with market microstructre which incorporates evolutionary characteristics to identify market outlook in a measureable way. We evaluated the effectiveness of our approach using irregular interval time series data of Garanti Bank’s Stock Share from Istanbul Stock Exchange. Our findings indicate that our model performs well and can lead to systematic profits when trades are triggered based on the model’s output. The output of the model represents the strength of trading signals that are denoted as a number between -1 to 1. The experimental results demonstrate that our proposed neural network supported model is effective in understanding the trend strength and can successfully be used in soft-computing stock trading system. For the future work, we plan to develop a reinforcement learning technique on top of our model for detection of the most optimum potential trading points and conduct a comparative analysis of our model against alternative techniques. ACKNOWLEDGMENT This work was supported partially by Istanbul Kalkinma Ajansi Grant for Istanbul Big Data Egitim ve Arastirma Merkezi, TR10/16/YNY/0036. REFERENCES [1]
[2]
[3]
[4]
[5]
[6]
[7]
[8]
[9]
J.-H. Cheng, H.-P. Chen, and Y.-M. Lin, “A hybrid forecast marketing timing model based on probabilistic neural network, rough set and C4. 5,” Expert Syst. Appl., vol. 37, no. 3, pp. 1814–1820, 2010. T.-J. Hsieh, H.-F. Hsiao, and W.-C. Yeh, “Forecasting stock markets using wavelet transforms and recurrent neural networks: An integrated system based on artificial bee colony algorithm,” Appl. Soft Comput., vol. 11, no. 2, pp. 2510–2525, 2011. M. Jasemi, A. M. Kimiagari, and A. Memariani, “A modern neural network model to do stock market timing on the basis of the ancient investment technique of Japanese Candlestick,” Expert Syst. Appl., vol. 38, no. 4, pp. 3884–3890, 2011. K.-J. Kim and H. Ahn, “Simultaneous optimization of artificial neural networks for financial forecasting,” Appl. Intell., vol. 36, no. 4, pp. 887– 898, 2012. W. L. Tung and C. Quek, “Financial volatility trading using a selforganising neural-fuzzy semantic network and option straddle-based approach,” Expert Syst. Appl., vol. 38, no. 5, pp. 4668–4688, 2011. P.-C. Chang, T. W. Liao, J.-J. Lin, and C.-Y. Fan, “A dynamic threshold decision system for stock trading signal detection,” Appl. Soft Comput., vol. 11, no. 5, pp. 3998–4010, 2011. X. Lin, Z. Yang, and Y. Song, “Intelligent stock trading system based on improved technical analysis and Echo State Network,” Expert Syst. Appl., vol. 38, no. 9, pp. 11347–11354, 2011. C. Wong and M. Versace, “CARTMAP: a neural network method for automated feature selection in financial time series forecasting,” Neural Comput. Appl., vol. 21, no. 5, pp. 969–977, 2012. Y.-F. Wang, “On-demand forecasting of stock prices using a real-time predictor,” IEEE Trans. Knowl. Data Eng., vol. 15, no. 4, pp. 1033– 1037, 2003.
[10] A. W. Lo, H. Mamaysky, and J. Wang, “Foundations of technical analysis: Computational algorithms, statistical inference, and empirical implementation,” J. Finance, vol. 55, no. 4, pp. 1705–1770, 2000. [11] S. Busuttil and Y. Kalnishkan, “Weighted kernel regression for predicting changing dependencies,” in European Conference on Machine Learning, 2007, pp. 535–542. [12] T. Takahashi, R. Tamada, and K. Nagasaka, “Multiple line-segments regression for stock prices and long-range forecasting system by neural network,” in SICE’98. Proceedings of the 37th SICE Annual Conference. International Session Papers, 1998, pp. 1127–1132. [13] G. E. Box, G. M. Jenkins, G. C. Reinsel, and G. M. Ljung, Time series analysis: forecasting and control. John Wiley & Sons, 2015. [14] P. Whitle, Hypothesis testing in time series analysis, vol. 4. Almqvist & Wiksells, 1951. [15] P.-F. Pai and C.-S. Lin, “A hybrid ARIMA and support vector machines model in stock price forecasting,” Omega, vol. 33, no. 6, pp. 497–505, 2005. [16] O. Valenzuela et al., “Hybridization of intelligent techniques and ARIMA models for time series prediction,” Fuzzy Sets Syst., vol. 159, no. 7, pp. 821–845, 2008. [17] F. X. Diebold and R. S. Mariano, “Comparing predictive accuracy,” J. Bus. Econ. Stat., vol. 20, no. 1, pp. 134–144, 2002. [18] R. Gencay, “Linear, non-linear and essential foreign exchange rate prediction with simple technical trading rules,” J. Int. Econ., vol. 47, no. 1, pp. 91–107, 1999. [19] T. Bollerslev, “Generalized autoregressive conditional heteroskedasticity,” J. Econom., vol. 31, no. 3, pp. 307–327, 1986. [20] D. Bao and Z. Yang, “Intelligent stock trading system by turning point confirming and probabilistic reasoning,” Expert Syst. Appl., vol. 34, no. 1, pp. 620–627, 2008. [21] P.-F. Pai, “System reliability forecasting by support vector machines with genetic algorithms,” Math. Comput. Model., vol. 43, no. 3, pp. 262–274, 2006. [22] R. Raina, A. Madhavan, and A. Y. Ng, “Large-scale deep unsupervised learning using graphics processors,” in Proceedings of the 26th annual international conference on machine learning, 2009, pp. 873–880. [23] L. Deng, D. Yu, and others, “Deep learning: methods and applications,” Found. Trends® Signal Process., vol. 7, no. 3–4, pp. 197–387, 2014. [24] Y.-K. Kwon and B.-R. Moon, “A hybrid neurogenetic approach for stock forecasting,” IEEE Trans. Neural Netw., vol. 18, no. 3, pp. 851– 864, 2007. [25] P.-C. Chang, C.-H. Liu, J.-L. Lin, C.-Y. Fan, and C. S. Ng, “A neural network with a case based dynamic window for stock trading prediction,” Expert Syst. Appl., vol. 36, no. 3, pp. 6889–6898, 2009. [26] T. Chavarnakul and D. Enke, “Intelligent technical analysis based equivolume charting for stock trading using neural networks,” Expert Syst. Appl., vol. 34, no. 2, pp. 1004–1017, 2008. [27] W. Leigh, R. Hightower, and N. Modani, “Forecasting the New York stock exchange composite index with past price and interest rate on condition of volume spike,” Expert Syst. Appl., vol. 28, no. 1, pp. 1–8, 2005. [28] E. Keogh, K. Chakrabarti, M. Pazzani, and S. Mehrotra, “Dimensionality reduction for fast similarity search in large time series databases,” Knowl. Inf. Syst., vol. 3, no. 3, pp. 263–286, 2001. [29] A. Graves and J. Schmidhuber, “Framewise phoneme classification with bidirectional LSTM and other neural network architectures,” Neural Netw., vol. 18, no. 5, pp. 602–610, 2005. [30] A. Graves, “Generating sequences with recurrent neural networks,” ArXiv Prepr. ArXiv13080850, 2013. [31] S. Hochreiter and J. Schmidhuber, “Long short-term memory,” Neural Comput., vol. 9, no. 8, pp. 1735–1780, 1997. [32] F. A. Gers, N. N. Schraudolph, and J. Schmidhuber, “Learning precise timing with LSTM recurrent networks,” J. Mach. Learn. Res., vol. 3, no. Aug, pp. 115–143, 2002. [33] S. Hochreiter, Y. Bengio, P. Frasconi, and J. Schmidhuber, Gradient flow in recurrent nets: the difficulty of learning long-term dependencies. A field guide to dynamical recurrent neural networks. IEEE Press, 2001. [34] “Deeplearning4j: Open-source, Distributed Deep Learning for the JVM.” [Online]. Available: https://deeplearning4j.org/. [Accessed: 09-Mar2017].
122