A Desktop Virtual Reality Application for Chemical and Process Engineering Education Elin Abdul Rahim1, Andreas Duenser2, Mark Billinghurst2, Alfred Herritsch3, Keith Unsworth1, Alan Mckinnon1, Peter Gostomski3 1 Dept. of Applied Computing, PO Box 84, Lincoln University, Lincoln 7647, Canterbury, NZ {2 HITLab NZ, 3Department of Chemical and Process Engineering}University of Canterbury, Private Bag 4800, Christchurch 8140, New Zealand
[email protected], {andreas.duenser, mark.billinghurst}@hitlabnz.org, {keith.unsworth, alan.McKinnon}@lincoln.ac.nz, {peter.gostomski, alfred.herritch}@canterbury.ac.nz} ABSTRACT
apply the theory to real-world scenarios.
A desktop Virtual Reality (VR) application of a skim milk powder process has been developed. The goal was to use this application as a learning resource to expose students to processing plant environments, which are becoming increasingly difficult to visit due to availability and safety reasons. The VR application comprises 360o panorama images of the milk powder process plant, process flow diagrams (PFD), piping and instrumentation diagrams (P&ID), 3D drawings and additional materials such as supplemental text, videos and animations. This paper describes the VR application as well as an evaluation of the application. The results of this study show that the application was easy to use and the users were satisfied with it. The design recommendations for the development of similar VR learning applications are also discussed in this paper.
As a consequence, a desktop Virtual Reality (VR) application was developed by the Department of Chemical and Process Engineering (CAPE) at University of Canterbury and HIT Lab NZ to be integrated into the teaching program. The development of the VR application is based on a working milk powder production plant, which is a large scale and compact plant containing a diverse range of process units (Herritsch et al., 2011). This VR application is similar to the BP Refinery VR application (Cameron, Crosthwaite, Donaldson, Samsudi, & Fry, 2005), however in our application we include the intergration between the information and the 3D models of the respective areas in the process plant. BACKGROUND
The use of VR in education is not new. In chemical engineering education, one of the early VR applications is known as Vicher (Virtual Chemical Reaction Module) which was developed based on 3D computer generated graphics (Bell & Fogler, 2004). This VR application allows users to explore virtual plants and be exposed to simulated accidents.
Author Keywords
Educational software, evaluation, usability.
engineering,
virtual
reality,
ACM Classification Keywords
H5.2 Information interfaces and presentation (e.g.,HCI): User Interfaces – Evaluation/Methodology INTRODUCTION
Other VR applications such as TAPS (TechnologyAssisted Problem Solving) (Sidhu & Singh, 2008), ViRILE (Virtual Reality Interactive Learning Environment) (Schofield, 2010) and the distillation virtual laboratory (Rafael et. al., 2007) provide students with simulations where they can perform experiments using VR applications. For instance, in ViRILE (Schofield, 2010), students perform experiments with a virtual absorption column - such as controlling the air, ammonia and liquid that enter the packed column.
Current practices in tertiary education encourage students to learn in the real world in addition to traditional textbooks and lectures. This approach is adopted by engineering disciplines such as chemical and process engineering through student visits to process facilities. The exposure and familiarity with real-world engineering issues are essential to engineering graduates (Chanson, 2003). Often, students have limited opportunities for field trips due to issues with providing on-site access to industrial sites due to availability, safety reasons, weather and time constraints, cost, etc. Therefore, students may not be able to gain sufficient insight into the operational issues of process engineering which may make it more difficult for them to understand engineering concepts and
Using a VR application to supplement the learning materials in class has its own advantages. Apart from providing students with access to various locations that may not be accessible in the physical world due to safety, economic or logistical reasons (Bell & Fogler, 1996), the application also provides students with the ability to use the application at their own pace (Ku, Goh, & Ahfock, 2011). It can also expose them to experiences which are not available in the physical world (e.g.: looking into a heat exchanger) and provide the students with a virtual field trip experience. In addition, the VR applications
Permission to make digital or hard copies of all or part of this work for personal or classroom use is granted without fee provided that copies are not made or distributed for profit or commercial advantage and that copies bear this notice and the full citation on the first page. To copy otherwise, or republish, to post on servers or to redistribute to lists, requires prior specific permission and/or a fee. OZCHI’12, November 26–30, 2012, Melbourne, Victoria, Australia. Copyright 2012 ACM 978-1-4503-1438-1/12/11…$10.00.
1
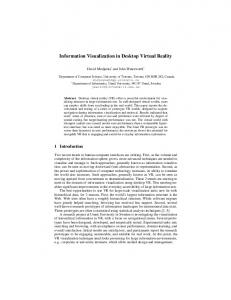
The arrows allow the user to move sequentially through the milk processing steps.
A button to display the current P&ID.
Buttons to display the panel as a larger proportion of the screen.
Info Panel
Pano Viewer
Process Flow Diagram
3D Map
Clicking on the camera symbols will move the user to the specified location.
This green highlighted camera symbol indicates the current position in the panorama images.
A slider to rotate the 3D map.
Figure 1 Four different panels displayed on the screen.
have the capabilities to integrate information in various formats such as videos, animation, 3D drawings, etc. making it more interesting and enjoyable to use.
BP Refinery VR application (Cameron et al., 2005) and TAPS (Sidhu & Singh, 2008) where information is presented in a single window. The ViRILE (Schofield, 2010) software uses two panels where the virtual environment (VE) is presented in one panel and the related information (i.e.: descriptive, photographic, diagrammatic and mathematical information) is presented in the other.
Studies related to the use of VR applications have provided positive results. It was found to promote better learning outcomes among students (Chang, Lin, & Hsiao, 2009) and the students also perceived it as useful (Rasteiro et al., 2009). When VR applications are used as virtual field trips (VFTs), Lesley and Michael (2005) and Lewis (2008) found no significant difference in the learning achievements of the students when comparing the physical and virtual field trips. Therefore, they suggest that a VFT could be used as an adequate replacement when a physical field trip is not available. In other studies, students felt VR training was an ideal preparation tool for physical field trips (Arrowsmith, Counihan, & McGreevy, 2005; Chang et al., 2009; Spicer & Stratford, 2001).
The inclusion of four different panels is based on the multiple representations principle (explanation based on the combination of words and pictures is more effective than explanation in either words or pictures only) and the contiguity principle (better learning can take place when the words and pictures are presented together instead of separately) (Mayer, 1997). This feature would allow users to relate information in each panel to assist them with understanding the learning content. Details of the VR application are presented in a later section.
One of the missing elements in these VR applications is the integration and connection of information, such as displaying the PFD simultaneously while the users are navigating the 360o panoramic view. In engineering, the PFD is an important component as it represents a chemical process at a conceptual level (Becker, Haase, Westfechtel, & Wilhelms, 2002). Therefore, the integration of the PFD and other information could assist users in gaining a deeper understanding of the process.
RESEARCH AIM
This study aims to determine usability issues with the desktop VR application and to assess the users’ perceptions of the application. The comments and suggestions received will be used as the basis for further enhancements of the VR application. The study also should provide insights that will be useful for people developing desktop VR training applications in general.
The absence of this aspect motivates the development of the VR application in this paper. A unique feature of our VR application is the presentation and integration of information in four panels (see Figure 1). This feature makes it different from other VR applications such as the
THE VR APPLICATION
The development of the VR application is discussed in (Herritsch et al., 2011). It is based on a milk powder production facility, which is capable of producing milk
2
powder with a market value of NZ$ 1m dollars per day. Due to its large scale, compact nature, and the diversity of process units involved, this facility is an ideal candidate for a virtual learning environment.
Figure 3 where the ‘Pano Viewer’ panel is displayed in half screen. Hotspots (highlighted area of interest) are also included in the VR application (Figure 3). For example, when the user hovers the cursor over the blue coloured text in the ‘Info Panel’ (in this example, the ‘holding tubes’), an image of the holding tubes in the ‘Pano Viewer’ panel is highlighted in green.
The information is presented in four panels: ‘Info Panel’, ‘Pano Viewer’, ‘Process Flow Diagram’ and ‘3D map’ (Figure 1). The ‘Info Panel’ (the top left panel) contains text information related to a process, the ‘Pano Viewer’ (the top right panel) contains 360o panorama images of the process plant, the ‘Process Flow Diagram’ (the bottom left panel) is a diagram of the entire milk powder production process and the ‘3D map’ (the bottom right panel) displays a 3D model of the related area in the plant. The 3D model can be rotated to allow users to view it from different angles. The information in the panels is linked together allowing users to relate the content in each panel. For example, Figure 1 displays the information for the ‘Drier’. The current location of the user in the drier area is shown in the PFD and the 3D map by green highlighted camera symbol.
Figure 3 The hotspots and the ‘Pano Viewer’ panel displayed in half screen.
The arrows at the top of the Info Panel allow users to take a tour through the processing of the milk in sequence from the tanker reception to the packaging area. Thus it provides users with a guided tour of the process plant. Users can also move to a specific location by clicking on the camera symbols available in the PFD (Figure 1).
At certain points, clicking on the blue coloured text will display a pop-up window that contains additional information including videos and animations (Figure 4).
On top of the ‘Info Panel’ is a button that enables display of the current P&ID. Understanding of this display requires the most process engineering knowledge and is therefore presented by itself. Options to display the selected P&ID.
Options to display the respective process streams.
Figure 4 The pop-up window that displays the additional information related to the respective unit operation. USABILITY EVALUATION
As with any computer software, it is essential to assess the usability of the VR application before it can be used by students as a learning resources. A usable system means it is easy to learn, easy to remember, efficient and pleasant to use, and easy to recover from mistakes so that users are satisfied when using it (Nielsen, 1994). A usability test is crucial to avoid any usability issues that would lead to frustrations among users.
A list of ‘instruments symbols’ buttons. Figure 2 The interactive piping and instrumentation diagram (P&ID).
In the P&ID (Figure 2), users have options to select the P&ID to be displayed from the drop down menu and also options to display the respective process streams via checkboxes. A list of ‘instrument symbols’ buttons on the right displays detailed information of the respective instruments in a pop-up window.
We evaluated the usability of our interface using the procedure described below. Participants
Eight students (3 males and 5 females) were recruited. Four of them were first year students and the remaining four were final year students. None of them had any prior experience in the immersive VR (e.g.: cave automatic virtual environment (CAVE), flight simulator, etc.). As
At the top right of the display window is a set of buttons ( ) that allows the panels to be displayed using a larger area of the screen. An example of this is shown in
3
RESULTS
for the non-immersive VR, two had experience in nonimmersive VR (e.g.: a desktop virtual tour of a museum) ranging from once a month to a few times a month, and the remaining six did not have any.
Participants took from 7 to 14 minutes to complete the task list. Five of them could perform each task without referring to the user manual. Three participants referred to the manual for the following tasks:
Procedure
x x x x
The participants were briefed about the procedure for the session. Practise session
The first part was a practise session in which the participants were asked to learn how to use the VR application from a printed user manual. No demonstration was given, as they were expected to be able to navigate based on the information provided in the user manual. However, they were allowed to ask questions during the session.
To navigate in process sequence. To change the size of the 3D map panel. To display the process streams of the P&ID. To display the detailed PFD.
The USE Questionnaire
Table 1 shows the median and the frequency for the statements in the USE questionnaire, as stated by all eight participants. Statements
Navigation Session
Once the participants had completed the practise session, they were asked to complete a set of prescribed tasks which covered most available features in the VR application. They were allowed to refer to the user manual while performing the tasks. The tasks included:
1
x
3
x x x x
2
Manipulating the panel size (e.g.: expanding the panel size). Navigating in process sequence. Moving to a specific area in the virtual environment. Displaying the PFD and P&ID, including the components in the P&ID. Displaying additional information available from the text information in the Info Panel.
4 5 6 7
There was no time limit for the practise and the navigation sessions. The participants were asked to ‘think aloud’ while performing the tasks and they were observed throughout the study. Notes on any issues or comments were taken throughout the study.
8 9
6.5 4
Frequency (n = 8) 1 2 3 4 5 6 7 - - - 1 1 2 4 1 2 1 -
1 1 2
5.5
-
-
-
2 2 2 2
6.5
-
-
-
-
2 2 4
7
-
-
-
-
1 2 5
6.5
-
-
-
2 1 1 4
7
-
-
-
-
7
-
-
-
1 -
6
-
-
-
1 2 3 2
1 2 5 2 5
Table 1 The frequency of statements in the USE questionnaire; 1 = Strongly Disagree to 7 = Strongly Agree.
Questionnaires
The majority of the participants generally agreed with all statements except for statement ‘I can use it without written instructions’, where they had split opinions on this statement. Of the four participants who disagreed with the statement, one used the user manual during both the practise session and navigation session (for some of the tasks), two referred to the user manual during the practise session but not during the navigation session and the remaining one participant did not use the user manual during the practise session but referred to it when performing one of the tasks in the navigation session.
After the tasks were completed, the participants were asked to complete an adapted version of the USE questionnaire (Lund, 2001), in which statements not relevant to this study were excluded. The participants were required to state their levels of agreement with statements relating to their experience using the VR application. The level of agreement was on a scale from 1 = Strongly Disagree to 7 = Strongly Agree. These statements were related to: x x x
It is easy to use. I can use it without written instructions. I don't notice any inconsistencies as I use it. I can recover from mistakes quickly and easily. I learned to use it quickly. I easily remember how to use it. I am satisfied with it. It is fun to use. It works the way I want it to work.
Mdn
Ease of Use Ease of Learning Satisfaction
In terms of ease of use, seven participants agreed with this and the remaining one had a neutral opinion. This is supported by the responses received from all eight participants to the statements ‘I learned to use it quickly and ‘I am satisfied with it’ being at the agreement end of the scale.
Interview
Finally, there was a short interview session where the participants were asked to identify the features they liked and liked least about the VR application. They were also asked if they had any recommendations regarding the VR application.
For further analysis, these statements were grouped into three categories; Ease of Use (statements 1 to 4), Ease of Learning (statements 5 and 6) and Satisfaction (statements 7 to 9) as they appeared in (Lund, 2001). All
4
provide connections with the panorama images, "I like it when it is blue coloured here (panorama images) and how it is also coloured in blue here (pointed to the pump in the 3D map) (and that) made it easier to connect both of them” (P5).
three categories show relatively high median values: Ease of Use (Mdn = 5.8), Ease of Learning (Mdn = 6.5), and Satisfaction (Mdn = 6.5). Features Liked
The participants stated more than one feature that they liked. The responses were grouped into similar themes and sub-themes. This resulted in three main themes which are described below: x
Ease of Use – referring to the comments made by the participants relating to how the VR application could be used without difficulty.
x
User Interface – referring to the presentation of the VR application which includes components such as the diagrams, hotspots, etc.
x
One of the three participants who liked the diagram stated that the PFD is really good and s/he liked the display of the respective streams in the P&ID, “PFD is really good. I like how you can highlight the respective streams you want to see (the vacuum stream) in the P&ID" (P8). Others commented that the process streams in the P&ID were not cluttered; they made it easy to see the flow. In addition, the colour indications were clear. The list of ‘instrument symbols’ buttons available in the P&ID display was considered particularly useful by one participant, as it showed symbols which were specifically used for different types of pumps in the design process and the detailed information associated with it. This is important as during class they only learn about general symbols and pumps.
Informative Contents – referring to educational aspects of the VR application.
Ease of Use
Six of the eight participant liked the VR application because it was easy to use. One of them stated that the common symbols used in the VR application made it easy to navigate, “It is easy to navigate because it uses common symbols; some of it is similar to MATLAB. It is very simple and you understand what you have to do. This is like the Google street map” (P7). Another added, "You don't feel like you need to refer to the user manual when you have to do something…just click on a few buttons to find out. Easy to navigate, I quite like that" (P4).
Two participants commented that the panorama images provided them with an overview of how things are placed in the plant, “The actual photos (panorama images) are very useful. They give a sense of where everything is, how it interacts. I like it because I can look it up (in the panorama images)” (P8). The additional information in the pop-up windows relating to equipment in the plant appealed to two participants. One of them stated that it was informative, “Pop-up windows are good. There is a lot of information and these diagrams are pretty cool. It shows the explicit part of the pumps. We have one lab with technical part of a pump, so this is cool as we could see all sorts of pumps and things and play with it. " (P4).
User Interface
‘Ease of use’ is closely related to having four different panels (‘Info Panel’, ‘Pano Viewer’, ‘Process Flow Diagram’ and ‘3D Map’) displayed on one screen, as it allows the participants to move from one area to the other easily, as stated by one participant, “When it is like this (referring to the 4 panels), it is easy to understand the process and easy to access. The links between each item makes it easy to go anywhere from here and easy to understand the process” (P2). Five participants liked this feature. One of them commented that the four-panel display was intuitive.
Informative Contents
Four participants stated the information available in the VR application as the feature they liked in the VR application. One of them stated that the VR application provided them with features that are not available in class, “.....we see images and stuff in the class...but it is hard to see how the equipment interacts with each other because you only see the individual equipment” (P8).
With regard to other features of the user interface; five participants liked the hotspots, three liked the 3D map, three liked the diagrams available in the VR application, two liked the pop-up window which displays additional equipment information, two liked the 360o panorama images in the ‘Pano Viewer’ and one liked the features that allow a tour in sequence. The hotspots feature was particularly attractive to some participants as they were observed to hover the cursor repeatedly over the text information in the ‘Info Panel’ so they could see more of the ‘hotspots’.
Some pointed out that the tanker reception at the beginning was useful as they had only been taught about the main part of milk processing instead of the bigger picture such as how the raw milk is transferred. Some participants also found that the VR application was useful for their design projects and as preparation for lab work. Features Liked Least
When asked what they liked least about the VR application, half of the participants could not point out anything and one added, “there is nothing that I would like to do that I was unable to do" (P4). This suggests that they were satisfied with the VR application.
One of the three participants who liked the 3D map commented that it provides them with a sense of scale, “I think it is good that you get the sense of what it looks like as well, as just having the CAD drawing is good to have sense of how big it is” (P7), and its colours helped to distinguish between different parts of milk processing and
Of the remaining participants, one stated that the VR application was fine but as a user of touch screens, s/he had a tendency to drag the panorama images to the left when s/he wanted to move to the right. Two more 5
participants stated that the navigation speed was a bit fast which made them feel a bit dizzy during the navigation. The remaining participant pointed out that the content of the VR application is too specific "Only in milk processing, so it is quite specific, but that is good too, because you have information about particular equipment like evaporators which are also used in other plants" (P5).
application and only stopped when s/he reached the last node. Overall, the observations throughout the practise session suggested that participants were not having trouble using the VR application, with or without referring to the user manual. During the trial, some minor issues were observed on certain tasks. One of these was the task that required the participants to move in sequence to a specific location. The first participant (P1) did not realise that the arrows in the ‘Info Panel’ allowed him/her to do this. Since this occurred in the first session, immediate changes were made to the user manual with notes related to the arrows added to it. As a result this did not occur with the remaining participants.
Overall, the concerns highlighted by the participants could be classified as navigation speed, navigation style and content. Suggestions for improvements
Few suggestions were given by the participants when they were asked for any recommendations to improve the VR software. All suggestions were related to the design of the VR application interface and mostly related to the 3D map such as adding a radar to the map to show the direction the users are facing, putting a legend explaining the different colours available in the 3D map and to add arrows to show the connections between the processes in the 3D map. Another suggestion was to have the hotspots displaying the name of the equipment when the cursor hovers over it.
In another task in which required the participants to go to the vacuum pump area via the PFD, two participants were seen clicking on the images of the vacuum pump (in the PFD) before realising they should click on the camera symbols. However, both participants managed to click on the camera symbols themselves without referring to the manual. Therefore this was considered a minor issue as it did not take long before they realised that they needed to click on the camera symbols.
OBSERVATIONS AND PARTICIPANTS’ COMMENTS
This section describes the observations made regarding the participants’ behaviour, and their comments during the practise and navigation sessions.
Two first year students were confused when they were asked to display the P&ID as they had not learnt about P&IDs. One of them asked “what is P&ID?” (P2) when the question was read. This issue was not related to the VR application but more to the students’ lack of content relevant knowledge at that point in their education.
During the practise session, it was observed that seven of the eight participants referred to the manual. Of these seven participants, five referred to the manual while using the VR application, and the remaining two only referred to the manual halfway through the session. These seven participants (who referred to the manual) took from 4 to 12 minutes to practice using the VR application. None of them asked questions during the practise session. One of them commented that the user manual was helpful and easy to understand.
The results indicate that most participants could perform the task without referring to the manual. This suggests that the VR software is intuitive and easy to use and participants could use it with just a little practise. Overall, the majority of the participants provided positive comments throughout the sessions. DISCUSSIONS AND CONCLUSIONS
Another participant became quite excited when exploring the application. This participant (who only referred to the manual in the middle of the practise session) liked the hotspots feature, “I just went through and clicked all the environment (referring to the different panels on the screen). … I got a bit excited and jumped into it. Now I refer to it (the user manual) and I realise I can see this (referring to the hotspots). I like this feature, now I know how the pump looks like. It is pretty easy; I can identify and see what they are used for " (P4).
The aim of this study was to determine potential usability issues with the VR application, to assess the users’ perceptions of the VR application and to provide insights that will be useful for people developing desktop VR training applications in general. The results of this usability study show that only few usability issues were found regardless of the participants’ previous experience with VR applications. One reason is the exposure that the participants had with other software that results in familiarity with the functionalities and icons (e.g.: the buttons used to change the size of the panels used in the VR application).
The remaining participant, who did not refer to the user manual, took 31 minutes to complete the practise session. The reason for a longer practise time was not due to any difficulties in navigating the software but due to the participant’s level of interest in the content of the VR application. S/he was observed looking very focused and visited all the available nodes. Although the participant was reminded that the goal of the study was to test the usability and that users would not be tested of the content of the software, s/he continued exploring the VR software with great interest, taking time to explore the VR
The inclusion of the four panels, which is a unique feature of this VR application, was considered by the participants as one of the main contributors to the ease of use, as participants were aware of the different information described in each panel, including the process flow. The links between each panel not only provided them with ease of using the VR application but it also helped them to get a better understanding of the processing of milk
6
x
powder. This suggests that the information that is connected to each other must be made visible to users and using multiple panels is one way of doing this.
The interactive elements in the VR application (e.g.: 360o panorama images, PFD and P&ID) were mentioned as useful as they allow users to engage with the related content information, presented in different formats. It also allows users the ability to learn at their own pace as they had control over what they do or do not want to see (e.g.: displaying the respective streams in the P&ID).
Different levels of engagement with the VR application were found among the students. The final year students exhibited a higher level of engagement compared to the first year students, which may be due to the fact that first year students had not previously been exposed to some of the content (e.g.: the P&ID) at that point of their education. This also suggests that the level of content detail needs to be altered when used with students in different years of their studies.
x
x
Common navigation symbols
The use of common navigation symbols (e.g.: symbols used in MATLAB, MS Office) minimises the effort required to learn to use the application. x
The use of different colours in the 3D map and the process streams in the P&ID were found useful as participants found that colours assisted them in distinguishing between different processes. As for the hotspots, the use of bright colours (green), as recommended by Marshall and Nichols (2004), assisted users to identify items mentioned in the text information.
Navigation flexibility
Flexibility of navigation, such as guided and unguided tours, provides users with options for navigating according to their learning style and level of knowledge. FUTURE WORK
In future we will include further enhancements and also conduct further studies to assess the effectiveness of this application for teaching chemical and process engineering. We are evaluating the VR application by comparing it against the conventional learning materials and also as a medium for providing students with a virtual field trip experience.
The study also uncovered some minor usability issues such as mild simulator sickness experienced by two participants while navigating the environment and the tendency to drag the panoramic view to left (when wanting to move to the right) by one participant, who mentioned being used to touch screens.
ACKNOWLEDGMENTS
We wish to thank Tertiary Education Commission (TEC) NZ, for the project funding and also Fonterra Cooperative Group Limited and its staff for their cooperation in permitting access to the production facility.
Lessons Learned
The results of the study provide valuable input for further development of similar VR applications for training and education.
REFERENCES
Visibility of information to the users
Arrowsmith, C., Counihan, A., & McGreevy, D. (2005). Development of a multi-scaled virtual field trip for the teaching and learning of geospatial science. International Journal of Education and Development using ICT, 1(3).
This study demonstrated that having different panels with linked information displayed in a single screen (with the ability to resize each panel), helps to improve navigation and maintains the user’s awareness of the process information in each panel. This helped them to relate the available content in each panel which led to a better understanding of the learning content, as suggested by the multiple representations principle and contiguity principle (Mayer, 1997). This also offers students with the ability to connect what they learn in class to the actual process shown in the 360o panorama images. x
Pop-up window
Displaying additional information in pop-up windows allows a neat presentation of the user interface as well as keeping users connected with the screen that they are currently navigating.
It was also observed that during the practise sessions, the participants had different navigation styles. Some preferred to use the arrows to navigate in sequence with the milk processing steps while others clicked on the camera symbols in the PFD to immediately go to a specific location. This suggests that providing options for flexible navigation is a useful feature.
x
Interactivity
Bell, J. T., & Fogler, H. S. (1996). Vicher: A virtual reality based educational module for chemical reaction engineering. Computer Applications in Engineering Education, 4(4), 285-296. Bell, J. T., & Fogler, H. S. (2004, 27-31 March 2004). The application of virtual reality to (chemical engineering) education. Paper presented at the Virtual Reality, 2004. Proceedings. IEEE. Cameron, I., Crosthwaite, C., Donaldson, A., Samsudi, H., & Fry, M. (2005). An immersive learning environment for process engineering using real VR. Paper presented at the CHEMECA Conference. Chang, C. Y., Lin, M. C., & Hsiao, C. H. (2009). 3D Compound Virtual Field Trip system and its comparisons with an actual field trip. Paper
Guided text information (i.e.: hotspots)
Guided text information, such as auto highlighting the area of interest of an item referred to in the text information (e.g.: hotspots), was found to be engaging and useful to the users.
7
presented at the Ninth IEEE International Conference on Advanced Learning Technologies, 2009. ICALT 2009., Riga.
Lund, A. M. (2001). Measuring Usability with the USE Questionnaire. STC Usability SIG Newsletter, 8(2). Mayer, R. E. (1997). Multimedia learning: Are we asking the right questions? Educational psychologist, 32(1), 1-19. Rasteiro, M. G., Ferreira, L., Teixeira, J., Bernardo, F. P., Carvalho, M. G., Ferreira, A., et al. (2009). LABVIRTUAL—A virtual platform to teach chemical processes. Education for Chemical Engineers, 4(1), e9-e19. Rubin, J., & Chisnell, D. (2008). Handbook of usability testing [electronic resource] : how to plan, design, and conduct effective tests. Indianapolis, IN :: Wiley Pub. Schofield, D. (2010). Virtual Chemical Engineering: Guidelines for E-Learning in Engineering Education International Journal of Media, Technology & Lifelong Learning, 6(1). Sidhu, M. S., & Singh, R. (2008, Jul 08-11). Virtual Worlds: The Next Generation for Solving Engineering Problems. Paper presented at the 8th IEEE International Conference on Computer and Information Technology. Spicer, J. I., & Stratford, J. (2001). Student perceptions of a virtual field trip to replace a real field trip. Journal of Computer Assisted Learning, 17(4), 345-354.
Chanson, H. (2003). The Importance of Field Works in the Undergraduate Teaching of Hydraulic Engineering. Paper presented at the 30th IAHR Biennial Congress. Herritsch, A., Morison, K., Abdul Rahim, E., Duenser, A., Young, B., Fee, C., et al. (2011). Recent developments with an immersive learning tool using a milk powder production application. Paper presented at the CHEMECA 2011. Ku, H., Goh, S., & Ahfock, A. (2011). Flexible engineering degree programs with remote access laboratories in an Australian regional university known for its excellence in e-learning. Computer Applications in Engineering Education, 19(1), 1825. Lesley, C. G., & Michael, A. G. (2005). Field Trips and their Effect on Student Achievement and Attitudes: A Comparison of Physical Versus Virtual Field Trips to the Indian River Lagoon. Journal of College Science Teaching, 34(5), 14. Lewis, D. B. (2008). Can virtual field trips be substituted for real-world field trips in an eighth grade geology curriculum? Unpublished Dissertation/Thesis.
8