FOSTERING TRANSPARENCY IN POLICY DEVELOPMENT PROCESSES – A DEVELOPMENT TRANSPARENCY FRAMEWORK Research in Progress Riechert, Mathias, Institute for Research Information and Quality Assurance, Berlin, Germany,
[email protected] Quix, Christoph, Fraunhofer Institute for Applied Information Technology FIT, Sankt Augustin, Germany,
[email protected] Zarnekow, Rüdiger, Technical University of Berlin, Berlin, Germany,
[email protected]
Abstract Transparency is a well-articulated requirement in policy and project development processes. To the present time, we mostly see approaches documenting the workflow or the results of these processes, but lack a representation of the discourse which produced the results. However, the arguments which have been put forward in the development of a policy document the reasoning for the details of the policy and therefore, a representation of the discourse is an important step to increase the transparency. In the present paper, we introduce an iterative development transparency framework (DTF) integrating the transparency at the workflow and result level with approaches from argumentation visualization to provide discourse information in the form of alternatives and arguments. The framework is instantiated in a prototype to empirically evaluate the ability to improve transparency among participating and external stakeholders on the use case of the “Research Core Dataset” a nation-wide policy development project initiated by the German Council of Science and Humanities in 2013 integrating over 50 stakeholders from the German science system. The first qualitative evaluation results imply that providing the discourse information is mostly appreciated as helpful for transparency if the additional complexity can be addressed by information reduction functionality. Keywords: transparency, policy development, argumentation visualization, information visualization
1
Introduction
Although transparency has been a focus in research on the public sector since the 1940s (Herzberg, 2013), only rare cases of policy development processes offer more than the following forms of transparency on a broad scale. Firstly, information about the development workflow with process models, list of included stakeholders, or extensive textual description is provided to gain legitimation. The second form of information provided is the development’s result forming the result knowledge (i.e. the policy itself). The discussion, decision and development process between both those two knowledge forms is documented only by protocols which are often too long or time-consuming to be read by concerned parties, if at all. In addition, this type of document does not allow to retrace the links between the result artefacts and the corresponding arguments. This is particularly problematic if we consider the complex or “wicked” nature of these development processes. The term “wicked problem” has been coined by Rittel and Webber (1973) to characterize complex planning and design problems “for which no single computational formulation of the prob-
Twenty-Third European Conference on Information Systems (ECIS), Münster, Germany, 2015
Riechert et al./ Transparency in Policy Development Processes
lem is sufficient, for which different stakeholders do not even agree on what the problem really is, and for which there are no right or wrong answers, only answers that are better or worse from different points of view” (Introne, Laubacher, Olson, and Malone, 2012). Due to the high number and variety of the concerned stakeholders, finding a solution accepted by most of the stakeholders is the key strategy (Conklin and Weil, 1997). To achieve this acceptance, Kunz and Rittel (1970) introduced Issue Based Information Systems (IBIS) modeling issues, alternatives and their arguments to explicitly address the discursive nature of the decision process. We argue based on recent findings in political science and human-computer interaction studies (De Fine Licht, Naurin, Esaiasson, and Gilljam, 2014; Cramer et al., 2008), that transparency and acceptance are strongly related in policy development, especially when argumentative knowledge is provided for stakeholders affected by the policy without direct participation. To test this hypothesis for three transparency dimensions, we develop a development transparency framework (DTF). In addition, we provide a prototypical instantiation to evaluate its applicability in a case study. In our research we apply the Design Science approach introduced by Gregor and Hevner (Gregor and Hevner, 2013) and Pfeffers et al. (2007). We analyze the use case of the German “Research Core Dataset” (RCD), which was initiated in 2013 by the German Council of Science and Humanities to develop a shared set of definitions and a data model for research information about research staff, publications, third-party funding, patents, young researchers and research awards for the German science system. In the project, more than 48 different stakeholder groups are directly involved (representatives of universities, non-university research institutions, public ministries, providers of research information systems, and academic associations). To combine internal expertise with the real-word evaluation of the proposed definitions, the procedure includes a feedback round with representatives of pilot organizations, non-university research institutions, funding organizations and providers of research information systems. In preceding work it has been empirically shown that the characterization of “wicked problems” largely fits this policy development process (Riechert and Dees, 2014). Using the project meeting protocols and exploratory expert interviews, we identified the requirements of the stakeholders in the project. Our contribution is threefold. Firstly, we developed a transparency system framework, covering three dimensions of transparency - workflow, discourse and result knowledge. Secondly, we developed a prototype instantiation of this architecture. Thirdly, we evaluated the prototype’s discourse visualization alternatives qualitatively with expert interviews.
2
Related Work
As the discourse transparency is the central innovation in our proposed framework, we will focus on this area in the literature review. We identify two streams of research for advancing transparent discourse visualization. Computer Supported Argumentation Visualization (CSAV) goes back to Rittel and Webber’s characterization of wicked problems (1973) and its solution approach Issue Based Information System (IBIS) (Kunz and Rittel, 1970), which has found widespread adoption and application in present tools like Compendium (Selvin et al., 2001). There have since been published newer versions of Compendium and numerous studies on the influence of argumentation visualization on the working atmosphere in discussions (we refer to Schneider et al. (2013), Scheuer et al. (2010), and Suthers (2008) for an overview). Additionally, CSAV on the basis of IBIS has previously been employed in the areas of eGovernment and eParticpation with the goal to present argumentation information to enhance participation (Loukis and Wimmer, 2012; Loukis, Wimmer, Charalabidis, Triantafillou, and Gatautis, 2007; Renton, 2006). In e-participation research, IBIS has been used without or with minor adoptions. The resulting maps therefore are of high complexity when it comes to real world argumentation structures. Although user studies found that the argumentation maps have advantages over textual representation (Loukis and Wimmer, 2012; Renton, 2006) or pre-tests with detailed argumentation maps showed, that
Twenty-Third European Conference on Information Systems (ECIS), Münster, Germany, 2015
1
Riechert et al./ Transparency in Policy Development Processes
high graph complexity causes serious issues for graph presentation, understandability and usability, which increases the access barrier. Interestingly, the academic discourse on argumentation visualization has hitherto been largely independent of the discussion in the literature on information visualization. To reduce the high graph complexity of argumentation visualizations for providing better insights and enhancing transparency, we employ the information visualization pipeline (Mazza, 2009, p. 18), a reference model that describes how to transform data into visualizations, along with interactive visualization guidelines of Shneiderman (1996), Card et. al (1999) and evaluation criteria of Nielson (2005). To the best of our knowledge, applying information mapping to the elements of argumentation visualization has not been discussed by researchers so far. Since concise information about the argumentation is central to not only enhancing transparency but also for increasing participation, this is likely a key step for both argumentation visualization and e-participation.
3
Development Transparency System Framework
This section presents the Development Transparency Framework (DTF), which integrates the transparency perspectives discussed above in an iterative process framework. We consider it to be applicable to development processes with large and complex stakeholder compositions, i.e., policy development processes or large requirements engineering processes involving many stakeholders with different viewpoints. After the requirements for development transparency systems are derived, the architecture is discussed in section 3.2, providing the foundation for the prototype implementation in section 4.
3.1
Requirements for policy development transparency systems
As development transparency systems have not been discussed before in literature, we used an inductive requirements elicitation approach. The following requirements are derived from two separate sources. Firstly, thirteen interviews (including representatives of all major actors in the German science system) about conflicts, problems and potentials of the RCD standardization process have been analyzed employing formal content analysis (Riechert and Dees, 2014). Secondly, feedback from internal and external stakeholders in the RCD project revealed that the visualization approach used (Compendium LD) tends to be not intuitive enough to communicate the rationale of complex development processes with many issues, alternatives and arguments (in the project, 1189 nodes were modelled). Therefore, we consider the visualization quality and complexity reduction as important requirements for development transparency systems. Taken together, this results in the following requirements: Detailed presentation of the transparency perspectives: The previously identified dimensions - workflow, discourse and result transparency - are integrated in a holistic architecture and system. Evaluating visualization quality: As readability and insight strongly depend on the system’s ability to transport complex information, it is central to evaluate and iteratively improve the visualizations based on stakeholder feedback. Stakeholder-centered iterative development of the visual representation: To reflect the changing content of the development processes to provide transparency for, the development process is designed in iterative cycles. Continuous and systematic stakeholder involvement allows for integrating different information requirements of actors on different information levels and various working contexts. Complexity reduction functionality: As both discourse and result knowledge documented in the aforementioned tools reached a complexity that human perception is reportedly unable to process, complexity reduction functionality is central for providing transparency. Information explication strategy: Since collecting and explicating knowledge in the form of argumentation and results is central for enhancing transparency (De Fine Licht et al., 2014), we document the argumentation during the project meetings with the help of argumentation maps.
Twenty-Third European Conference on Information Systems (ECIS), Münster, Germany, 2015
2
Riechert et al./ Transparency in Policy Development Processes
Versioning of the contents: To ensure transparency, a versioning system is required to allow for traceability and transparency in the evolution of the result artefacts.
3.2
Framework components
Adapting the basic iterative structure of the SCRUM model (Schwaber, 1995), we introduce the DTF as depicted in Figure 1. At the beginning, the workflow is determined in the planning process of this iteration. During the discussion about the roadmap and the stakeholders to be involved, the respective information are collected, modelled and transferred into a visual and textual representation. Then, the discourse knowledge cycle brings together the stakeholders as specified in the workflow model to discuss and define the development contents with visual and moderation support. This allows the parallel collection of discourse knowledge along with the benefits slowing down, depersonalization of conflict, and flexible review discussed in the argumentation visualization literature (Shum et al., 2006). The modeling, transformation, and visualization are described in more detail in section 4.
Figure 1:
Development Transparency Framework
Please note that the iteration cycle does not imply a strict sequence of the three phases, as a tight interlocking of the discourse and result cycles can be of value for both phases. However, this requires an integrated change management to limit the organizational overhead for maintaining the results. For the long-term development process new iterations for all three cycles can be added as required; changes in the workflow are possible at the first cycle of each iteration.
4
Prototypical architecture instantiation
In this section, we show an example instantiation of the DTF, focusing on the discourse and result knowledge cycles.
4.1
Workflow cycle
Information collection: The RCD development process has been designed and discussed in a working group of the German Council of Science and Humanities and was published in the form of a policy recommendation in 2013 (Wissenschaftsrat, 2013). In the project implementation phase, further refinement of the project operationalization led to the inclusion of additional information about the stakeholders to be included, as well as the project group’s working steps and processes. Data modeling: We modeled the workflow and actor information (Wissenschaftsrat, 2013) using the yED Graph editor, to allow for SVG output and later processing in the prototype. Transformation: The graph information is contextualized with actor information and links. Visualization: The visual representation is implemented as a web frontend, visualizing the workflow in an interlinked pane with zoom and pan functionality.
Twenty-Third European Conference on Information Systems (ECIS), Münster, Germany, 2015
3
Riechert et al./ Transparency in Policy Development Processes
4.2
Discourse cycle
Information collection: We collected the discourse knowledge in the form of meetings protocols and discourse hierarchy tree in Compendium LD (using the IBIS notation), which allows for fast and intuitive graph editing, tagging and export of argumentative models. Both span over 80 hours of discussion time in 7 meetings plus external feedback on alternative definitions. The resulting network graph structure amounts to over 1189 nodes collected (including 614 arguments), rendering the provided visualization of Compendium LD not suitable for transparency presentation. Data modeling: The data modeling was done both during the discussion meetings and in the subsequent reviewing of the protocol. To reduce model complexity, we adapted the IBIS notation and introduced shared semantics 1 for the modeling process. Transformation: To reduce the complexity, we draw on the information visualization literature (Bederson and Shneiderman, 2003; Mazza, 2009; 1996). To allow for content aggregation, we add a semantic layer mapping the discourse hierarchy tree to the definition elements. This step is computed separately based on the XML output of Compendium in a separate transformation program generating JSON data for web-based presentation. Due to the high formalization of the data model, generating automated tables representing the recent discussion progress is possible in the same step.
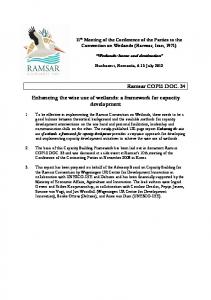
Figure 2:
Visual Representation of Discourse Knowledge. Overview (upper left) and Detail (upper right) of the circle Visualization, Tree visualization (below)2
Visualization: As our Compendium maps are on a rather detailed level (1189 nodes in 8 sub-maps including 614 arguments) the experts in the project group reported that the visualizations provided by compendium were not sufficient for providing insights into the underlying argumentation complexity. Therefore we used an exploratory approach by developing a visual representation of the argumentation in two different layouts: a hierarchical tree map and a packed circle map (Figure 2). Packed circle maps were developed by Wang et al. in 2006 to provide clear overview over complex hierarchical
1
This semantics and formal language will be discussed in detail in a separate article which is in preparation. The basic principle is outlined in Appendix 1. 2
The color indicates the state of the discussion (green – accepted for the policy, red – not accepted, orange – extensional elements, violet – optional). On the more detailed level, alternatives are depicted as additional circles around the core element and arguments are added as circle segments around the focus element.
Twenty-Third European Conference on Information Systems (ECIS), Münster, Germany, 2015
4
Riechert et al./ Transparency in Policy Development Processes
structures and has shown to be beneficial in first evaluations (2006). We extend this approach with interactive zooming level to reduce the high argumentation complexity (the larger the circles the more differentiated the elements). Secondly, we implemented a tree structure that is closer to other visual forms that stakeholders are already used to (for example in Windows Explorer) as a benchmark. For both visualizations best practices from information visualization were implemented: they both provide initial and aggregated overview, zoom and pan, focus and highlighting functionality and detailed contextual information on demand. A detailed discussion of the decisions on functionality implementation and their advantages is provided in Appendix 2. Additionally, a linked interaction concept was implemented, that allows for changing the visualization perspective from process transparency (the workflow of the project), transparency in rationale (the argumentation and alternatives of the content specification) and result transparency (the resulting data model). The same information is also available in an interlinked table, to provide a text-only printable form of the argumentation. The prototype is implemented in Javascript using the D3 and JQuery libraries, to allow web-interaction for concerned stakeholders without further installations.
4.3
Result cycle
Information collection: The data elements that have been discussed in the discourse knowledge cycle were organized in an “informal” data model to assist in the moderation of the discussions and to provide a structured overview for the participants. One goal of the RCD project is to enable exchange of research information (e.g., between research institutions and funding organizations). This data exchange requires a formal data model in which the data structures are clearly defined in terms of syntax and semantics. Within the RCD project, a two-step modeling process is applied which follows the classical approach of conceptual and logical data modeling. The main input for the conceptual modeling was the output of the discourse cycle, i.e., textual definitions of data elements which were organized in an informal structure. In addition, other data models that have been proposed for research information have been also considered as input (CERIF - http://www.eurocris.org/). Data modeling: The conceptual modeling is done using OWL (www.w3.org/owl). The main reasons for the choice of OWL were the availability of a standard and the support by various modeling tools. As the discourse visualizations with reduced complexity were not available at the time of the initial modeling, the conceptual modeling was based mainly on the tables in Word or HTML. In addition, the complex graph representations of Compendium were used to get an overview of the data elements. An interactive tree visualization as shown in Figure 2 might also have proven helpful for the modeling. An important aspect for the verification of the conceptual data model is its linkage to the discourse information. As the data model needs to cover the definitions completely, it is useful to have a formal link from the conceptual data model in OWL to the discussed elements in the discourse cycle. We establish this link by using annotation properties in OWL which point to the IDs that have been used in the discussion phase. The logical modeling is based on XML schema which will be also linked to the conceptual model using annotations. Transformation: After a first discussion of the initial conceptual model, a reduction of the complexity was necessary to increase readability. Initially, we used a visualization similar to UML class diagrams, which turned out to be inappropriate because the diagrams were either too complex or the details of the model could not be represented. Therefore, we reduced the model complexity by removing all modeling constructs which are not necessary for the purpose of the conceptual model (provide a formal, structured representation of the defined data elements and a basis for the logical model). Visualization: We developed an interactive visualization of the model using a JSON representation of the model for the dynamic generation of HTML pages. The visualization focuses on the main aspects, i.e., the class hierarchy, properties of classes, and relationships. To enable further evaluation of the interactive visualization, we added functionality to provide comments on data elements. Furthermore, we integrated the textual definitions of the discourse cycle into this visualization.
Twenty-Third European Conference on Information Systems (ECIS), Münster, Germany, 2015
5
Riechert et al./ Transparency in Policy Development Processes
5
Evaluation
We focus on visualizing the discourse dimension first, because the combination of best-practices in information visualization and argumentation visualization represents an innovative approach for providing concerned stakeholders with the relevant information. The evaluation is based on the requirements identified in section 3.1. It is conducted in parallel to the implementation. We use formal content analysis (Friedrichs, 1990; Mayring, 2010) to examine the intuitiveness, information presentation, information coding, and information depth of the implementation to assess the visualization quality. The sampling of the seven interviewees covers experts participating in the policy development process (3 interviewees) and non-participating concerned parties (4). Further criteria were the type of expertise: practical expertise (4) and theoretical visualization expertise (3). Finally, the employment level was considered: management (4) and operational (3). The coding procedure included two coders that worked in parallel and independently from one another. It followed the inductive steps for formal category building specified by Mayring (2010). Table 1 shows the evaluation results in aggregated form (details in Appendix 3). The numbers show the number of statements concerning the circle and tree layout for or against the criteria on the left. Additionally, the possibility of adding alternatives and arguments was evaluated (third column), as it is an additional requirement when visualizing argumentation compared to existing information visualization approaches.
Table 1: Qualitative Evaluation of the Argumentation Visualization The circle layout was evaluated positive in 22 statements, and negatively in 13 statements, resulting in two thirds of the statements being evaluated positively. Although the interviewees stated, that this visualization is best suited to give an overview of the discussion and is visually appealing, the main problems concern the integration of readable text and high requirements towards information perception. Interestingly, the tree structure, which is closer to what stakeholders are already used to, was less often referred to by the interviewees, with 12 statements and 3 negative statements. It is easier to navigate backwards and is more suitable for self-information, but becomes problematic on detailed level, which requires many more pixels to provide the same information than the circle layout. Additionally, we asked the interviewees to evaluate alternatives and arguments in both visualization layouts based on the same criteria. In the interviews, the visualization of alternatives and arguments was evaluated positive in 12 statements and 6 statements. Overall, two third of the statements rated the provision of argumentations in the visualization as beneficial. The main problems identified refer to increased complexity and the non-applicability to all stakeholders. The criteria differentiation indicates that the circle layout is better suited for applications with a high information depth, while the tree layout seems to provide a more intuitive way of accessing information. This may be caused by this visualization being similar to known tools like Windows Explorer. Regarding this exploratory findings, providing additional alternatives and arguments is seen beneficial as it increases the information depth and presentation, but comes at the cost of higher information coding, which results in a higher cognitive barrier for users. Limitations: Due to the exploratory stage, the qualitative evaluation is used for iteratively improving the prototype while testing evaluation criteria from information visualization. The number of expert interviews does not allow for generalizations of the results (especially on intra-criteria level), but provide first exploratory evidence on how the visualization can be improved and which evaluation dimensions are meaningful for evaluation.
Twenty-Third European Conference on Information Systems (ECIS), Münster, Germany, 2015
6
Riechert et al./ Transparency in Policy Development Processes
6
Conclusions and future Work
The first results suggest that stakeholders integrated in the project as well as external stakeholders regard the provision of additional information about development processes mainly beneficial if the higher complexity can be reduced and made accessible in a transparency information system. In the presented prototype, the principles of information visualization were successfully applied to argumentation visualization. By using an iterative approach, the interviews generated a highly detailed and context-specific list of solution approaches for the identified problems and highlighted additional functionalities which are included in the further development process. To the present time, the evaluation is focused on the argumentative visualization. Based on the small sample, the results cannot be generalized, but provide exploratory insights to potentials and problems of the analyzed forms of visualizations. The statements imply that controlling target stakeholders and their visualization experience are important factors in further transparency analysis. Due to organizational constraints, the temporal dimension has not been included in the present prototype. Especially for the scientific use of transparency systems, it is not only important to know that some argument is emerging but also when it occurs. Although this information may be highly interesting, this results in much higher visual and usability complexity – thus we did not analyze this aspect so far. The presented development transparency framework also offers a research framework for analyzing and comparing the component’s ability to provide transparency for the different stakeholder groups. In future work, we will use this research framework to apply methods of triangulation to analyze the ability of different forms of transparency to provide insights into the respective development processes. For that, we plan to broaden the qualitative evaluation of the visualization by incorporating evaluation criteria for information visualization based on Forsell’s (2010) heuristic criteria set with a higher number of expert interviews. The qualitative expert interviews will be followed- by a larger quantitative user study, to assess not only visualization quality but also the influence of the stakeholder group, the impact of the stakeholder’s functional and hierarchical status, the effects of familiarity with information visualization and the type of transparency provided (this will also include the original protocols and Compendium argumentation maps) on the perceived transparency of the users. Additionally, the requirement of versioning will be the focus of the next development steps. Another line of future research is the possibility to use the transparency platform as a mediation tool for broader public feedback and change management in policies. The results do not only provide support for the future use and development of CSAV in policy standardization projects similar to the “Research Core Dataset” on the national level, but also encourage testing the applicability and validity of the findings in international standardization endeavours. The results might also guide other development and discussion contexts with broad and diverse stakeholder participation requirements – which is often the case with attempts to solve wicked problems. Promising fields of application could be requirements analysis (not restricted to software development), approaches based on social or collective intelligence or citizen science. Although requiring additional efforts for documenting and modeling the argumentation in the development process, the presented methodology and prototype seems to be promising for designing and developing scalable and sustainable transparency information systems. It means to deliver the wellarticulated but rarely implemented transparency for policy and project development with complex and diverse stakeholder groups. Argumentation visualization plays a key role in documenting existing discourse knowledge and structuring participation in e-participation research and practice, applying. Therefore, the principles of information visualization to reduce the graph complexity in a flexible and interactive way might not only provide new options to ensure transparency, but also reduce the participation barrier for different stakeholder groups. Bot e-participation and CSAV might benefit substantially from further evidence-driven development and empirical research on the visualization of argumentation.
Twenty-Third European Conference on Information Systems (ECIS), Münster, Germany, 2015
7
Riechert et al./ Transparency in Policy Development Processes
References Bederson, B. B., and Shneiderman, B. (2003). The craft of information visualization: readings and reflections. Morgan Kaufmann Pub. Card, S. K., Mackinlay, J. D., and Shneiderman, B. (1999). Readings in information visualization: using vision to think. Morgan Kaufmann. Conklin, E. J., and Weil, W. (1997). Wicked problems: naming the pain in organizations, 2001. Cramer, H., Evers, V., Ramlal, S., Van Someren, M., Rutledge, L., Stash, N., … Wielinga, B. (2008). The effects of transparency on trust in and acceptance of a content-based art recommender. User Modeling and User-Adapted Interaction, 18(5), 455–496. De Fine Licht, J., Naurin, D., Esaiasson, P., and Gilljam, M. (2014). When Does Transparency Generate Legitimacy? Experimenting on a Context-Bound Relationship. Governance, 27(1), 111–134. Forsell, C., and Johansson, J. (2010). An heuristic set for evaluation in information visualization. In Proceedings of the International Conference on Advanced Visual Interfaces (pp. 199–206). ACM. Friedrichs, J. (1990). Methoden empirischer Sozialforschung (Vol. 28). VS Verlag. Gregor, S., and Hevner, A. R. (2013). Positioning and presenting design science research for maximum impact. MIS Quarterly, 37(2), 337–356. Herzberg, J. (2013). “Open Government”-Versuch einer Begriffsbestimmung. Verwaltung and Management, (19 (1)), 40–44. Introne, J., Laubacher, R., Olson, G., and Malone, T. (2012). Solving Wicked Social Problems with Socio-computational Systems. KI-Künstliche Intelligenz, 27(1), 45–52. Kunz, W., and Rittel, H. W. (1970). Issues as elements of information systems (Vol. 131). Institute of Urban and Regional Development, University of California. Loukis, E., and Wimmer, M. (2012). A multi-method evaluation of different models of structured electronic consultation on government policies. Information Systems Management, 29(4), 284–294. Loukis, E., Wimmer, M. A., Charalabidis, Y., Triantafillou, A., and Gatautis, R. (2007). Argumentation systems and ontologies for enhancing public participation in the legislation process. Mayring, P. (2010). Qualitative Inhaltsanalyse : Grundlagen und Techniken (11th ed.). Beltz. Mazza, R. (2009). Introduction to information visualization. Springer-Verlag New York Inc. Nielsen, J. (2005). Ten usability heuristics. Useit. Com. Peffers, K., Tuunanen, T., Rothenberger, M. A., and Chatterjee, S. (2007). A design science research methodology for information systems research. Journal of Management Information Systems, 24(3), 45–77. Renton, A. (2006). Seeing the point of politics: exploring the use of CSAV techniques as aids to understanding the content of political debates in the Scottish Parliament. Artificial Intelligence and Law, 14(4), 277–304. Riechert, M., and Dees, W. (2014). Research Information Standardization as a Wicked Problem: Possible Consequences for the Standardization Process. Case Study of the Specification Project of the German Research Core Dataset. Procedia Computer Science 33, 272–277. http://doi.org/10.1016/j.procs.2014.06.043 Rittel, H. W., and Webber, M. M. (1973). Dilemmas in a general theory of planning. Policy Sciences, 4(2), 155–169. Scheuer, O., Loll, F., Pinkwart, N., and McLaren, B. M. (2010). Computer-supported argumentation: A review of the state of the art. International Journal of Computer-Supported Collaborative Learning, 5(1), 43–102. Schneider, J., Groza, T., and Passant, A. (2013). A review of argumentation for the Social Semantic Web. Semantic Web, 4(2), 159–218. Schwaber, K. (1995). Scrum development process. In OOPSLA Business Object Design and Implementation Workshop,Vol. 27, pp. 10–19.
Twenty-Third European Conference on Information Systems (ECIS), Münster, Germany, 2015
8
Riechert et al./ Transparency in Policy Development Processes
Selvin, A., Buckingham Shum, S., Seirhuis, M., Conklin, J., Zimmerman, B., Palus, C., … Motta, E. (2001). Compendium: Making meetings into knowledge events. Shneiderman, B. (1996). The eyes have it: A task by data type taxonomy for information visualizations. In Visual Languages, 1996. Proceedings., IEEE Symposium on (pp. 336–343). Shum, S. J. B., Selvin, A. M., Sierhuis, M., Conklin, J., Haley, C. B., and Nuseibeh, B. (2006). Hypermedia support for argumentation-based rationale. In Rationale management in software engineering (pp. 111–132). Springer. Suthers, D. D. (2008). Empirical studies of the value of conceptually explicit notations in collaborative learning. In Knowledge cartography (pp. 1–23). Springer. Wang, W., Wang, H., Dai, G., and Wang, H. (2006). Visualization of Large Hierarchical Data by Circle Packing. In Proceedings of the SIGCHI Conference on Human Factors in Computing Systems (pp. 517–520). New York, NY, USA: ACM. http://doi.org/10.1145/1124772.1124851 Wissenschaftsrat. (2013). Empfehlungen zu einem Kerndatensatz Forschung (Drs. 2855-13). Geschäftsstelle d. Wissenschaftsrates.
Twenty-Third European Conference on Information Systems (ECIS), Münster, Germany, 2015
9
Riechert et al./ Transparency in Policy Development Processes
Acknowledgements This work was funded by the Federal Ministry of Education and Research (BMBF). Thanks to Sophie Biesenbender (iFQ) for useful discussions and Sebastian Riechert (Technical University Dresden) for help with the interview transcription.
Appendix 1: Reducing IBIS Complexity for definition argumentations
On the left side an excerpt of the definition argumentation is provided in IBIS notation. The tree starts with a question node. Each question can have one or more answers. Note that the model already follows our modeling rules for better readability (reading direction from left to right, hierarchy levels are placed on a common x-position). As the project context is set by the specification of a report policy (see section 3.1), only three types of questions are required: (1) “What is a suitable definition for …?”, (2) “How can … be differentiated?”, (3) “What are possible attributes for …?”. Based on the hierarchy level rule, and an additional content rule, it is now possible to leave out all questions without information loss: The top level node is always preceded by question type 1. All other answer nodes are preceded by question type 2. All attribute nodes (represented by the Compendium list node) are preceded by question type 3. Alternative solutions are modelled as two separate nodes that are connected to the issue node in IBIS. In our reduced language, the alternative solution can be linked directly, when the connection is classified as an alternative (no arrows).
Twenty-Third European Conference on Information Systems (ECIS), Münster, Germany, 2015
10
Riechert et al./ Transparency in Policy Development Processes
Appendix 2: Applying Task by paper type taxonomy (Shneiderman, 1996) Overview: Gain an overview of the entire collection: Mapping all argumentation information in Compendium is a challenging task. Overall, we have 1189 nodes (575 answers, questions and notes and 614 arguments) in seven content areas, that needed to be visually organized. Although we introduced additional visual rules (like reading from left to right, sub-differentiations always on the same ylevel), the resulting graphs were soon reported as being too complex to understand by the workgroups. Breaking down the hierarchies in sub-maps would have required up to 8 levels of maps, which was again reported to be too complex. As Compendium lacks functionality to expand and collapse tree nodes dynamically, we developed a visual representation that provided initial overview with showing only 1-3 hierarchy levels (configurable) initially (see filter), but allowed for dynamic transition into the hierarchy levels (see zoom). Zoom: Zoom in on items of interest: Both visualizations are implemented in SVG maps. In contrast to Compendium maps, which are only scalable from 100%-25% and get pixelated when using the browser in exported web-maps, the implemented SVG maps offer free scalability. Zooming can be triggered by using the standard zoom interactions (mousewheel and gestures) or by clicking on an element on a higher detail level. Filter: Filter out uninteresting items: In order to reduce the items visible at the same time, only the highest 1-3 hierarchy levels are shown initially (configurable). We implemented a visibility concept, that shows elements of higher or the same hierarchy level with high transparency to highlight the area focused on. Elements on a lower hierarchy level are shown only up to one level below, to allow for intuitive navigation. Additionally, the visualization allows for content filters based on tags that have been applied to the graph in Compendium. Using this, whole areas that have a preliminary status or relevance for specific stakeholder groups can be hidden or highlighted in a flexible way. In contrast to Compendium, we do not require new maps and new positioning for that procedure, but the original maps can dynamically fade to the filtered mode. Details-on-demand: Select an item or group and get details when needed: Both visualizations allow for selection interaction. This is possible in Compendiums web maps as well, but our interaction concept allows for dynamic hierarchy level transitions without window barriers. Additionally, we provide detailed information about the element in a dynamic context menu on the right side of the screen to avoid additional window barrier required by Compendium to load a new window for context information. Relate: View relationships among items: As organizing multiple levels in a window for each Compendium sub-map confused our project groups rather than enhanceding overview, we decided that all information should be organized in a single tree. This allows to present all hierarchy and crosshierarchy dependencies without the window barriers in Compendium Maps. Additionally, it is much easier for the user to orient herself.
Twenty-Third European Conference on Information Systems (ECIS), Münster, Germany, 2015
11
Riechert et al./ Transparency in Policy Development Processes
Appendix 3: Qualitative Evaluation of discourse visualization The table shows the evaluation categories (column “category”), the number of statements (#), the participation level (P: external participating stakeholder – EPS, internal participating stakeholder – IPS, non-participating external stakeholder – NES), the experience in working with visualizations (Exp: high – H, and low – L) and the stakeholder group (SG: practice – P, theory – T).
Alternatives and Argumentation
+/-
+ 12
6
+
Circle
22
13
Tree
+ 12
3
Category
#
P
Exp
SG
Allows to reuse argumentation in the implementation phase Documents the amount of discussion per element Interaction system provides the full argumentation on demand
2 2 2
EPS
H
P
IPS, EPS
L, H
P
IPS
L
P
Provides external transparency into the discussion process Interaction system can be configured for specific user groups Provides an information basis for the meeting preparation
2 1 1
EPS, NES
H
P, T
NES
H
T
EPS
H
P
Providing argumentation enables detailed self-information System can play a moderating role for communicating discussion
1 1
IPS
L
P
NES
H
T
Raises complexity of content and interaction Not relevant for all stakeholders Only increases transparency, if information is comprehensible
3 2 1
NES, IPS
H, L
T, P
NES, IPS
H, L
T, P
NES
H
T
Provides good overview over the discussion depth Provides preview to more detailed levels Circle layout more intuitive
4 3 2
NES, EPS
H
T, P
NES, EPS
H
T, P
NES, EPS
H
T, P
Clarifies aggregation levels High amount of Information can be coded visually
2 2
IPS
L
P
NES, IPS
H, L
T, P
Increases enjoyment of 'discovering' sub elements Uses visual space highly efficient Alternatives and Arguments can be added in same visual logic
2 2 1
EPS
H
P
NES
H
T
NES
H
T
Circle size shows discussion complexity Increases interest for discussion results More suitable for information presentation
1 1 1
EPS
H
P
EPS
H
P
IPS
L
P
Visually more appealing Circle size requires explanation
1 3
NES
H
T
IPS
L
P
Text appending is difficult in circle shapes Complex information coding - higher perception requirements Requires a bit more instruction
3 2 2
IPS, NES
L, H
P, T
IPS
L
P
NES, IPS
H, L
T, P
High number of subcategories are perceptible, but not readable Higher modification effort to use circles on detail level Less suited for detailed level (many nodes on the same level)
1 1 1
NES
H
T
NES
H
T
NES
H
T
More suitable for self-information Backwards navigation more intuitive
4 3
IPS, NES
L, H
P, T
IPS, NES, IPS
L, H
P, T
Scaling vertical only is more intuitive for going into detail Smaller node size allows for more unobtrusive color coding Hierarchy path is clearly visible
2 2 1
IPS
L
P
IPS
L
P
NES
H
T
For same information complexity, tree requires more pixels Less suited for general overview Lower scalability when visualizing high complexity
1 1 1
NES
H
T
IPS
L
P
IPS
L
P
The same statements are organized by the variables intuitiveness, information presentation, information coding and information depth in the following table.
Twenty-Third European Conference on Information Systems (ECIS), Münster, Germany, 2015
12
Riechert et al./ Transparency in Policy Development Processes
Sum
Information depth
Information Coding
Information Presentation
Intuitiveness
Circle Layout
#
Tree Layout
#
>
Alternatives and Arguments
#
More intuitive than tree layout
+2
More suitable for selfinformation
+4
Interaction system can be configured for specific user groups
+1
Increases enjoyment of 'discovering' sub elements
+2
Backwards navigation more intuitive
+3
Providing argumentation enables detailed self-information
+1
Alternatives and Arguments can be added in same visual logic
+1
Scaling vertical only is more intuitive for going into detail
+2
System can play a moderating role for communicating discussion
+1
Circle size requires explanation
-3
Not relevant for all stakeholders
-2
Requires a bit more instruction
-2
Clarifies aggregation levels
+2
Hierarchy path is clearly visible
+1
Interaction system provides the full argumentation on demand
+2
More suitable for information presentation
+1
Less suited for general overview
-1
Provides external transparency into the discussion process
+2
High number of subcategories are perceptible, but not readable
-1
+2
Raises complexity of content and interaction
-3
Less suited for detailed level (many -1 nodes on the same level) Provides good overview over the discussion depth
+4
Smaller node size allows for more unobtrusive color coding
Uses visual space highly efficient
+2 +1
Only increases transparency, if information is comprehensible
-1
Visually more appealing than tree layout
For same information complexity, -1 tree requires more pixels
Text appending is difficult in circle shapes
-3
Complex information coding higher perception requirements
-2
Higher modification effort to use circles on detail level
-1
Provides preview to more detailed levels
+3
Lower scalability when visualizing high complexity
Allows to reuse argumentation in the implementation phase
+2
High amount of Information can be coded visually
+2
Documents the amount of discussion per element
+2
Circle size shows discussion complexity
+1
Provides an information basis for the meeting preparation
+1
Increases interest for discussion results
+1
-1
Pro statements: 22
Pro statements: 12
Pro statements: 12
Contra statements: 13
Contra statements: 3
Contra statements: 6
Pro percentage: 62 %
Pro percentage: 80 %
Pro percentage: 66 %
Twenty-Third European Conference on Information Systems (ECIS), Münster, Germany, 2015
13