Department of Electrical and Computer Engineering and *Department of ... The computer chosen for the task ... two elementary schools in northern California. No.
Computer Programs in Biomedicine 17 (1983) 27-34
27
Elsevier CPB 00625
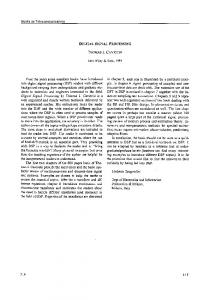
A digital signal processing system for EEG frequency analysis T.C. Hsia and R.H. Kraft* Department of Electrical and Computer Engineering and *Department of Applied Behavioral Sciences, University of California. Davis, CA 95616, USA
This paper describes the digital signal prooessingwork of a research project for studying children's cognitive processes by analyzing EEG signals during school-re~atedtasks. The EEG being analyzed involves two homologouschannels (left and right parietal area), and is recorded on ~nagnetictapes. The objectiveof the analysis is to determine if, by examining the alpha band of the ongoing EEG, different school tasks and correct vs incorrect responses can be detected. Analysis of alpha-band calls for the determination 9f signal power in the 7-12 Hz frequency band (adjusted for the age of the subjects) for each channel as well as correlation between the channels. A digital signal processing scheme implemented on an Apple II microcomputer was developed for such an analysis. The results obtained are discussed. EEG frequency analysis Digital signal processing Cognitive processes Correct-incorrect response School-related tasks Alpha-bandanalysis
1. I N T R O D U C T I O N Neurophysiological analysis of the cognitive processes underlying the performance of school achievement tasks is a necessary area Of research [1,2]. A pilot E E G study of children's laieral hemispheric processing patterns while they perform reading, science and mathematics tasks has been reported recently [13]. This pilot study was conducted to determine if: (1) Different types of school tasks (or different types of information processing) can be determined by analyzing on-going EEG recordings; and (2) Correct vs incorrect responses can be detected by analyzing on-going E E G recordings. The purpose of this paper is to describe the digital signal processing task of this pilot study. The signal processing task dealt with was for the analysis of the alpha band of the E E G which required calculations of spectral power of each channel and cross channel power correlations. Although these calculations could be carried out by analog processing schemes, a digital approach was 0010-468X/83/$03.00 © 1983 Elsevier Science Publishers B.V.
pursued to take advantage of the computational flexibility and precision that the digital computer offers. The software developed for this project is sufficiently general to be useful for subsequent E E G studies. The computer chosen for the task was the popular Apple II microcomputer. In the following we will discuss the experimental method of the E E G study project, and then discuss in detail the digital signal processing system developed for the study as well as evaluations of the results that have been obtained.
2. T H E E E G S T U D Y P R O J E C T The experimental set up including subjects and procedures for the E E G study are briefly described below. Subjects: Twenty volunteer right-handed boys between 12 and 14 years of age were selected from two elementary schools in northern California. N o subject had a history of neurological or hearing problems.
28
Procedures: Subjects were assessed for those characteristics which are known to affect lateral hemispheric processing: Hand and eye preference and family history of handedness. Administration and scoring procedures for these instruments can be found in Kraft [3]. Subjects were also given the Silvardi Reading Test [4] to determine their reading level.
An individual electroencephalogram was recorded while each subject performed a battery of school tasks* in a sound-dampened, electricallyscreened booth. Electrodes were placed according to the 10-20 system of the International Federation [5] for recording two homologous channels of EEG data from the left and right parietal area (P3, P4) referenced to Cz. A polygraph (Grass 78-7P511) recorded the EEGs on two channels of an 8 track FM tape recorder (Hewlett-Packard 3968A). Recorded simultaneously on a third and fourth channel were DC codes marking the beginning and end of each segment of interest and an audio track [6,7]. The taped data were digitized by and stored in an Apple II computer, which then performed spectral power analysis on the alpha band of various segments of the EEG data. The spectral power values of each segment were then averaged together. Selected as the measure of relative hemispheric activity was the ratio of the power in the alpha frequency band in each channel (right/left alpha power ratio) [8-10]. The log of this ratio was used as the dependent variable giving a symmetrical swing from negative (greater left hemispheric alpha power which is interpreted as greater left hemispheric activity) to positive (greater right hemispheric alpha power which is integrated as greater left hemispheric activity). The baseline, no 'lhinking'JEEG, was an attention-to-breathing task in which the subject was instructed to relax, look at a sheet of white paper, try not to think of * The school tasks consisted of four silent reading tasks (at each individual's instructional level), four geometry or spatial tasks (2 block design and 2 mental rotation tasks), two mental column addition tasks, and eight science concept . tasks (the anatomy and physiology of the eye, ear, brain and heart; ionization; oxidation; static electricity; and solutions). See [13] for further detail.
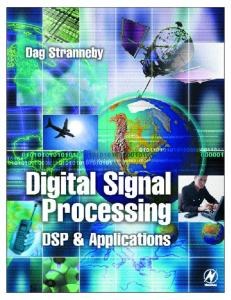
anything and concentrate on his breathing. To allow for the possibility of asymmetry in the baseline alpha powers, the baseline ratio was used to normalize the task ratio by subtracting it from each task ratio. 3. DIGITAL SIGNAL PROCESSING SYSTEM The EEG signal processing system to be described consists of three unique elements, namely: (i) data conditioning and digitization; (ii) bandpass digital filtering; and (iii) spatial power computation. Each of these elements is described below. The overall signal processing system structure is depicted by the block diagram shown in fig. 1.
I
Pre-recorded two-channel EEGdata
I
I
I Precondi diasand Ampl itutide oningI I I
I A-Dconversi and on Sampe l storage
1
1
Bandfiltering of Sampe l ddata
I AlphaBpaonw der Spectral Computation
I
i Analysis i
Fig. 1. Block diagram description of the overall EEG analysis system.
29
3.1. Data conditioning and digitization Due to the fact that the A-D converter in the Apple II requires that the analog signal be placed fully within the range of 0-5 V, the recorded EEG data must be played back through a DC bias of + 2.5 V which centers the signal within this conversion range. Another conditioning step is to adjust simultaneously the amplitudes of both channels of EEG signals, through a pair of adjustable voltage amplifiers, so that the signal occupy the full range of 0-5 V. This would then allow maximum precision of A - D conversion for a 8-bit A - D converter. We note that the bias voltage used would introduce a DC component in the EEG signals. This does not affect the subsequent analysis, however, because the EEG signals are bandpass filtered (to obtain the alpha band) which will suppress any DC voltages in the data. The sampling rate for A - D conversion is controlled by software, and the two channels of EEG are sampled alternately. The sampling period for this project was about T = 0 . 0 2 (or T = 0 . 0 1 s for each channel).
3.2. Ban@ass digital filtering The purpose here is to extract the signal power lying between the frequency range 7-12 Hz which represents the alpha band of EEG. There are a number of approaches that can accomplish this job: (i) Filter the analog EEG signals by a band pass analog filter before digitization and subsequent power calculations. This would be fine except that a pair of analog filters would be needed, and additional new filters would be required if different frequency bands (such as beta and gamma bands) are to be analyzed. (ii) Perform a fast Fourier transform (FFT) on the digitized EEG data, and then pick out the spectral power lying within the alpha band. This approach is viewed as undesirable because the average signal length for each segm e n t is a b o u t 10 0 0 0 - 1 7 000 d a t a points/channel of EEG depending on the
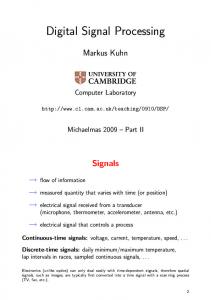
nature of the school task. This large size of data makes the F F T inefficient (requires too much memory) to use. Also, the F F T computes the entire power spectra even though only the alpha band is sought. (iii) Perform digital bandpass filtering on the digitized EEG data followed by spectral computation. This is the most desirable approach in comparison with the other two alternatives just mentioned. We shall now describe this approach in detail. A twentieth order digital bandpass filter of Butterworth design was used (see fig. 2). For the purpose of general utility, a filter design program [14] is included in the software which allows us to freely specify filter characteristics in terms of pass band frequencies, sampling intervals and the number of filter sections. Each section is represented by a fourth-order transfer function: a / ( z 4 -H:(Z) -
+
2Z .2 "4- 1 )
+ cjz + d/z + e,
(1)
where a:, b:, c:, dj and ej are the filter coefficients of the j-th section. These coefficients are determined by the filter design program. If x / ( k ) and Yi(k) are the input and output, respectively, of Hi(z), the j-th section filter difference equation corresponding to eq. (1) is: y : ( k ) = a/[ x : ( k ) - 2 x j ( k - 2) + x/( k - 4)]
- b / y : ( k - 1) - % y : ( k - 2) - d / y / ( k - 3) - e : y : ( k - 4)
(2)
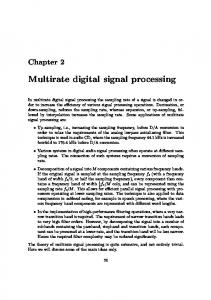
For this project, we used 5 filter sections ( j = 1, 2 . . . . . 5), a sampling interval T = 0.01 s, and the passband frequencies fl = 7 Hz f2 = 12 Hz. The digitized EEG data are processed successively by 5 sections using algorithms of eq. (2). The output sequence y s ( k ) then is taken as the desired alpha band signal. The filter coefficients and frequency response of the designed bandpass filter are shown in table 1 and fig. 3.
30
F
[
x1(k) Digital Filter E E ' ~ I I " / Section 1 Signal
Y1(k)=x2(k)
Digital Filter im,..
Y2(k)
x5(k)
Section 2
[Digital Filter Section 5
[Y5(k) ]Band
Fig. 2. A 20th order Butterworth bandpass digital filter consisting of 5 sections with a fourth-order transfer function for each section.
3.3. Spectral power computation This step involves the computation of the power of the output sequence ys(k ). In principle if there are N data points in the sequence, then the power of the sequence can be computed as: 1
N
P =-~ E y~(k)
(3)
k=l
This means that we would need to store all N data points of ys(k) generated by the filter eq. (2), and then compute eq. (3). In our case, N is large (10 000-17 000/channel) for each EEG segment which would take up considerable memory space for storing ys(k). Therefore, it would be advantageous if we could avoid the need of such large memory requirements. Our approach is to employ the following sequential algorithms:
P ( k ) = P ( k - 1) + l [ y 2 ( k ) _ P ( k _ k = 1,2 . . . . . N
P(k)=P
-10,
nn
Q Z Z
(.O -15,
0 n
-20,
-25
(4)
where P(k) is the culminative average power for k data points ys(1) . . . . . ys(k). It is guaranteed that:
-5,
he" UJ
1)]
• 2
I 4
FREQUENCY
: 6
: 8
IN
Fig. 3. Butterworth bandpass filter.
H
: 10
Z
-
-" 12
-
-" 14
atk=N
Equation (4) allows us to compute the power sequentially as the sequence y(k) evolves from ys(1), y5(2) .... to ys(N). Each new value of power P(k) is computed based on the previous ( k - 1 data point) power P(k - 1) and the newly generated data point Y5(k). Thus if we compute P ( k ) of eq. (4) immediately after eq. (2) for each k, we would then only have to store P(k - 1) in lieu of y(1) . . . . . y ( k - 1 ) . P ( k - 1 ) is updated for each increment of k. The last value P(N) is then the desired power P in q. (3). We wish to address another related problem that we have encountered in computing eq. (4). Due to limited accuracy (8 bit word) of the Apple II computer, the alpha band signal obtained did have a non-zero mean value (although very small) instead of a zero-mean as the bandpass filtering would theoretically have provided. This nonzero mean can be considered as a DC bias voltage imbedded in an ideal (zero mean) alpha band signal. As a result, the power of our computed
31
TABLE 1 Coefficients of five sections of b u t t e r w o r t h b a n d p a s s digital filter
a~
Section 1
Section 2
Section 3
Section 4
Section 5
0.09829013 - 1.07101530
0.08413417 - 1.00670905
0.07495166 - 0.96499557
0.06944496 - 0.93998027
0.06686237 - 0.92824832
~)
1.74710761
1.49548549
1.33226619
1.23438064
1.18847910
d/
- 0.96053091 0.82308677
- 0.73224966 0.56052197
- 0.58417085 0.39020450
-0.49536895 0.28806623
- 0.45372168 0.24016433
alpha band signal had a growing component which made P in eq. (3) or (4) meaningless (unstable). Thus, this problem had to be resolved. Our solution was to remove this mean value from the alpha band when computing the power P. Denoting the mean as M, a simple way of evaluating the mean of N data points is: 1
N
M=-~ • ys(k)
(5)
In the sequential algorithm of eq. (4), the modification is:
P(k) = mk-
1) +
-P(k-
1
MIk))
1)]
(7)
where M(k) is the mean at the k-th stage which has the following recursion formula:
k=l
M(k)=M(k-1)+l[ys(k)-M(k-1)]
Therefore, eq. (3) is modified as follows:
(8)
This formula is related to eq. (5) with: 1
N
(6)
P = N k=E1[ Y s ( k ) - M ] 2
M(k)=M
at k = g .
TABLE 2 V a r i m a x r o t a t e d f a c t o r m a t r i x of b r a i n w a v e s r e c o r d e d d u r i n g science concept, m e n t a l a r i t h m e t i c a n d g e o m e t r y tasks
R1 R2 BDI BD2 MA1 MA2 DS1 DS2 DS3 RS1 RS2 DQ1 DQ2 DQ3 RQ1 RQ2
Factor 1
Factor 2
Factor 3
Factor 4
- 0.03 0.34
- 0.05 0.9
0.45 -0.05
0.30 -0.10
0.28 0.42 - 0.28 - 0.22 0.82 0,58 0.70 0.61 0.31 0.03 - 0.04 0.19 0.08 0.19
0.65 0.55 0.24 0.75 - 0.15 0.03 0.44 -0.06 0.54 0.00 0.31 0.01 0.58 - 0.31
0.05 - 0.38 0.84 0.13 - 0.10 0.15 0.10 0.59 0.58 0.8 0.38 0.70 0.13 0.03
0.424 0.49 0.13 - 0.03 0.08 0.00 -0.38 0.36 - 0.03 0.91 0.74 0.6 0.19 - 0.12
-
Factor 5 0.58 0.77 0.08 - 0.22 0.04 0.03 - 0.17 0.25 0.02 0.05 - 0.04 0.14 - 0.05 - 0.01 -0.43 - 0.54
Abbreviations: R, m e n t a l rotation; RS, r e a d i n g science; DS, d e m o science; M A , m e n t a l a r i t h m e t i c ; BD, block design; RQ, r e a d i n g questions; D Q , d e m o questions.
32 In summary, we have proposed the following EEG processing algorithms: (i) For each EEG sampled point x~(k), compute Yl (k) through Y5(k) using eq. (2). (ii) Compute eq. (7) and (8). (iii) Increase k by 1 and repeat. Initial conditions are: yj(k) = x j ( k ) = 0 for k < 0, and P(0) = M(0) = 0. The entire signal processing software (digitization, bandpass filtering and power computation) were tested using ideal analog sinusoidal signal inputs, and yielded satisfactory results. This signal processing scheme then was employed to analyze the EEG in our project. The programming language was BASIC, and a listing of the complete processing program is available from the authors.
4. RESULTS
4.1. Factor analysis of the brain wave data At the time of this presentation the mathematics tasks (geometry and mental addition) and the stimulus and response items from the 2 reading science tasks and 3 demonstration science tasks were available for analysis. The brain waves sampled from these segments were subjected to a principal components factor analysis with iterations. This analysis yielded 5 factors having eigen values > 1 which accounted for 78.7% of the variance. The varimax rotated matrices of these 5 factors is reported in table 2. As table 2 reveals, the brain waves recorded during the three stimuli periods of the demonstration of science concept lessons all loaded highly on the first factor so this factor was considered to be an observation of science concepts factor. The brain waves recorded during the two block design tasks were among those that loaded highly on the second factor. This factor was, therefore, considered to be the block design factor. The brainwaves monitored during the two science concept reading tasks were among those that loaded highly on the third factor. This factor was named the answering
questions to demonstration science lessons factor because two of the three questioning periods from the demonstration science lessons loaded highly on it. The fifth factor was the mental rotation factor because the brain waves recorded during both of the mental rotation tasks loaded highly on it. Although these results are tentative, they do indicate that specific cognitive tasks (including specific instructional strategies) elicit unique patterns of hemispheric functioning.
4.2. Analysis of correct-incorrect responses The data from only 10 of the subjects were available for this pilot analysis. A discriminant function analysis was computed to assess the brain wave differences between correct and incorrect responses of each reading and science concept task. This set of analyses also takes into account the characteristics which have been found to affect lateral hemispheric processing, hand and eye preference and family history of handedness [3]. The results of the discriminant analysis to predict the correct-incorrect responses of the reading tasks revealed one significant canonical discriminant function [X2(6,33)= 17.124, p < .01] which accurately classified 86.84% of the responses (chance level = 50%). The results of the analysis to predict correct and incorrect responses of the science reading concept lessons also revealed one canonical correlation which was significant [X2(6,33)= 13.114, p < 0.05] and accurately classified 77.50% of the responses. The results of the analysis to predict responses on the science demonstration concept tasks approached significance, [X2(6,33)= 6.7645, p < 0.10] and classified 67.50% of the responses. (The data were also analyzed by t-tests with similar results. For a detailed description of the analyses, see [13].)
5. C O N C L U S I O N We have presented an EEG analysis computer system in this paper which has proven to be highly reliable and easy to operate. The data provided by this system have been consistently of high quality. Although the results of this pilot EEG study should
33 b e c o n s i d e r e d t e n t a t i v e , we b e l i e v e t h a t t h e r e is r e a s o n to p o s i t t h a t the t h i n k i n g i n v o l v e d in d i f f e r e n t types of tasks c a n b e d e t e c t e d b y a n a l y z i n g subjects' on-going EEG recordings and further t h a t the t h i n k i n g w h i c h leads to c o r r e c t us i n c o r rect r e s p o n s e s c a n also b e d e t e c t e d . F u r t h e r , the m e t h o d of d a t a c o l l e c t i o n , d a t a r e d u c t i o n a n d a n a l y s i s d e s c r i b e d in this p a p e r s h o u l d yield p r o d u c t i v e results in f u t u r e i n v e s t i g a t i o n s of l e a r n i n g and school achievement.
[7]
[8]
[9] REFERENCES
[1] Call for biobehavioral research on learning (Division of Human Learning and Behavior, National Institute of Mental Health, Bethesda MD, 1981). [2] R.E. Snow, P. Federico and W.E. Montigue, Conf. Proc. Aptitude, Learning, and Instruction (Lawrence Erlbaum, Hillsdale N J, 1980). [3] R.H. Kraft, Relationship between right-handed children's assessed and familial handedness and lateral specialization, Neuropsychologia 19 (1981) 637-843. [4] N.S. Silvardi, Classroom Reading Inventory, 3rd edn. (Wm.C. Brown, Dubuque IA, 1976). [5] H.H. Jasper, The ten-twenty electrode system of the International Federation of Societies for Electroencephalography and Clinical Neurophysiology EEG Clin. Neurophysiol. 10 (1958) 371-375. [6] R.J. Broughton, Acquisition of bioelectrical data: collection and application, in: M.R. DeLucchi ed., Handbook of
[10]
[11] [12]
[13]
[14] [15]
Electroencephalography and Clinical Neurophysiology, vol. 3A, pp. 1-84 (Elsevier, Amsterdam, New York NY, 1974). J.D. Frost and J.S. Barlow, Graphic and magnetic tape recording of bioelectrica[ phenomena, in: M.R. DeLucchi ed. Handbook of Electroencephalography and Clinical Neurophysiology, vol. 3B, pp. 1-64 (Elsevier, Amsterdam, New York NY, 1974). F.H. Lopes Da Silva, Sampling conversion and measurement of bioelectrical phenomena, in: M.A. Brazier ed. Handbook of Electroencephalography and Clinical Neurophysiology, vol. 4A, pp. 1-70 (Elsevier, Amsterdam. New York NY, 1976). C. Bungham, M.D. Godfrey and J.W. Tukey, Modern techniques of power spectrum estimation, IEEE Audio Electroacoust. 15 (1967) 53. E. Donchin, M. Kutas and G. McCarthy, Electrocortical indices of hemispheric specialization in: S. Harnod ed. Lateralization in the Nervous System, pp. 339-384 (Academic Press, New York NY, 1977) S. Springer and G. Deutsch, Left-Brain Right-Brain (W.H. Freeman, San Francisco CA, 1981). R.H. Kraft, O.R.. Mitchell, M. Languis and G.H. Wheatley, Hemispheric asymmetries during six-to-eight-year-olds performance of Piagetian conservation and reading tasks, Neuropsychologia 18 (1980) 637-643. R.H. Kraft and T.C. Hsia, Frequency analysis of EEG from children during school achievement tasks, in: M.L. Hull ed., Proc. Vth UCD Biomed. Engineer. Symp. pp. 71-74 (University of California, Davis CA, 1982). S.D. Stearns, Digital Signal Analysis (Hayden, Rochelle Park N J, 1975). G.C. Lairy, The normal EEG throughout life, in: Handbook of Electroencephalography and Clinical Neuropsychology, vol. 6B (Elsevier, Amsterdam, New York NY, 1975).