Journal of the Eastern Asia Society for Transportation Studies, Vol. 6, pp. 3401 - 3412, 2005
SKIDMARK PATTERNS AND IDENTIFICATION OF ABS-EQUIPPED PASSENGER CAR Ying-wei WANG Associate Professor Department of Transportation & Logistics Management National Penghu Institute of Technology 300,Liu-ho Rd., Ma-kung, Penghu Taiwan, R.O.C Fax:+886-9260373 E-mail:
[email protected]
Jian-da WU Associate Professor Institute of Vehicle and Rail Technology National Changhua University of Education 2 She-Ta Rd., Changhua City, Changhua 500 Taiwan, R.O.C Tel:886 4 7232105 E-mail:
[email protected]
Chao-nan LIN Master Department of Mechanical and Automation Engineering Da-Yeh University 112 Shan-Jiau Rd, Da-Tsuen, Chang-hua Taiwan 515 ROC Tel:886 4 8511888 ext 2581 E-mail:
[email protected] Abstract: As Anti-Lock Braking System (ABS) was invented to solve the safety problem of tires’ lock-up caused by car braking in emergency, its control mechanism might causes the tire-marks produced by ABS car can not be distinguished precisely. This dilemma will distort accident investigation especially on marks and their’ identification. To solve this problem, we employ dynamic car-braking test, considering the influential factors on braking under administrable environment, to obtain tire mark observations. The testing results help us to clarify tire marks and develop suitable method to collect investigation data. Furthermore, based on the results, efficient methods on tire marks identification and measurement can be developed and greatly decreases investigation time. Key Words:Anti-Lock Braking System, Accident Investigation, Skid-marks
1. INTRODUCTION Anti-lock Braking system (ABS) was introduced to solve the safety problem of tires’ lock-up caused by car braking in an emergency. Because the slip ratios of tires were controlled ideally at the range of 10%~30%, the friction marks (skid-mark) produced on roadway are always very fait, even if, invisible or latent ones. In accident reconstruction, the traditional method for estimating minimum vehicle speed by using the actual length of skid-mark is no more appropriate; especially in the situation of invisible skid-marks. On the other hand, the faint marks only can be seen from the specific observation position and direction at scene; its lengths measured by investigators (usually needing two persons) are time-consuming and inaccurate. Furthermore, the identification of faint skid-mark images on photo is much troublesome to identifiers or re-constructionists. Therefore, how to photo and measure the faint skid-mark on scene and identify it need helps from photogrammetry methods and 3401
Journal of the Eastern Asia Society for Transportation Studies, Vol. 6, pp. 3401 - 3412, 2005
processing techniques to aid their jobs on measurement and identification. To realize the reliabilities of digit photogrammetry and increase the visibility or visualization of faint skid-marks (on photo) produced by the ABS car, image-processing methods are employed to do the refinement. Their processing effects will be demonstrated and compared by using the actual ABS-skid-marks obtained from an empirical car braking test. This study firstly reviewed the related literatures. Secondly, it summarized experiment design factors selection, findings, and results from empirical car braking test. Thirdly, we introduced an empirical car-braking test to obtain real tire marks and their types of ABS skid-marks from the tests. Fourthly, the results of ABS skid-mark refinement were demonstrated and compared. Finally, conclusions were addressed.
2. LITERATURES REVIEWS Studies concerning whether the visible skid-marks existed or not from ABS car braking tests and how they were measured and identified/refined were reviewed. Much early works were done in Germany in 1980s. Two groups (Lohle et al., 1980, Burg et al., 1980) reported faint tire marks in all their tests, which were obtained from cars equipped with the first Bosch ABS. The first group (Lohle et al., 1980) reported lightening and darkening of the marks (skid control dashes) caused by the cycling of the systems. However another German researcher (Engels, 1983, 1984), using cars with the same ABS system, found marks is only about half of his conventional tests and commented that the appearance of the “dashes” dependent on how heavily the brakes were used. That is, if the pedal was used just enough to activate the antilock system, only the dashes were made. Nevertheless, heavier pressures on pedal produced a continuous and uniform mark. All these studies reported that the faint skid-mark sometimes could be seen much easily using a polarizing filter. In 1990 Metz et al (Metz et al., 1990) used cars equipped with five kinds of ABS to conduct braking test on two pavements (asphalt and cement) and single speed (105km/hr). He found no invisible marks and inferred that faint marks were only produced in some suitable situations. There were heavier marks at the finish than in the beginning. No “dashes” were found but did have heavier skid-marks at the finish. The faint marks could be seen much easily from 6~9m along the reversed direction of car driving. No marks could be seen from the top and the other directions. Mark measurement needs two persons. One observed the mark and direct the other to position it. However, the error of length measurement was still high (within 5 ft ) and inclined to inferred low speed conditions. The faint mark were vanished after around 24 hours. This study suggested further study could consider other factors such as different pavements, vehicle speeds, temperatures, tire types, and ABS to conduct above tests. Heavier marks might be obtained via joint impacts. Lambourn (Lambourn, 1994) used five cars equipped with different ABS (Bosch, Teves, Girling scs, Honda ALB) to perform braking tests under two types of asphalt-concrete pavements. His results showed that most tests resulted in none tire marks and the faint and continuous ones could only be produced in some condition, especially on the pavement containing white stone aggregation. No “dashes” were found, either. In general, the tire marks on new (darker) pavement were difficult to recognize. There was no tire marks on even pavements, though single-side tire marks could be produced from uneven pavement. Moreover, a short skid-mark (“dashes”) about one meter length could be created while heavier
3402
Journal of the Eastern Asia Society for Transportation Studies, Vol. 6, pp. 3401 - 3412, 2005
brake pressure was used. This study proposed a lot of methods to refine tire-mark identification at scene which included chemical, thermograph, low angle and polarized lighting, infrared imaging and fluorescence. However, only low angle and polarized lighting could be empirically applied to refine the faint tire marks. There is still no way to refine the invisible ones. Wright (Wright, 1995) used two Chevrolet cars (one with ABS on, the other with ABS off) to undertake braking tests on ten different roadways including asphalt, Genite, Compacted Rock, Grass, etc. His results showed all tests can produce visible scuff marks, but fainter than the general skid-marks of non-ABS. Marks were short-lived and could only last around 24 hours. From literatures, we know that whether faint tire marks could be produced is uncertain and would be dependent on their testing conditions and the only way allowing tire marks refinement on scene would be the usage of polarizing filter. Therefore, it needs first to confirm whether faint tire marks could be produced or not from the ABS-equipped brakes car and then develop a simplified method for refining faint tire marks photogrammetry and identification. These could replace high-cost manual measurement and decrease tools needed in accident investigation and reconstruction.
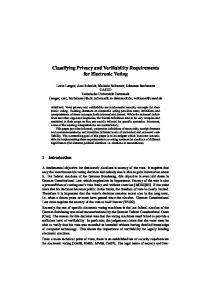
3. ANTI-LOCK BRAKING SYSTEM In car braking process, if the front wheels were locked up, the vehicle will lose the steering capability because of the vanish of lateral friction forces. Contrarily, if the rear wheels were locked up, it will make vehicle tailspin, more seriously, will turn it over at high speed condition. Anti-lock braking system was invented to solve the safety problems of tires’ lock-up caused by car braking in an emergency. It can keep car’s steering capability and increase their stability, while at the same time, decrease accidental risks, especially driving on wet roadway. Even if the ABS was broken, it shall still has the function of conventional braking system. The structure of ABS is shown in Figure 1. A typical ABS is composed of a ECU (Electronic control unit), four speed and wheel sensors (VSS and WSS), pump, and two or more hydraulic valves on brake circuit. The ECU constantly monitors the rotation speed of each wheel. When it senses that one or more wheel is rotating slower than the others, it moves the valves to decrease the pressure on the braking circuit, effectively reducing the braking force on that. When driver push the pedal, the wheels will obtain the optimal braking forces. The slip-ratios of wheels are controlled ideally in the rage of 10%~30%, which attain higher friction forces from higher friction coefficient as shown in Figure 2. However, ABS can not increase braking strength at all. Wheel’s slip ratio is shown in Formula (1), where Vs represents vehicle speed and Ws measures wheel speed. At 0% slip ratio equals, wheel speed equals to vehicle speed. Contrarily, when slip ratio equals to 100%, it means that wheels are locked up and car is skidding. V − Ws × 100% Slip_ratio = s Vs
(1)
3403
Journal of the Eastern Asia Society for Transportation Studies, Vol. 6, pp. 3401 - 3412, 2005
Push the pedal
Master cylinder
Hydraulic valve (input)
VSS ECU
Accumulator
Liquid pump
Liquid Modulator
Hydraulic valve (output)
WSS
Storage room
Friction coefficient
Figure 1 A Typical Anti-lock Braking System
Slip-ratio
Figure 2 The Relationship of Slip-ratio and Friction Coefficient
4. CAR-BRAKING EXPERIMENT To verify whether the skid-mark could be produced by ABS car or not, this study perform a car-braking experiment to obtain control dynamics, vehicle kinematics and skid-marks such as braking distance, speed, deceleration, fluid pressure, tire mark length, etc. From this testing data, we could know the frequency of skid-marks produced by ABS-controlled tires and their difference compared to the skid-marks from lock up wheel. It can help us to develop appropriate methods for refining the visibility of skid-marks on photo. 4.1 Overview By considering the safety, economy and accuracy of dynamic car-braking experiment, the test was conduct by the Automotive Research and Testing Center in Taiwan. The testing date was August 13~14, 2003. Test sites were at a comprehensive performance test road located at the center and neighboring of Lu-Kung road. All tests were conducted by a 2000 MITSUBISH Virage four-door sedan equipped with Bosch ABS (four control loops). The fifth wheel (single axis) was attaches to the middle of rear right door for reducing the vehicle pitch effect while car braked. This helps to collect the kinematics data such as braking distance, vehicle speed, deceleration etc. Meanwhile, four wheel speed sensors were attached to the wheel hub to detect wheels’ rotation speeds and were joined with vehicle speed to calculate the slip ratios of four wheels. Brake line hydraulic pressures were measured by a pressure sensor attached to master cylinder. The dynamic relationship between slip ratio and hydraulic pressure during braking can be obtained and recorded for ABS operation reliability test. After each test, a scene photo was took by a simple camera located 3-5m away from tire 3404
Journal of the Eastern Asia Society for Transportation Studies, Vol. 6, pp. 3401 - 3412, 2005
marks and viewed with a low angle (15-30 degree) from roadbed along the reversed direction of car driving. 4.2 Experiment Design The testing purpose is to obtain empirical results of ABS car braking under the constraint of research budget. It is not to look for the optimal factors combination to validate the tire marks being produced; this requires much more tests and corresponding careful factors selection. In this study, our experiment only selects the important factors similar to former studies and verifies their testing results. Based on the obtained tire marks the image processing methods can be to apply to refine the visibilities of the marks and then their visualization effects can be compared. The factors considered in our test are pavement (two asphalts) and vehicle speed (three levels: 30, 50, 70km/hr). In each factor combination, the car was repeatedly braked three times and observations on tire mark were obtained. After each test, the scene was photographed and wherein the widths and lengths of tire marks, if any, were measured by two persons. One observes the marks and direct, the other to position and measure. Thus, the total observations obtained are 18. 4.3 Experimental Results As mentioned above, the dynamic relationship between brake line liquid pressure and wheel’s slip ratio in car braking process can be used to verify the reliability of ABS operation. It can also be employed to identify the mechanic or non-mechanic causes of the invisible or latent tire mark produced from the test. That is, we can conclude that whether the invisible tire marks were caused by the abnormal ABS operation or not. The diagrams of normal speed-deceleration, pressure-slip-ratio relationships obtained from right front and left rear wheels in a test by using vehicle speed 70/hr on pavement A (the center performance test roadway) are shown in Figure 3. As shown in Figure 3 (a), the speed linearly decreases to zero while braking were done. Meanwhile, vehicle deceleration largely increases at the beginning, then keeps at constant, and finally decreases to zero. Figure 3 (b) & (c) show that liquid pressure comes up with a cycle of consecutive up and down in braking process. Meanwhile, the corresponding slip-ratio gradually increase in pressure climbing process; as it is over 30%, the system releases the liquid pressure to lower down the ratio. Contrarily, while the ship-ratio reaches the lower threshold value, the pressure would increase again. It continues the cycles of up and down until the car is fully stopped. The kinematics data (braking distance, speed, time etc.) collected from fifth wheel and the measurements of visible tire mark from specific orientations are summarized in Table1. From it, we have the following findings.
3405
Journal of the Eastern Asia Society for Transportation Studies, Vol. 6, pp. 3401 - 3412, 2005
[km/h]
Speed Ë
Ç deceleration
[Sec]
(a)
Liquid pressure
[0.1 kg/cm2]
Ë Åslip-ratio
[Sec]
(right front wheel)
[0.1 kg/cm2]
(b) Liquid pressure È
[Sec]
Åslip-ratio
(Left rear wheel)
Figure 3 The Relationships of Speed-deceleration, Liquid Pressure-slip Ratio (Right Front and Left Rear Wheels) Table 1 Actual Braking-distance and Measured Skid-mark Length from Different Braking Conditions Pavement 1
Speed Actual distance 2 (km/hr) (m)
Time (s)
A A A
30 30 30
4.76 4.58 4.75
1.66 1.73 1.55
A
50
11.65
2.34
A
50
11.86
2.22
A
50
11.65
1.93
A
70
21.79
2.71
A
70
21.79
2.63
A
70
21.59
2.82
B B B B B B B
30 30 30 50 50 50 70
4.37 4.39 4.70 11.51 11.36 11.49 21.73
1.69 1.67 1.77 2.26 2.21 2.25 2.88
B
70
21.34
2.65
Measured distance 2 (m) LF3
RF3 4
(0.50) (0.42) (0.22) 9.17 (0.2) 9.06 (0.2) 8.77 (0.4) 18.31 15.24 (0.22) 17.36 (0.22) (0.30) (0.30) - - - (1.63) -
(0.25) B 70 21.63 2.82 19.39 Note:1.Pavement A:The pavement of center performance test roadway.
(0.75) (1.03) (0.33)
LR3 RR3 - - -
- - -
-
-
-
-
-
-
-
-
-
-
-
-
-
-
-
-
- - - - - - -
- - - - - - -
-
-
-
-
(0.15)
(0.29) (0.51) (0.35) (0.26) - - - 18.19 18.90 (0.3) 19.39
Pavement B:Lu-kung roadway (general roadway ) 2.Actual braking distance:Measured by fifth wheel, Measured distance : Measured by human -labor 3. LF:Left front, RF:Right front, LR:Loft rear, RR:Right rear. 4. ():short skid-mark at finish.
3406
Journal of the Eastern Asia Society for Transportation Studies, Vol. 6, pp. 3401 - 3412, 2005
(1) All tests on pavement A had faint skid-mark deposited. At 30km/hr, only had the short marks about 22~103cm, as shown in Figure 4. When speed up to 50 and 70 both short marks at the finish and long-continuous marks can be observed. Their lengths are 8.77~9.17m, 15.24~18.31m, respectively shown in Figure 5. Moreover, on pavements B it also presents the short marks (about 26~51cm) at 30 km/hr. But at 50km/hr, there are two tests have no tire marks can be observed even though the ABS operations are normal. At 70km/hr, the long faint tire marks as shown in Figure 6 around 18.19~13.39m had appeared. All short marks mentioned above are similar to the results of Metz (Metz, 1990). (2) The faint skid-mark type can be divided into three categories, namely, short mark at the finish, long continuous one (including short mark at the finish), and long continuous. The feature of those marks is much faint comparing to the conventional marks produced by lock up wheels. The short-lived marks vanished after around 24 hours. This finding is similar to the experiment results of Wright (Wright, 1995). (3) The lengths of tire mark measured manually are shorter than the actual braking distance obtained by the fifth wheel. Hence, vehicle speed calculated by using the measured marks’ length is underestimated. (4) There are differences on types and features between ABS and non-ABS skid-mark. In general, ABS skid-mark is faint with slight outline. There is inconsistent darkness along the length. Contrarily, typical skid mark is darker with much complete outline (having clear striations) and uniform darkness along the length. These differences can be used to distinguish ABS and non-ABS. (5)The tests also find out similar short skid-mark (about 1.5m) under abnormal operation of ABS as the findings shown in Lambourn’s experiment.
Continuous one
Short one
Short one Continuous one
Figure 4 Short Mark at Figure 5 Long Continuous Figure 6 Long Continuous the Finish Mark with Finish Short Mark Mark
5. IDENTIFICATION OF ABS TIRE MARK Faint tire mark frequently can be produced while ABS-equipped car brakes; however it requires careful observation, measurement and photographing at scene due to its short lives. 3407
Journal of the Eastern Asia Society for Transportation Studies, Vol. 6, pp. 3401 - 3412, 2005
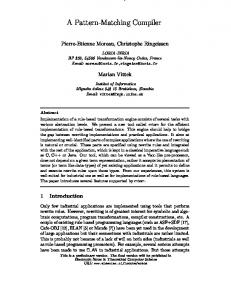
Furthermore, tire mark on photo especially needs some techniques to process for the following identification work. Some image-processing methods were applied to increase the visibility of faint tire mark for facilitating the proceeding of identification work. Their visualization effects of refinement on marks were demonstrated and compared in the following sections. 5.1 Image Refinement Methods Because the length of faint skid-marks on photo usually can not easily be identified, especially at the beginning and finish. Therefore, how to increase their contrast comparing to the neighboring pavement is important aspects of image processing. This study employs histogram specification methods to adjust the gray-level histogram to effectively refine the outline of the faint skid- mark and manifest its beginning and finish. These methods basically adjust the gray-level value distribution in image. It is processed through the transformation of gray-level value probability function to expand its dynamic distribution in image and then refine the contrast to increase the visualization effect. In this study, a lot of output probability density functions (p.d.fs) were used to transform the original gray-level values. The output p.d.f. and their corresponding transformation functions are shown in Table 2. There are five methods including uniform, exponential, Raleigh, cube-root and logarithmic; where Pg (g) represents the p.d.f. of gray-level value g after the transformation, Pf (f) represents the cumulated p.d.f. of gray-level f before the transformation, and α is the parameter. 5.2 Demonstration and Comparison The visualization effects using the methods mentioned above are contrast with three faint skid-mark photos as show in Figure 7. In origin skid-mark A, it has clear finish (short straight-line), but can not identify its beginning. After image processing, the beginning is visible at each image. But the finish at each image is ambiguous with neighboring pavement except for the uniform distribution method. In origin skid-mark B, the one also has clear finish, though with slight outline. The black object in image was previously placed to position the beginning. After processing, the beginning in each image is visible and close to the fixed object. Wherein, the uniform method is much clear. In origin skid-mark C, a long continuous one without clear finish and beginning is difficult to observe at scene. A pen was putted on the roadway to point out the finish. After processing, the beginning and finish in each image can be recognized except the images by using the exponential and logarithmic. Furthermore, in the original image, a general skid-mark and scratch located at left and right sides are much visible after processing. The image shows obvious difference between ABS and general skid-marks and scratches. Form above comparison, a conclusion can be obtained as follow. In general, a long faint skid-mark is not easily to recognize unless a short mark at the finish has presented. After processing via the five methods, all the beginning, finish and outline of faint tire mark are much clear and the property of inconsistent darkness along the length is much visible. In the comparison of visualization effects by above five methods, the uniform method is much better than the others, especially, at the beginning. On the other hand, to prevent the marks interweaved with background pavement, the target object (tire mark) is nicely projected at the center area of film. Moreover, the application advantage of methods with α parameter is that it can be adjusted to manifest specific scope gray-level values.
3408
Journal of the Eastern Asia Society for Transportation Studies, Vol. 6, pp. 3401 - 3412, 2005
Empirically, these methods can be applied and crossly validated the processing results to increase the accuracy of skid-mark identification. Table 2 Output Probability Density Functions and Their Corresponding Transformation Functions Probability density function
Transformation function
(Uniform) p g (g ) =
1 g max - g min
g = (g max − g min ) P f ( f ) + g min
(Exponential) p g ( g ) = α exp[- α (g - g min )]
g = g min −
1 ln[1 − P f ( f )] α
(Rayleigh) p g (g ) =
g − g min α2
⎡ ( g − g min ) 2 ⎤ exp ⎢ − ⎥ 2α 2 ⎦ ⎣
⎡ ⎛ ⎞⎤ 1 ⎟⎥ g = g min + ⎢2α 2 ln⎜ ⎜ 1 − Pf ( f ) ⎟⎥ ⎢⎣ ⎝ ⎠⎦
1/2
(Cube Root) p g (g ) =
1 g −2 / 3 1/3 3 g 1/3 max - g min
1/3 1/3 3 g = [(g 1/3 max - g min ) P f ( f ) + g min ]
(Logarithmic) p g (g ) =
g[ln(g
beginning?
finish
Origin tire mark A
max
1 ) - ln(g
min
)]
beginning
⎡g ⎤ g = g min ⎢ max ⎥ ⎣ g min ⎦
Pf ( f )
beginning
finish
Uniform
Cube
3409
Journal of the Eastern Asia Society for Transportation Studies, Vol. 6, pp. 3401 - 3412, 2005
beginning
Exponential( α = 0.02 )
fixed object
finish
Origin tire mark B
beginning
Exponential( α = 0.02 )
beginning
Raleigh ( α = 50 )
beginning
beginning
Logarithmic
beginning
finish
Uniform
beginning
Raleigh ( α = 50 )
Cube
beginning
Logarithmic
3410
Journal of the Eastern Asia Society for Transportation Studies, Vol. 6, pp. 3401 - 3412, 2005
general
beginning
skid-mark beginning?
beginning
scratch finish
finish
finish
Origin tire mark C
beginning
Uniform
beginning
Cube
beginning
finish
Exponential( α = 0.02 ) Raleigh ( α = 50 ) Logarithmic Figure 7 Demonstration and Comparison of Visualization Effects before and after Image Processing 6. CONCLUSION Faint skid-marks are frequently produced by ABS-equipped car. Because of its faint characteristic, it is difficult to observe and identify by conventional methods. This study employs image-processing methods to refine the visibility of faint skid-marks obtained from empirical car-braking tests to facilitate mark identification conducted by identifier or re-constructionist. From above comparisons, using five refinement methods through three tire-mark photos, the visualization of faint skid-mark actually refined. The processing results also can be used as a basis to perform mark photogrammetry in replacing manual measurements at scene. The issue will be our next studies. Finally, we would like to emphasize the facts again that the skid-mark by ABS car braking probably could not be produced. Therefore, whether the evasive driving behavior can be identified from the observed skid-mark or not is not certain and the minimum speed estimation by its length probably could not be applied either.
3411
Journal of the Eastern Asia Society for Transportation Studies, Vol. 6, pp. 3401 - 3412, 2005
ACKNOWLEDGEMENT The work described in this paper forms part of the research project, the Study on Establishing an Identification Model of Tire mark for the Motorcar with Anti-Lock Braking System at Accident Scene, supported by the grant from the National Science Council of the Republic of China under grant number NSC 91-2211-E-346-001.
REFERENCES Burg, H. and Rau, H. (1980) Spurenzeichnung und Bremsverzogerung bei Notbremsungen mit Personenkraftwagen mit und ohne Automatischem Blockierverhinderer (The Making of Marks and Braking Deceleration with Emergency Braking by Passenger Motor Vehicles with and without Automatic Skid Prevention Devices), Der Verkehrsunfall (3), 55-62. Engels, K. (1983) Moglichkeiten und Grenzen der Geschwindigkeitsruckrechnung aus Regelspuren ABV-gebremster Pkw (Possibilities and Limits for Back-Calculating Speed from Skid Control Tyre Marks with ABS Braking), Verkehrsunfall und Fahrzeugtechnik (5), 133-138. Engels, K.(1984) Das Notbremsvermogen von Pkw mit Automatischen Blockierverhinderer (ABV) unterschiedlicher Bauart-ein Leitungsvergleich zwischen ABS, ALB und ASBS (The Emergency Braking Capability of Cars with Various Makes of Automatic Anti-Lock Systems – a Comparison of the Performance of ABS, ALB and ASBS, Verkehrsunfall und Fahrzeugtechnik (7/8), 221-228. Lohle, U., Burkart, F., Eberhardt, W. and Himbert, G. (1980) Bremsverhalten, Spurenzeichnung und Spurenerkennung ABS-gebremster Personen-kraftwagen(Braking Characteristics, the Making of Tyre Marks, and Recognition of Tyre Marks of Passenger Vehicles with ABS Braking), Der Verkehrsunfall (3), 48-54. Lambourn, R. F. (1994) Braking and Cornering Effects with and without Anti-Lock Brakes, SAE Technical paper 940723. Metz, L. D. and Ruhl, R. L. (1990) Skidmark Signatures of ABS-Equipped Passenger Cars, SAE Technical Paper 900106. Wright, B.(1995) Evidence of ABS scuff marks on the roadway, Traffic Accident Reconstruction Origin.
3412