Jun 17, 2009 - On the other hand, the QED/EW corrections to the hard process ... to be included while interpreting the future LHC W-boson data in the framework ... event summaries, to confine our analysis within a âlaptop-sizeâ data-storage space. ..... isation asymmetry of the produced W-bosons will drive the observed ...
Final version June/2009
Measurement of MW+ − MW− at LHC arXiv:0812.2571v2 [hep-ph] 17 Jun 2009
F. Fayettea , M. W. Krasnya , W. Placzekb,a and A. Si´ odmokb,a a
b
LPNHE, Pierre et Marie Curie Universit´es Paris VI et Paris VII, Tour 33, RdC, 4, pl. Jussieu, 75005 Paris, France
Marian Smoluchowski Institute of Physics, Jagiellonian University, ul. Reymonta 4, 30-059 Cracow, Poland
Abstract This paper is the second of the series of papers proposing dedicated strategies for precision measurements of the Standard Model parameters at the LHC. The common feature of these strategies is their robustness with respect to the systematic measurement and modeling error sources. Their impact on the precision of the measured parameters is reduced using dedicated observables and dedicated measurement procedures which exploit flexibilities of the collider and detector running modes. In the present paper we focus our attention on the measurement of the charge asymmetry of the W -boson mass. This measurement is of primordial importance for the LHC experimental program, both as a direct test of the charge-sign-independent coupling of the W -bosons to the matter particles and as a necessary first step towards the precision measurement of the charge-averaged W -boson mass. We propose and evaluate the LHC-specific strategy to measure the mass difference between the positively and negatively charged W -bosons, MW + − MW − . We show that its present precision can be improved at the LHC by a factor of 20. We argue that such a precision is beyond the reach of the standard measurement and calibration methods imported to the LHC from the Tevatron program.
Final accepted version for the European Physical Journal C Final version, June 2009 The work is partly supported by the program of the French–Polish cooperation between IN2P3 and COPIN No. 05-116 and by the EU Marie Curie Research Training Network grant under the contract No. MRTN-CT-2006-035505. ?
1
Introduction
As demonstrated by Gerhard L¨ uders and Wolfgang Pauli [1], any Lorentz-invariant quantum field theory obeying the principle of locality must be CPT-invariant. For theories with spontaneous symmetry breaking, the requirement of the Lorentzinvariance concerns both the interactions of the fields and the vacuum properties. In the CPT-invariant quantum field theories masses of particles and their antiparticles are equal. The Standard Model is CPT-invariant. In this model the W + and W − bosons are constructed as each-own antiparticles, which couple to leptons with precisely the same SU (2) strength, gW . The hypothesis of the exact equality of their masses is pivotal for the present understanding of the electroweak sector of the Standard Model. It is rarely put in doubt – even by those who consider the CPT invariant Standard Model as only a transient model of particle interactions. However, from a purely experimental perspective, even such a basic assumption must be checked experimentally to the highest achievable precision. The most precise, indirect experimental constraint on equality of the W + and W − masses can be derived from the measurements of the life-time asymmetries of positively and negatively charged muons [2]. These measurements, if interpreted within the Standard Model framework, verify the equality of the masses of the W + and W − bosons to the precision of 1.6 MeV. Such a precision cannot be reached in direct measurements of their mass difference. The experimental uncertainty of the directly-measured mass difference, MW + − MW − = −200 ± 600 MeV [2], is about 400 times higher. Recently the CDF collaboration [3] measured MW + − MW − to be 257 ± 117 MeV in the electron decay channel, and 286 ± 136 MeV in the muon decay channel. These measurements provide to this date the best model-independent verification of the equality of the masses of the two charge states of the W -bosons. They are compatible with the charge symmetry hypothesis. It is worth stressing, that the present precision of the direct measurement of the charge-averaged mass of the W -boson, MW = 80.398 ± 0.025 GeV, derived under the assumption of the equality of the masses, is by a factor of 10 better than the precision of the direct individual measurements of the masses of its charged states. Apart from the obligatory precision test of the CPT-invariance of the spontaneously broken gauge-theory with a priori unknown vacuum properties, we would like to measure MW + − MW − at the LHC for the three following reasons. Firstly, we would like to constrain possible future extensions of the Standard Model in which the effective coupling of the Higgs particle(s) to the W -boson depends upon its charge. Secondly, contrary to the Tevatron case, the measurement of the chargeaveraged mass at the LHC cannot be dissociated from, and must be preceded by, the measurement of the masses of the W -boson charge states. Therefore, any effort to improve the precision of the direct measurement of the charge-averaged mass of the W -boson and, as a consequence, the indirect constraint on the mass of the Standard Model Higgs boson, must be, in our view, preceded by a precise understanding of 1
the W -boson charge asymmetries. Thirdly, we would like to measure the W -boson polarisation asymmetries at the LHC. Within the Standard Model framework the charge asymmetries provide an important indirect access to the polarisation asymmetries. This is a direct consequence of both the CP conservation in the gauge-boson sector and the purely (V − A)-type of the C- and P-violating coupling of the W bosons to fermions. Any new phenomena contributing to the W -boson polarisation asymmetries at the LHC must thus be reflected in the observed charge asymmetries. The optimal strategies for measuring the charge-averaged mass of the W -boson and for measuring directly the masses of its charge-eigenstates are bound to be different. Moreover, the optimal strategies are bound to be different at the LHC and at the Tevatron. At the Tevatron, producing equal numbers of the W + and W − bosons, the measurement strategy was optimised to achieve the best precision for the chargeaveraged mass of the W -boson. For example, the CDF collaboration [3] traded off the requirement of the precise relative control of the detector response to positive and negative particles over the full detector fiducial volume for a weaker requirement of a precise relative control of charge-averaged biases of the detector response in the left and right sides of the detector. Such a strategy provided the most precise measurement of the charge-averaged W -boson mass, but large measurement errors of the charge-dependent W -boson masses. If not constrained by the beam transfer systems, the best dedicated, bias-free strategy for measuring MW + − MW − in proton–antiproton colliders would be rather straightforward. It would boil down to collide, for a fraction of time, the directioninterchanged beams of protons and anti-protons, associated with a simultaneous change of the sign of the solenoidal B-field in the detector fiducial volume. Such a measurement strategy cannot be realised at the Tevatron, leaving to the LHC collider the task of improving the measurement precision. The statistical precision of the future measurements of the W -boson properties at the LHC will be largely superior to that achieved at the Tevatron. On the other hand, it will be difficult to reach comparable or smaller systematic errors. The measurements of the W -boson mass and its charge asymmetry can no longer be factorised and optimised independently. The flavour structure of the beam particles will have to be controlled with a significantly better precision at the LHC than at the Tevatron. While being of limited importance for the MW measurement at Tevatron, the present knowledge of the momentum-distribution asymmetries of: (1) down and up valence quarks, and (2) of charm and strange quarks will limit significantly the achievable measurement precision. The ‘standard candles’, indispensable for precise experimental control of the reconstructed lepton momentum scale – the Z-bosons and ‘onia’ – will be less powerful in the case of proton–proton collisions with respect to the net-zero-charge proton–antiproton collisions. Last but not least, extrapolation of the strong interaction effects measured in the Z-boson production processes, to the processes of W -boson production will be more ambiguous due to an increased contribution of the bottom and charmed quarks. 2
Earlier studies of the prospects of the charge-averaged W -boson mass measurement by the CMS [4] and ATLAS [5] collaborations ignored the above LHC-colliderspecific effects and arrived at rather optimistic estimates of the achievable measurement precision at the LHC. In our view, in order to improve the precision of the Tevatron experiments, both for the average and for the charge-dependent masses of the W -boson, some novel, dedicated strategies, adapted to the LHC environment must be developed. Such strategies will have to employ full capacities of the collider and of the detectors in reducing the impact of the theoretical, phenomenological and measurement uncertainties on the precision of the W -boson mass measurement. This series of papers propose and evaluate the coherent strategies of measuring the mass of the W -boson, its width ΓW and their charge asymmetries at the LHC. In the introductory paper [6] we have proposed the strategies which optimize the use of the Z-bosons as a ‘standard candle’ for the W -boson production processes. In the present one we propose and evaluate the LHC dedicated strategy for measuring the charge asymmetry of the W -boson mass. The strategies for measuring the W -boson width, ΓW , and its charge asymmetry, and the W -boson mass under the assumption of MW + = MW − will be presented in separate papers. Such a sequence of papers reflects the order in which these measurements will, in our view, have to be done. This paper is divided into the following sections. In Section 2 the software tools which we have developed for our analysis are presented. In Section 3 the sources of the charge asymmetries in the W boson production and decay processes are discussed, with particular emphasis on their distinctive features at p p and p p¯ colliders. Our measurement strategy for the LHC is presented in Section 4. In Section 5 we present an analysis method used in quantitative evaluation of the achievable measurement precision of the W -mass charge asymmetry. Modeling of the dominant systematic errors affecting the measurement is discussed in Section 6. Their impact on the achievable precision of MW + − MW − is analysed in Section 7. Finally, in Section 8, a summary of the results and the outlook are presented.
2 2.1
Tools Monte Carlo event generator WINHAC
The main tool that has been used for the study presented in this paper is WINHAC [7, 8, 9, 10]. It is a dedicated Monte Carlo (MC) event generator for precision description of the single W -boson production and decay at hadron colliders. It has been thoroughly tested and cross-checked with independent calculations [7, 8, 11, 10]. This MC program has already been used in our previous studies of the experimental prospects for exploring the electroweak symmetry breaking mechanism and for the precision measurements of the Standard Model parameters at the LHC [12, 6]. The recent version of WINHAC, 1.30 [13], features the exclusive Yennie–Frautschi– Suura exponentiation [14] of the QED effects including the O(α) electroweak corrections for the charged-current Drell–Yan process at the parton level, see Ref. [10] for 3
more details. This parton-level process is convoluted with the parton distribution functions (PDFs) provided by the LHAPDF package [15]. This package includes a large set of recent PDF parametrisations by several groups. WINHAC has been interfaced with the Pythia 6.4 [16] MC event generator, which provides the modeling of the QCD/QED initial-state parton shower as well as the hadronisation. The current version of WINHAC does not include explicit NLO QCD corrections to the hard process matrix elements. All the QCD effects are generated by Pythia. Therefore, the QCD precision of WINHAC is of the LO-improved type, the same as of Pythia. On the other hand, the QED/EW corrections to the hard process are included in WINHAC to the accuracy of the YFS O(α) exponentiation. They are in agreement at the per-mille level with independent calculations, in particular the ones provided by the Monte Carlo programs HORACE and SANC [8, 10]. In all studies presented in this paper the QED/EW corrections have been switched off. In general, these missing corrections are as important as the missing NLO QCD corrections. Once carefully matched, all the above radiative corrections will have to be included while interpreting the future LHC W -boson data in the framework of the Standard Model. However, for the evaluation of the dedicated measurement strategies proposed in this paper they are of secondary importance. Moreover, they can be factorized out, and applied externally to the data analysis procedure. The goal to minimize them and to control them, as much as possible, experimentally will be the driving principle while defining the observables used in this paper and while optimizing their dedicated measurement procedures. The following set of collider modes have been implemented: proton–proton, proton–antiproton, proton–nucleus and nucleus–nucleus. For collisions involving nuclei the nuclear-shadowing effects [17, 18] can be switched on. The parton-level matrix elements are calculated numerically from spin amplitudes [7]. This allows for studies of the spin-dependent effects in the charged-current Drell–Yan process. For example, WINHAC provides options for separate generations of processes with pure-transversely or pure-longitudinally polarised W -bosons at the Born level. In addition to the charged-current Drell–Yan process, WINHAC includes the neutral-current Drell–Yan process (with γ + Z bosons in the intermediate state), presently at the Born level only. For a more precise description of the latter process, including the full set of the QED/EW radiative corrections, a dedicated MC event generator, called ZINHAC [19], is being developed. We plan to use these twin MC generators for precision studies/analyses of the Drell–Yan processes at the LHC. For the presented study the version 1.23 of WINHAC has been used. It is equivalent to the version 1.30 for all the aspects addressed in this paper.
2.2
Event generation, simulation and data storage
The studies reported in this paper have been performed for an integrated luminosity of 10 fb−1 . By the time of reaching such a luminosity, approximately 1.1 × 10⁸ W + 4
and 0.8 × 10⁸ W − bosons will be produced at the LHC. In order to optimize the strategy of measuring their masses, the generation and simulation of O(100) eventsamples was required. Each of these samples corresponds either to a specific bias in the detector response, or to a specific theoretical (phenomenological) modeling method of the W -boson production processes. In addition, a large set of unbiased event-samples, reflecting variable values of the masses of the W + and W − bosons, was simulated. For an assessment of the impact of the systematic biases on the overall measurement precision, each of the above event-samples must contain at least 108 events in order to match the systematic and statistical measurement precisions. The analysis presented in this paper is thus based on the total sample of O(1010 ) W -boson production events. Generating, simulating and handling of such a large event sample was a major challenge. In essence, we stored the simulated data samples in histograms, with the bin sizes adjusted to the detector resolution, rather than in the NTuple-like event summaries. This allowed us, instead of storing the Terabyte event summaries, to confine our analysis within a “laptop-size” data-storage space. The events have been simulated using a parametrised average response of the detector. In the studies presented in this paper we used the response functions of the ATLAS detector [21]. The systematic biases in the detector response have been modeled and simulated in the dedicated generation and simulation runs rather than by the re-weighting procedures. These aspects are presented in a more detail in Ref. [20].
2.3
Conventions
Both Cartesian and cylindrical coordinates are used in this paper. The beamcollision point defines the origin of the coordinate systems. Colliding beams move along the z axis, +y points upward, and +x to the center of the LHC ring. The following convention is used for the cylindrical coordinates: r is the radius in the x − y plane, φ the azimuthal angle with respect to the +x direction, and θ the polar angle with respect to the +z direction. Unit vectors along these different directions are denoted as ~ei , where i can stands for x, y, z.
3
Charge asymmetries
In this section we discuss the basic features of the charged current Drell–Yan process for the following three modes of the high-energy collisions: proton–proton (p p), proton–antiproton (p p¯) and deuteron–deuteron (d d). We analyze separately the production and decay mechanisms of the W -bosons. We compare the p p collisions with the p p¯ and d d ones in order to understand the effects specific to the proton– proton collisions. This analysis will allow us to optimise the LHC dedicated strategy for the precision measurement of the mass difference between the W + and W − bosons at the LHC. 5
3.1
Observables
We consider the charged-current Drell–Yan processes, i.e. the single W -boson production with leptonic decays at hadron colliders: (−)
p + p (p + p¯, d + d) −→ W ± + X −→ l± + νl + X ,
(1)
where l = e, µ. The commonly chosen observables for the above processes are the charged lepton transverse momentum pT,l and pseudorapidity ηl , defined as q (2) p2x,l + p2y,l , pT,l = ηl = − ln (tan(θl /2)) ,
(3)
where θl is the polar angle of the outgoing charged lepton in the laboratory frame. Although the W -boson four-momentum cannot be directly measured at hadron colliders (due to escaping neutrino), in our generator-level studies we use also the W -boson (pseudo)observables – its transverse momentum pT,W and rapidity yW : q pT,W = p2x,W + p2y,W , (4) � � EW + pz,W 1 ln yW = . (5) 2 EW − pz,W The charge asymmetry is used to scrutinize the differences between the W + and W − mediated processes. For a given scalar observable a, the charge asymmetry Asym(+,−) (a) is defined like Asym(+,−) (a) =
d σ + /d a − d σ − /d a , d σ + /d a + d σ − /d a
(6)
where + and − refer to the electric charge of the W boson, or the final state charged lepton, and d σ ± /d a is the differential cross section of an observable a. All the results discussed below have been obtained using the Born-level hard process implemented in WINHAC and convoluted with the initial-state QCD/QED parton shower generated by Pythia routines. The samples of 200 million weighted events have been generated for each of the W -boson charge. The nucleon-nucleon √ centre-of-mass energy, s, is assumed to be 14 TeV for the p p and p p¯ collisions and 7 TeV for the d d collisions.
3.2
Production of W+ and W−
In this subsection we discuss the W -boson production mechanism. The observables analysed here are: the W -boson rapidity yW , and its transverse momentum, pT,W . 6
(a), p p
(b), p p W+ − d σ/d yW [nb]
2.0 1.5 1.0
2.0 1.5 1.0
0.5
0.5
0.0 0.8
0.0 0.8
0.4 0.0 −0.4 −0.8
−5
−4
−3
−2
−1
0
1
yW
2
3
4
W+ W−
2.5
W
Asym(+,−)(yW )
Asym(+,−)(yW )
d σ/d yW [nb]
2.5
5
0.4 0.0 −0.4 −0.8
−5
−4
−3
−2
(c), p p
1
2
3
4
1.4
d σ/d pT,W [nb/GeV]
W+ − W
1.0 0.8 0.6 0.4 0.2 0.0 0.004
5
W+ W−
1.2 1.0 0.8 0.6 0.4 0.2 0.0
Asym(+,−)(pT,W )
d σ/d pT,W [nb/GeV] Asym(+,−)(pT,W )
0
yW
(d), p p
1.2
0.002 0.000 −0.002
−0.004 0
−1
10
20
30
40
pT,W [GeV]
50
60
70
0.155 0.150 0.145 0.140 0.135 0
10
20
30
40
pT,W [GeV]
50
60
70
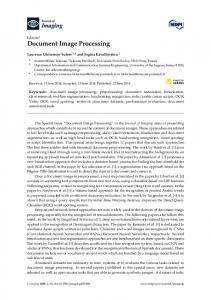
Figure 1: The rapidity yW and transverse momentum pT,W distributions of the W -bosons and their charge asymmetries for the p p¯ (a, c) and p p (b, d) collisions.
In Fig. 1 we present their distributions for the W + - and W − -bosons, as well as their charge asymmetries for the two collision modes: p p¯ and p p. In the p p¯ collisions the total production cross-sections and its pT,W distribution are independent of the W -boson charge. The rapidity distributions for two charge states are mirror reflected for positive and negative rapidities. This is illustrated in the left-hand-side (LHS) plots, (a) and (c). The right-hand-side (RHS) plots, (b) and (d), show the corresponding distributions for the p p collisions. In this case the rapidity distributions are symmetric w.r.t. yW = 0. Their shapes, however, are different for the W + and W − bosons. This reflects mainly the difference in the valence u and d quark content of the proton. The yW distribution for the W + -bosons is higher, wider and flatter with respect to the one for the W − -bosons because there are twice as many the valence u quarks as the valence d quarks, and the former carry, on average, a higher fraction of the parent proton momentum. The charge asymmetry of the pT,W distribution reflects the differences in the relative cross-sections but also, what will be crucial for the studies 7
presented in this paper, in the shape of their distributions. The nontrivial shape of the asymmetry of the pT,W distribution reflects the flavour asymmetries in the distributions of quarks producing the W + and W − bosons. The latter are predominantly driven by the u–d quark asymmetries and are amplified by the non-equality of the s- and c-quark masses. We analyze the flavour structure of the W -bosons charge asymmetries by writing explicitly the simplified Born-level formulae for the total cross-section asymmetries for three types of collisions: p p¯, p p and d d: � (7) σ + − σ − p p¯ (s) = 0, Z n � � � ¯ q¯) − d(v) (xq ) u¯(xq¯) σ + − σ − p p (s) ∝ dxq dxq¯ |Vud |2 u(v) (xq ) d(x � � + u(v) (xq ) |Vus |2 s¯(xq¯) + |Vub |2 ¯b(xq¯) o 2 (v) − |Vcd | d (xq ) c¯(xq¯) σqq¯(ˆ s), (8) Z � � σ + − σ − d d (s) ∝ dxq dxq¯ u(v) (xq ) |Vus |2 s¯(xq¯) − |Vcd |2 c¯(xq¯) � s). (9) + |Vub |2 ¯b(xq¯) σqq¯(ˆ In these formulae d, u, s, c, b on the RHS denote the PDFs of the corresponding quark flavours and the superscript (v) stands for valence, Vij is the CKM matrix element for the i and j flavours, while σqq¯(ˆ s) is the parton-level cross section for the W -boson production with sˆ = xq xq¯s. In the formulae for the d d collisions we assumme the isospin symmetry in the valence quark sector: u(v) = d(v) . For pedagogical reasons, the formulae for the p p and d d collisions are simplified. We have omitted the explicit dependence of the PDFs on the factorisation scheme, on the the transverse momenta kT of annihilating partons present both in the “kT -unintegrated” PDFs, and in the partonic cross-sections (via kT dependence of sˆ). All the above effects have been taken into account in our Monte-Carlo studies. In our analysis partons have both the primordial transverse momenta and the perturbatively generated ones as modeled by the initial-state parton shower of the Pythia generator. Their transverse momenta depend on the Bjorken x of the annihilating quark (antiquark) and, for heavy quarks (here c and b), also on their masses (see Ref. [16] for more details). As one can see from the above equations, the charge asymmetry disappears for the p p¯ collision mode (if, as assumed in the presented studies, the masses of W + and W − bosons are equal). This collision mode is thus the optimal one for measuring MW + − MW − . Any deviation from the equality of masses would result in non-zero asymmetries, regardless of the level of understanding of the flavour and momentum structure of the beam particles. For the p p collision mode several effects, reflecting the present understanding of the partonic content of the beam particles (in particular, the understanding of the momentum distribution of valence quarks), contribute to the charge asymmetry of the pT,W distribution and may mimic the MW + 6= MW − effects. For the d d collisions the asymmetry is particularly simple. It is driven by the 8
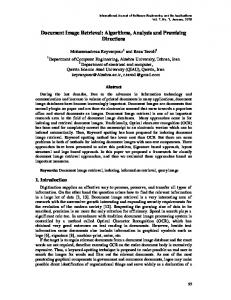
Cabibbo-suppressed difference of the distribution of the strange and charm quarks, weighted by the distributions of the valence quarks. We have introduced to our discussion the d d collision mode at this point in order to analyze the relative importance of the valence quark and ‘s − c’ effects. In the following, we analyze the numerical importance of various terms appearing in the above equations. The results of our studies are presented in Fig. 2. In the first plot, (a), we compare the charge asymmetry in the transverse momentum of the W -bosons for the p p collision mode (solid line) with the one for the p p¯ collision mode (dash-dotted line). The charge asymmetry for p p collision mode is large and varies as a function of pT,W . The next plot, (b), shows the comparison of the p p asymmetry from the previous plot (solid line) with the one in which the protons contain only u and d quarks (dashed line). The observed increase of the asymmetry in the latter case indicates that the charge asymmetry for the p p collisions is driven mainly by the u and d quarks (the presence of the s and c quarks diminishes slighty its magnitude). In the plot (c) we demonstrate that this asymmetry is slightly reduced when u(v) = 2d(v) , i.e. when the valence u and d quark PDFs are assumed to have the same shape and differ only by the normalisation factor corresponding to their numbers in the proton (dotted line). In addition, we note that the asymmetry becomes flatter as a function of pT,W , indicating the role of the relative x-shapes of the u and d quarks PDFs. The asymmetry is reduced drastically when we put u(v) = d(v) (dash-dotted line), as it would be the case for the isoscalar beams. Therefore, in the following plots we analyze the simplest isoscalar beam-collision mode, the d d one. The plot (d) shows that the charge asymmetry for d d (solid line) is much smaller than the one for p p (dash-dotted line). This results from two facts: (1) all the terms contributing to the charge asymmetry for d d include the off-diagonal CKM matrix elements and (2) contributions of the s, c and b quark PDFs are smaller than the ones from the u and d sea-quark PDFs. The remaining asymmetry is at the level of 0.002, as can be seen in the plot (e) (solid line), and it can be reduced to a statistically negligible level when we set c = s and b = 0 (dashed line). The last plot, (f), shows the effect of the deviation of the charge asymmetry due to the difference of the masses and of the momentum distributions of the strange and charm quarks in the extreme case corresponding to c = 0 (dotted line). The asymmetry is flat but significantly higher, at a level of 0.015. It is a factor of ∼ 10 bigger than the asymmetry for the d d collisions assuming the present understanding of the relative asymmetry in the distribution of the strange and charm quarks. In the analysis presented so far the pT,W distribution have been integrated over the full range of kinematically allowed xq and xq¯. In order to optimise the measurement strategy of the W -mass charge asymmetry, we now discuss the pT,W distributions restricted to the selected kinematical regions. The most obvious method to reduce the contributions of the valence quarks is to restrict the analysis to the yW ∼ 0 region, where xq ∼ xq¯ ≈ 6 × 10⁻³ , i.e. where the valence quarks are largely outnumbered by the sea quarks. 9
(a)
(d) 0.15
Asym(+,−)(pT,W )
Asym(+,−)(pT,W )
0.15
0.10 pp pp 0.05
0.00 0
10
20
30 40 pT,W [GeV]
50
60
0.10 dd pp 0.05
0.00 0
70
10
20
(b)
30 40 pT,W [GeV]
0.003
70
dd d d (c = s, b = 0)
0.002 Asym(+,−)(pT,W )
Asym(+,−)(pT,W )
60
(e)
0.20
0.18 pp p p , only u and d 0.16
0.001 0.000
−0.001 −0.002
0.14 0
50
10
20
30 40 pT,W [GeV]
50
60
−0.003 0
70
10
20 30 pT,W [GeV]
(c)
40
50
(f) 0.020
0.20
Asym(+,−)(pT,W )
Asym(+,−)(pT,W )
0.015 0.15 p p , only u and d p p , only u and d with u(v) = 2d(v) p p , only u and d with u(v) = d(v)
0.10
0.05
0.010
d d (c = s, b = 0) d d (c = b = 0)
0.005 0.000
0.00 0
10
20
30 40 pT,W [GeV]
50
60
70
0
10
20
30 40 pT,W [GeV]
50
60
70
Figure 2: The charge asymmetries for pT,W : p p vs. p p¯ (a), p p vs. p p (u and d quarks only) (b), p p (u and d quarks only) vs. p p (u and d quarks only and u(v) = 2 d(v) )(c), d d vs. p p (d), d d vs. d d (c = s and b = 0) (e), and finally d d (c = s and b = 0) vs. d d (c = b = 0) (f).
In Fig. 3 we present the asymmetries for the p p and d d collisions for the narrow central bins: (1) in the W rapidity, (a), and (2) in the lepton pseudorapidity, (b). In the plot (a) we see that the p p charge asymmetry is reduced and flattened by more than a factor of 3 for the range of the W -boson rapidity yW < 0.3. Unfortunately 10
(a)
(b)
0.15
0.10
Asym(+,−)(pT,W )
Asym(+,−)(pT,W )
0.15
p p inclusive p p |yW | < 0.3 d d inclusive
0.05
0.00 0
10
20
30 40 pT,W [GeV]
50
60
70
0.10
0.05
0.00 0
p p inclusive p p |ηl | < 0.3 d d inclusive d d |ηl | < 0.3
10
20
30 40 pT,W [GeV]
50
60
70
Figure 3: The charged asymmetries of pT,W for inclusive p p, d d collisions and with cuts : |yW | < 0.3 for pp (a) and |ηl | < 0.3 for p p and d d (b).
yW cannot be measured directly. It is thus natural to check if comparable reduction can be obtained using the ηl variable, which is correlated with yW . This turns out not be the case, as can be seen in plot (b). The ηl variable has thus significantly lower discriminative power to reduce the valence quark contribution with respect to the yW variable. For the d d collision the asymmetry restricted to the narrow ηl bin increases considerably. This observation draws out attention to the fact that the asymmetry in a decay mechanism of the W + and W − bosons will have an important impact on the asymmetry of leptonic observables. This is discussed in detail in the next section. There can also be a contribution to the charge asymmetry coming from the QED radiation from quarks, as upper and lower components of the SU (2)L quarkdoublets have different electric charges. However, it has been found (with Pythia) to be of the order of 2.5×10⁻⁴ in the Asym(+,−) (pT,W ) spectra, which is insignificant as compared to the above shown contributions to the asymmetries for p p and d d. Another contribution to the charge asymmetry may come from the missing NLO QCD corrections. These corrections are large for the pT,W distributions, but of residual importance for the charge asymmetries, in particular in the kinematical region used in the determination of the masses of the W + and W − bosons. This will be discussed further in Section 6.1.5.
3.3
Decays of W+ and W−
In this subsection we analyze the W -boson decay mechanism and see how it influences the charge asymmetries in the lepton transverse momentum pT,l and pseudorapidity ηl distributions. The distributions of ηl and pT,l as well as their charge asymmetries for the p p¯ and p p collisions are shown in Fig. 4. As can be seen in the LHS plots, in the p p¯ 11
(a), p p
(b), p p
3.0
W+ − W
d σ/d ηl [nb]
2.5
2.0 1.5 1.0
2.0 1.5 1.0
0.5
0.5
0.0 0.8
0.0 0.8
Asym(+,−)(ηl )
Asym(+,−)(ηl )
d σ/d ηl [nb]
2.5
0.4 0.0 −0.4 −0.8
−6
−4
−2
0
2
ηl
4
W+ W−
3.0
6
0.4 0.0 −0.4 −0.8
−6
−4
−2
d σ/d pT,l [nb/GeV]
W
0.6 0.4 0.2 0.0 0.004
4
6
W+ W−
0.8 0.6 0.4 0.2 0.0
0.002 0.000 −0.002
−0.004 0
2
(d), p p W+ −
Asym(+,−)(pT,l )
Asym(+,−)(pT,l )
d σ/d pT,l [nb/GeV]
(c), p p
0
ηl
10
20
30
pT,l [GeV]
40
50
60
0.25 0.20 0.15 0.10 0
10
20
30
pT,l [GeV]
40
50
60
Figure 4: The pseudorapidity ηl and transverse momentum pT,l distributions for charged leptons produced in W -boson decays for the p p¯ (a,b) and p p (c,d) collisions.
case the pT,l distributions for positive and negative charges remain identical, while the ηl ones are mirror reflected w.r.t. ηl = 0. This behaviour is thus similar to the behaviour of the W -boson observables, discussed in the previous subsection. For the p p collisions the charge asymmetries (the RHS plots) are larger than those for the W -boson kinematical variables. The increase of asymmetry in the above plots can be explained by the V − A couplings of the W -bosons to leptons. The angular distributions of the final-state leptons in the W -boson rest frame (WRF) can be expressed as follows: �2 Q ∗ ∗ , (10) d σ WT /d cos θW,l ∝ 1 + λ Q cos θW,l Q
∗ ∗ d σ WL /d cos θW,l ∝ sin2 θW,l ,
(11)
∗ where θW,l is the charged lepton polar angle w.r.t. the W momentum direction in the laboratory frame, Q is the W -boson electric charge in units of |e| and λ = 0, ±1 is the W -boson helicity eigenvalue. As can be seen, the angular distributions of l+ and l− for longitudinally polarised W -bosons (WL for λ = 0) are the same. For the
12
transversely polarised W -bosons (WT for λ = ±1), they depend upon the W -boson helicity eigenvalue. Positively charged leptons, coming from the decays of the lefthanded W -bosons (λ = −1)), are emitted preferentially in the directions opposite to those of the parent W -bosons, while negatively charged leptons, emitted by the lefthanded W -bosons, tend to retain the direction of their parents. The distributions for the right-handed W -bosons (λ = +1) decays show the opposite behaviour. yW
−6
−4
(a), p p, |yW | < 0.3 −2
0
2
4
yW
6
W+ W−
(b), p p, 3.5 < |yW | < 4.5
−6
−4
−2
0
−6
−4
−2
ηl
0
2
4
−6
−4
−2
0
2
4
2
4
6
W+ W−
0.75
d σ/d ηl [nb]
d σ/d ηl [nb]
0.50
0.25
0.50
0.25
d σ/d pT,l [nb/GeV]
yW
−6
−4
−2
ηl
0
2
4
6
−6
−4
−2
0
2
4
6
0.00
yW
W+ −
0.06
d σ/d pT,l [nb/GeV]
0.00
W 0.04 0.02
0.06 0.04 0.02 0
6
W+ W−
0.10 0.08 0.06 0.04 0.02 0.00
Asym(+,−)(pT,l )
Asym(+,−)(pT,l )
0.00
0.12
6
10
20
30
pT,l [GeV]
40
50
60
0.7 0.6 0.5 0.4 0
10
20
30
pT,l [GeV]
40
50
60
Figure 5: The distributions of ηl and pT,l for the two different ranges of the W rapidity: (a) |yW | < 0.3 and (b) 3.5 < |yW | < 4.5, for the p p collisions.
Each colliding mode and each centre-of-mass energy determine the specific, W boson rapidity-dependent polarisation asymmetry. The LHC-specific effective polarisation asymmetry of the produced W -bosons will drive the observed charge asymmetries of the leptonic observables in a more complicated way than in the case of the Tevatron. The magnitude of this contribution and its phase-space dependence is illustrated in Fig. 5, where the ηl and pT,l distributions in the two distinct W -boson rapidity regions, corresponding to small and high |yW | values, are shown. In the region of |yW | < 0.3 (LHS plots), the W -bosons are produced from quarks–antiquark pairs having xq ∼ xq¯ ≈ 6 × 10⁻³ . In this x-region the contribution of the valence 13
quarks is small and, as a consequence, the relative yields of the left-handed and the right-handed W -bosons are almost equal. In this kinematical region the asymmetries in the W -production observables are hardly modified while switching to the lepton observables. In the region of 3.5 < |yW | < 4.5 the W -bosons are produced predominantly by the annihilation of the valence quarks with the sea antiquarks. The majority of the W -bosons in this kinematical region is left-handed because they are produced predominantly by the left-handed valence quarks and because, in most cases, they follow the initial direction of the valence quarks. As a result, the negative leptons are emitted predominantly in the direction of the W -bosons, while the positive ones in the opposite direction. The Lorentz-boost from the WRF to the laboratory frame increase the pseudorapidity of l− and decrease the pseudorapidity of l+ , with respect to the W -boson rapidity. In the upper RHS plot the shadowed bands represent the yW regions for selected events. The observed differences between these bands and the corresponding ηl distributions for the positive and negative leptons explain the widening of the ηl spectrum of l− and narrowing that for l+ , observed in Fig. 4. This plot demonstrates that ηl has significantly weaker resolution power for the momenta of annihilating quarks than yW , and, as a consequence, weaker resolving power of the W -boson polarisation. If the W -bosons were produced with zero transverse momentum, the V − A decay effect, discussed above, would not contribute to the charge asymmetries in the distributions of the transverse lepton momentum and would play no role in the measurement of the charge asymmetry of the W -boson masses. In reality, the increase of the transverse momenta of the W -bosons produced at large rapidities amplifies the impact of the W -boson polarisation asymmetry on the charge asymmetry of its decay products. All the above effects have important consequences for the measurement strategies presented in this paper. They will give rise to important measurement biases which are absent in the p p¯ collision mode but will show up in the measurement of the W -boson properties in the LHC p p collision mode. In order to illustrate qualitatively the impact of these effects on the measurement of MW + and MW − from the position of the Jacobian peaks in the pT,l distributions, we have made local-parabola fits in the range 37 GeV < pT,l < 40 GeV, for the generated samples of the W -bosons produced in the p p and p p¯ collisions. These events have been generated under the assumption MW + = MW − . The fits have been performed in two ηl regions: |ηl | < 0.3 and 3.5 < |ηl | < 4.5. While the peak position is lepton-charge independent for the p p¯ collision mode, in the case of the p p collision mode, the differences in the peak positions are −230 MeV and +1900 MeV for, respectively, |ηl | < 0.3 and 3.5 < |ηl | < 4.5 bins. All the effects contributing to such shifts will have to be understood to a percent level if one wants to improve the measurement precision achieved at the Tevatron collider. To summarize, the difference between the positive and negative lepton pT,l spectra at the LHC result from the interplay of the following three effects: 14
• the presence of the valence quarks leading to the dominance of the left-handed W -bosons with respect to the right-handed ones, • the non-zero transverse momentum of the W -bosons,
• the V − A couplings of the W -bosons to fermions in electroweak interactions.
These differences will depend strongly on the choice of the kinematical region used in the analysis. If expressed in terms of leptonic variables, the differences are amplified due to induced biases in the effective x-regions of partons producing positively and negatively charged W -bosons. As these differences could mimic the asymmetry in the masses of positively and negatively charged W -bosons, all these effects must be controlled to a high precision and/or, as advocated in this paper, eliminated by using the LHC-dedicated measurement strategy. These aspects are presented in with more details in Ref. [20].
4 4.1
Measurement strategies Observables
The values of the W + and W − boson masses can be unfolded from the measured lepton-charge-dependent distributions of pT,l and/or from the transverse mass of the lepton-neutrino system, mT, l νl . In this paper we discuss only the methods based on the measurement of pT,l . These methods are almost insensitive to the detector and modelling biases in the reconstructed values of the neutrino transverse momentum, pT,ν . We are aware that, for the measurement of the average mass of the W -boson, this merit is outbalanced by the drawback of their large sensitivity to the precise understanding of the distribution of the W -boson transverse momentum, pT,W . However, for the measurement of the charge asymmetry of the masses this is no longer the case because QCD radiation, which drives the shape of the pT,W distribution, is independent of the charge the produced W -boson. In our view the pT,l -based methods will be superior with respect to the mT, l νl -based ones, in particular for the first measurements of the W -mass charge asymmetries at the LHC. The most natural method is to analyze separately the l+ and l− event-samples and determine independently the masses of the W + and W − -bosons. This method is based on independent measurements of the d σ/d pT,l+ and d σ/d pT,l− distributions. It will be called hereafter the classic method. A new method proposed and evaluated in this paper is based on the measurement of the Asym(+,−) (pT,l ) distribution. This method will be called hereafter the charge asymmetry method. The distribution of Asym(+,−) (pT,l ) is, by definition, robust with respect to those of systematic measurement effects and those of modeldependent effects that are independent of the lepton charge. The acceptance, and the lepton-selection efficiency corrections for this observable will, in the leadingorder approximation, reflect only their lepton-charge-dependent asymmetries. In 15
addition, the Asym(+,−) (pT,l ) observable is expected to be robust with respect to the modeling uncertainty of the QCD and QED radiation processes. If extrapolated from the experience gained at the Tevatron, the precision of the charge asymmetry method will be limited by the understanding of relative biases in the reconstructed transverse momenta for positively and negatively charged particles. These biases, contrary to the lepton-charge averaged biases, cannot be controlled using the J/ψ, Υ, Z ‘standard candles’. The third measurement method proposed and evaluated in this paper is based on the double charge asymmetry defined as i 1h (+,−) (+,−) AsymB=B (ρ ) + Asym (ρ ) , (12) DAsym(+,−) (ρl ) = l l ~ ~ ~ez B=−B ~ez 2 where the variable ρl , defined as ρl = 1/pT,l , represents the radius of the track curvature at the W -boson production vertex in the plane xy perpendicular to the beam collision axis, and B is the strength of the magnetic field. The DAsym(+,−) (ρl ) distribution is expected to be robust with respect to the charge dependent track measurement biases if the following two conditions are fulfilled: (1) the inversion of the z-component of the magnetic field in the tracker ~ ×B ~ relative correcvolume can be controlled to a requisite precision, (2) the E tions to the reconstructed hit positions for the two magnetic field configurations, in the silicon tracker could be determined to a requisite precision. The measurement method using the DAsym(+,−) (ρl ) distribution will be called hereafter the double charge asymmetry method.
4.2
The machine and the detector settings
The primary goal of the LHC experiments is to search for new phenomena at the highest possible collision energy and machine luminosity. It is obvious that, initially, the machine and the detector operation modes will be optimised for the above research program. The main target of the work presented in this paper is to evaluate the precision of the measurement of the W -mass charge asymmetry which is achievable in such a phase of the detector and machine operation. A natural extension of this work is to go further and investigate if, and to which extent, the precision of measurement of the Standard Model parameters could be improved in dedicated machine- and detector-setting runs. In our earlier work [6] we discussed the role of: (1) dedicated runs with reduced beam collision energies, (2) dedicated runs with isoscalar beams and (3) runs with dedicated detector-magneticfield settings; in optimizing the use of the Z-boson production processes as a ‘standard candle’ for the W -boson processes. In this paper we shall discuss the possible improvement in the measurement precision of the charge asymmetry of the W -boson mass which can be achieved (1) by replacing the proton beams with light isoscalarion beams, and (2) by running the detectors for a fraction of time with the inversed direction of the solenoidal magnetic field. These and other dedicated operation 16
modes could be tried in the advanced, ‘dedicated-measurement phase’ of the LHC experimental program. Such a phase, if ever happens, could start following the running period when the collected luminosity will become a linear function of the running time and the gains/cost ratio of its further increase will be counterbalanced by the gains/cost ratio of running dedicated machine and detector operation modes.
4.3
Event selection
The W -boson production events used in our studies are selected by requiring the presence of an isolated lepton, an electron or a muon, satisfying the following requirements: pT,l > 20 GeV and |ηl | < 2.5. (13) In the CDF experiment [3] the additional requirement of the reconstructed total missing transverse energy in the detector, E / T ≥ 30 GeV, allowed to reduce the contribution of the background processes to a sufficient level such that the resulting uncertainty of the measured mass of the W -boson was negligible with respect to other sources of systematic errors. In our studies we assume that by using a suitable E / T cut the impact of the uncertainty in the background contribution on the measurement of the charge asymmetry of the W -boson mass at the LHC can be made negligible. This allows us to skip the generation and simulation of the background event-samples for our studies. It has to be stressed, that the above assumption is weaker for the measurement of the charge asymmetry than for the measurement of the average W -boson mass [5, 4] because, to a good approximation, only the difference of the background for the positive and negative lepton samples will bias the measurement. Presentation of the results of our studies is largely simplified by noticing that they are insensitive to the presence of the E / T cut in the signal samples. Therefore, we present the results based on selection of events purely on the basis of the reconstructed charged lepton kinematical variables. Our studies have shown that these results will remain valid whatever a value of the E / T cut will be used at the LHC to diminish the impact of the background contamination at the required level of precision. In Fig. 6 we show the distributions of d σ/d pT,l and Asym(+,−) (pT,l ) for: (1) the generated and unselected sample of events, (2) the generated and selected sample of events and (3) the unbiased-detector-response-simulated and selected sample of events. Analysis of the systematic biases affecting these distributions will allow us to evaluate the precision of the measurement methods discussed in this section.
5
The analysis method
In this section we present the technical aspects of the analysis method used in evaluation of the achievable precision of the measurement of the charge asymmetry of the W -boson masses, MW + − MW − , denoted sometimes for convenience as ∆(+,−) . 17
(b), pT,l distribution for W −
(a), pT,l distribution for W + 0.6
0.7 0.6 0.5 0.4 0.3 0.2 0.1 0.0 20
0.5
d σ −/d pT,l [nb/GeV]
d σ +/d pT,l [nb/GeV]
0.8
0.4 0.3 0.2 0.1
Generator level Generator level ⊗ Cuts Generator level ⊗ Cuts ⊗ Smearing 30
40
pT,l [GeV]
50
0.0 20
60
Generator level Generator level ⊗ Cuts Generator level ⊗ Cuts ⊗ Smearing 30
40
pT,l [GeV]
50
60
(c), Charge asymmetry of pT,l Asym(+,−)(pT,l )
0.30
Generator level Generator level ⊗ Cuts Generator level ⊗ Cuts ⊗ Smearing
0.25 0.20 0.15 0.10 20
30
40
pT,l [GeV]
50
60
Figure 6: The pT,l distributions for the positive (a) and negative (b) leptons and Asym(+,−) (pT,l ) (c) at the generator level, after the cuts (pT,l > 20 GeV and |ηl | < 2.5), and finally, by adding the inner detector smearing.
The shapes of the distribution shown in Fig. 6 are sensitive to: (1) the assumed values of MW + and MW + , (2) the values of the other parameters of the Standard Model, (3) the modeling parameters of the W -boson production processes and (4) the systematic measurement biases. Our task is to evaluate the impact of the uncertainties of (2), (3) and (4) on the extracted values of MW + and MW − for each of the proposed measurement methods. We do it by a likelihood analysis of the distributions for the pseudo-data (PD) event-samples and those for the mass-template (MT ) event-samples. Each of the PD samples represents a specific measurement or modeling bias, implemented respectively in the event-simulation or event-generation process. Each of the MT samples was generated by assuming a specific MW + (MW − ) value or a value of their charge asymmetry, ∆(+,−) . The MT samples are simulated using the unbiased detector response and fixed values of all the parameters used in the modeling of the W -boson production and decays except for the mass parameters. The likelihood analysis, explained below in more detail, allows us: (1) to find out
18
which of the systematic measurement and modeling errors, could be falsely absorbed into the measured value of the W -boson masses and (2) to evaluate quantitatively the corresponding measurement biases.
5.1
Likelihood analysis
Let us consider, as an example, the impact of a systematic effect, ξ, on the bias in the measured value of the W + mass determined from the likelihood analysis of the d σ/d pT,l+ distributions. The simulation of the pseudo-data event sample, PD, representing a given sysref tematic bias ξ, is carried out for a fixed value of the mass MW + . Subsequently, a set of the 2k + 1 unbiased (i.e. ξ = 0) template data samples, MT , is simulated. Each (n) (n) ref sample n of the MT set corresponds to a given value of MW + = MW + + δMW + , n = −k, . . . , k. The likelihood between the binned d σ/d pT,l+ distributions for the nth MT sample and the ξ-dependent PD sample is quantified in terms of the χ2 value: X (d σi; ξ − d σi; ξ=0,n )2 2 χ (pT,l+ ; ξ, n) = , (14) ∆d σi;2 ξ + ∆d σi;2 ξ=0,n i where d σi is the content of the ith bin of the d σ/d pT,l+ histogram and ∆d σi is the corresponding statistical error. The bulk of the results presented in this paper has been obtained using a bin size corresponding to σ of the anticipated measurement resolution of the track curvature [22] and the summation range satisfying the following condition: 30 GeV < pT,l < 50 GeV. (n) The χ2 (pT,l+ ; ξ, n) dependence upon δMW + is fitted by a polynomial of second order. The position of the minimum, MW + (ξ)min , of the fitted function determines ref the systematic mass shift ∆MW + (ξ) = MW + (ξ)min − MW + due to the systematic effect ξ. If the systematic effect under study can be fully absorbed P by a shifted value + 2 of W , then the expectation value of χmin /dof, where dof = i , is equal to 1 and the error of the estimated value of the mass shift, δ (∆MW + (ξ)), can be determined from the condition χ2 (MW + (ξ)min + δ (∆MW + (ξ))) = χ2min + 1. Of course, not all the systematic and modeling effects can be absorbed into a variation of a single parameter, even if the likelihood is estimated in a narrow bin-range, purposely chosen to have the highest sensitivity to the mass parameters. In such a case the value of χ2min /dof can be substantially different from 1, and δ (∆MW + (ξ)) looses its statistical meaning. This can partially be recovered by introducing supplementary degrees of freedom (the renormalisation of the PD samples, discussed in this section, is an example of such a procedure). However, even in such a case the estimated value of δ (∆MW + (ξ)) will remain dependent upon the number of the MT samples, 2k + 1, their MW + spacing in the vicinity of the minimum and the functional form of the fit. Varying these parameters in our analysis procedure in a ξ-dependent manner would explode the PC farm CPU time and was abandoned. Instead, we have calibrated the propagation of statistical bin-by-bin errors into the 19
δ (∆MW + (ξ)) error, and checked the biases of all the aspects of the above method using the statistically independent “PD-calibration samples” in which, instead of varying the ξ effects, we varied the values of MW + .
5.2 5.2.1
The MT and PD event samples Classic method
In the classic method the bias of ∆(+,−) (ξ) resulting from the systematic effects ξ is determined in the following three steps: 1. We determine ∆MW + (ξ) ± δ (∆MW + (ξ)) using χ2 (d σ + /d pT,l ; ξ). 2. We determine ∆MW − (ξ) ± δ (∆MW − (ξ)) using χ2 (d σ − /d pT,l ; ξ). 3. We combine these results and derive: ∆(+,−) (ξ) = ∆MW + (ξ) − ∆MW − (ξ).
(15)
ref ref In the generation of the PD samples we assumed MW + = MW − = 80.403 GeV. (n) (n) The MT samples have been generated for: δMW + = δMW − = n × 5 MeV with (n) (n) n = ±1, . . . , ±6 and for δMW + = δMW − = ±40, ±50, ±75, ±100, ±200 MeV with n = ±7, . . . , ±11. In total 46 MT samples, corresponding to k = 11, have been generated.
5.2.2
Charge asymmetry method
In this method the biases ∆(+,−) (ξ) resulting from the systematic effects are determined by a direct analysis of the Asym(+,−) (pT,l ) distributions for the MT and PD event samples. The only difference with respect to the classic method is that the MT samples used in our studies represent the variation of the ∆(+,−) values rather than uncorrelated variations of MW + and MW − . The charge asymmetry method was first verified using two charge-symmetric procedures. In the first one the variation ref of ∆(+,−) was made by fixing MW + = MW + and by changing MW − . In the second one we inverted the role of MW + and MW − . The results obtained with these two charge-symmetric methods were found to agree within the statistical errors. The first measurement of the charge asymmetry of the W -boson masses at the LHC will have to use, as the first iteration step, the best existing constraints on the W -boson masses. The best available constraint is the average mass of the W + and ref W − bosons: MW = MW . To mimic the way how the measurement will be done at ref the LHC, we thus fixed the MW = MW value and varied, in a correlated way, both + − the MW and MW values when constructing the ∆(+,−) -dependent MT samples.
20
5.2.3
Double charge asymmetry method
The MT event samples for this methods are exactly the same as for the charge asymmetry method. The PD event samples have been simulated in two steps corresponding to the two half-a-year periods of data taking with the two magnetic field configurations. The procedures discussed above are illustrated in Fig. 7 for the case of the charge asymmetry method. The Asym(+,−) (pT,l ) distribution is plotted in Fig. 7a as a function of pT,l for three values ∆(+,−) . This plot illustrates the sensitivity of the Asym(+,−) (pT,l ) distribution to the ∆(+,−) value. In Fig. 7b the χ2 variable is plotted for the PD-calibration sample corresponding to ∆ref (+,−) = 0 and to an unbiased detector response, as a function of ∆(+,−) . The position of the minimum is ∆(+,−) (ξ = 0) = (1 ± 4 )MeV and the corresponding χ2min /dof = 0.82. This plot illustrates the calibration procedure. It shows that no systematic biases are introduced by the proposed analysis method. It calibrates the statistical precision of the measurement for the integrated luminosity of 10 fb−1 . Our goal will be to estimate the systematic biases of in the measurement of ∆(+,−) with the comparable precision. (a), Asym(+,−) (pT,l ) PD : ∆(+,−) = 0 MT : ∆min (+,−) = −200 MeV MT : ∆max (+,−) = +200 MeV
0.20
PD PD Asym(+,−)(pT ,l) :MW + = MW −
2500
0.15
2000
χ2
Asym(+,−)(pT,l )
(b), χ2 results for Asym(+,−) (pT,l ) 3000
0.10
1000
MW + − MW − %
0.05
1500
500
dof = 100 0.00
30
35
40
pT,l [GeV]
45
0 −200 −150 −100
50
−50
0
50
MW + − MW − [MeV]
100
150
200
Figure 7: The charge asymmetry of pT,l for the three values of ∆(+,−) : −200, 0, + 200 MeV (a) and the χ2 dependence (MT points and their the polynomial fit) of ∆(+,−) (b).
5.3
Scaling distributions for quarks flavors systematics
Most of systematic measurement and modeling biases discussed in this paper lead to a distortion of the distributions and do not change their overall normalisation. The notable exception, discussed in more detail in the next section, are the biases driven by the PDFs uncertainties. These biases cannot be ‘absorbed’ by the corresponding ∆(+,−) (ξ) shifts and require an adjustment of the event/nb normalisation of the corresponding PD samples to obtain acceptable χ2 values. 21
The most natural method would be to extend the one-dimensional analysis presented in this section into two-dimensional analysis of both the mass and the normalisation parameters. Such an analysis would have, however, ‘square’ the necessary computing time of the MT samples and, therefore, was not feasible in our timescale. Instead, we have tried to ‘uncorrelate’ the adjustment of the normalisation parameter and the mass parameters. As shown in Fig. 7a, the Asym(+,−) (pT,l ) distribution is, in the region of small pT,l , independent of the variations of ∆(+,−) over the range discussed in this paper. We use this observation and modify correspondingly the likelihood analysis method. Before calculating χ2 , the PD and MT distributions are integrated as follows: ! Z 35 GeV d Asym(+,−) , (16) d pT,l d pT,l 20 GeV giving, respectively, two scalars: α and β(n). Then we re-normalize the MT distributions by factors α/β(n) and calculate the χ2 values for the rescaled distributions. We have checked that the above procedure improves significantly the resulting χ2 values for each of the three analysis methods. By changing the integration region we have verified that the above procedure does not introduce significant biases in the estimated ∆(+,−) (ξ) values.
6
Systematic error sources
In this section we identify and model the systematic error sources that will limit the precision of the MW + − MW − measurement at the LHC. Each of these errors sources will be modeled and reflected in the corresponding PD sample of events. These error sources are of two kinds: (1) those reflecting uncertainties in modeling of the W -boson production and decay processes, (2) those reflecting the event selection and event reconstruction biases. A large fraction of the error sources have been identified [3] and reevaluated in the context of the measurement of the average mass of the W -boson at the LHC [5, 4]. In this paper we focus our discussion on the dominant errors for the measurement of the W -mass charge asymmetry, in particular on those that are specific to the LHC environment and have not been identified in the earlier studies. We shall not discuss here: (1) the measurement errors reflecting the uncertainties in the background estimation and in the efficiency of the events selection, (2) other measurement uncertainties which can be studied to the required level of precision only once the real data are collected. As demonstrated in the analysis of the Tevatron data [3], they are of secondary importance. A more complete presentation of the analysis of the error sources and their modeling is given in Ref. [20].
22
6.1
Modeling uncertainties
The uncertainties in modeling of the production and decay of the W -bosons include: (1) the uncertainties in modeling of nonperturabative effects, (2) the approximations present in theoretical modeling of the perturbative EW and QCD effects, (3) the uncertainties in the parameters of the Standard Model, and (4) a possible presence of the “Beyond-the-Standard-Model” (BSM) effects, affecting both the production and decay mechanisms of the W -bosons. The first two of them limit our present understanding of the Wide-Band-partonic-Beam (WBpB) at the LHC. 6.1.1
WBpB at LHC
The measurement precision of the W -mass charge asymmetry will depend upon the level of understanding of the flavour structure, the momentum spectrum and the emittance of the WBpB at the LHC collision energy. The hard-scale dependent emittance of the WBpB is defined here, in analogy to the emittance of the parent hadron beam, in terms of its transverse momentum distribution and in terms of its transverse and longitudinal beam-spot sizes. The above dynamic properties of the WBpB are highly correlated. Only their scale dependence can be controlled by the Standard Model perturbative methods. In addition, several aspects of such a control, in particular the precise modeling of the correlations between the flavour, the longitudinal and the transverse momentum degrees of freedom of the WBpB have not so far been implemented in the Monte-Carlo generators available for the initial phase of the LHC experimental program. The present ‘folklore’ of understanding of the WBpB at the LHC is driven by the presently available Monte Carlo (MC) generator tools. Within this ‘folklore’, the flavour-dependent longitudinal momentum distribution of the WBpB, specified by ‘collinear’ PDFs, is fed to one of the available parton-shower MC generators. The transverse momentum distribution of the WBpB is then derived from the assumed longitudinal one. This procedure depends upon a particular evolutionscheme-dependent form of the parton shower and upon the order of the perturbative expansion. It depends as well upon the modeling method of the quark-flavour (quark-mass) effects in the parton-shower generation. The effects of the flavour dependence of the beam-size in the transverse plane are partially controlled using auxiliary, impact-parameter dependent resummation procedures. Finally, the scaledependent evolution of the longitudinal beam-spot size is presently assumed to be driven by the DGLAP evolution. It is obvious that the precision of the present understanding of the WBpB at the LHC is difficult to asses within the above modeling environment. Since its impact on the precision measurements of electroweak processes will be significantly higher for the LHC WBpB with respect to the Tevatron one, some novel measurement and/or modeling schemes must be developed. They must assure either better theoretical control of the WBpB parameters or, as proposed in this paper, reduce their impact on the measured observables to such an extent that their detailed modeling becomes 23
irrelevant. For the latter strategy it is sufficient to rely on crude modeling methods of the WBpB at the LHC which are available within the WINHAC generator. 6.1.2
Uncertainty of PDFs
The uncertainties in PDFs are, most often, propagated to the measurement errors of the physics observables by varying the PDF sets chosen in the event generation process. Alternatively, the uncertainties of the QCD fit parameters of a given PDF set are propagated by re-weighting the generated events with “min” and “max” weights, PDFmax/min = PDFcen ±δPDF, where PDFcen are the central-value-distributions of a given PDF set and δPDF is computed according to the method described in Ref. [23]. We followed the latter method, mostly because of the computing-time constraints. We have used the CTEQ6.1 PDF set [24] in modeling of the standard PDFs uncertainties. The above methods, in our view, largely underestimate the influence of the PDFs uncertainty on the measurement precision of the W -boson mass. As discussed in Section 3, the charge asymmetry of the W -boson production and decay processes is sensitive: (1) to the presence of valence quarks in the WBpB, (2) to the flavour asymmetry of their longitudinal momentum distribution (called hereafter the u(v) − d(v) asymmetry), and (3) to the asymmetry in the relative momentum distribution of the strange and charm quarks (the s − c asymmetry). The corresponding uncertainties must be modeled directly using the existing (future) experimental constraints rather than be derived from the uncertainty of the PDF-set parameters. This is because they are driven almost entirely by the nonperturbative effects, and because the QCD-evolution effects are, except for the quark-mass dependency, flavour independent. 6.1.3
Uncertainty of u(v) − d(v) asymmetry.
We assume the following two ways of modeling the uncertainty in the u(v) − d(v) asymmetry:
and
(v)
(17)
(v)
(18)
(v)
dmin/max = d(v) ∓ 0.05 u(v) ,
(v)
dmin/max = d(v) ∓ 0.08 d(v) .
umax/min = u(v) ± 0.05 u(v) , umax/min = u(v) ± 0.02 u(v) ,
The first one preserves the sum of the distribution of the the u and d quarks and is constrained, to a good precision, by the measured singlet structure function in neutrino and anti-neutrino Deep-Inelastic-Scattering (DIS) of isocalar nuclei. At the LHC the sum of the distributions will be constrained by the rapidity distribution of the Z-bosons (d quarks and u quarks contribute with similar weights). The second one assures the correct propagation of the measurement errors of the sum of the charge-square-weighted distributions of the u and d quarks, constrained by the high-precision charged-lepton beam DIS data, to the uncertainty of the individual
24
distributions. The assumed uncertainties are compatible with those discussed in the recent review [30]. While the sums of the distributions are well controlled by the existing and future data, their mutually compensating shifts are not. The only experimental constraints on such shifts come from (1) the measurements of the ratio of the cross sections for deep inelastic scattering of charged leptons on proton and deuteron targets and (2) the measurements of the ratio of the neutrino-proton to antineutrino-proton DIS cross sections. They determine the present uncertainty range of the u(v) − d(v) asymmetry. Improving this uncertainty range in the standard p p LHC colliding mode will be difficult and ambiguous. It will require simultaneous unfolding of the momentum distribution and the charge asymmetry of the sea quarks. 6.1.4
Uncertainty of s − c asymmetry
The cs annihilation represent the ≈ 7 % contribution to the total W -boson production cross section at the Tevatron collision energy. At the LHC collision energy it rises to ≈ 25 % and becomes charge asymmetric: ≈ 21 % for the W + -boson and ≈ 28 % for the W − -boson. The uncertainty in the relative distribution of the strange and charm quarks becomes an important source of systematic measurement errors of both the average W -boson mass and its charge asymmetry. We assume the two following ways of modeling the uncertainty in the s − c asymmetry: smax/min = s ± γ c, cmin/max = c ∓ γ c (19) with γ = {0.2, 0.1} representing respectively the present and future uncertainty range for the relative shifts in the s and c quark distributions. The assumed uncertainties are compatible with those discussed in the recent review [30]. As in the case of the u(v) − d(v) asymmetry, we have assumed that the sum of the distribution of the s and c quarks will be controlled to a very good precision by the Z-boson rapidity distribution. Therefore we have introduced only unconstrained, mutually compensating modifications of the s and c quark distributions1 . As seen previously in Eqs. (8) and (9), the valence quarks excess magnifies the contribution of the s − c uncertainty to the measurement precision of W -boson mass. 6.1.5
WBpB emittance
The u(v) − d(v) and s − c longitudinal momentum asymmetries would have no effect on the measured W -boson mass asymmetry in the case of the collinear partonic beams. The angular divergence (transverse-momentum smearing) of the WBpB at the LHC is driven by the gluon radiation. Its parton-shower Monte Carlo model determines the relationship between the longitudinal and the transverse degrees of In reality, the s and c quarks couple to the Z-boson with slightly different strength but the resulting effect will play no important role in the presented analysis. 1
25
freedom of the WBpB. It may give rise to a the parton-shower-model-dependent asymmetries of the W + and W − boson transverse momenta. Instead of trying to estimate the uncertainties related to the precision of the parton-shower modeling of the quark-flavour dependent effects, we allow for exceedingly large uncertainty in the size of the flavour-independent primordial transverse momentum Gaussian smearing of the WBpB: σkT = 4+3 −2 GeV (the PD samples have been simulated for the following values of the sigma parameter of the Gaussian smearing: σkT = 2, 3, 4, 5, 6, 7 GeV). Such a large uncertainty range, easily controllable using the Z-boson transverse momentum distribution, represents the effect of amplifying (small values of σkT ) or smearing out (large values of σkT ) the flavour dependent asymmetries of the WBpB transverse momentum. It has to be stressed that the resulting uncertainty of the distributions of the transverse momenta of the leptons coming from decays W + and W − bosons is – in our mass measurement region – sizably larger that the systematic effect due to the missing NLO QCD corrections. In addition, the range has been chosen to be large enough to cover the uncertainties due to: (1) nonperturbative effects, e.g. those discussed in [25], (2) the quark-mass effects and (3) resummation effects. 6.1.6
EW radiative corrections
Out of the full set of the EW radiative corrections implemented in the WINHAC generator, those representing the emission of real photons could contribute to the measured W -mass charge asymmetry. Two effects need to be evaluated: the chargeasymmetric interference terms between the photon emission in the initial and final states, and the radiation of the photons in the W -boson decays in the presence of the V − A couplings. The above corrections are described to a high precision by WINHAC, as has been shown in Refs. [8, 10]. Therefore, their influence on the W mass charge asymmetry measurement can be modeled very accurately. In this paper we do not consider these effects, leaving a detailed study for our future works.
6.2 6.2.1
Experimental uncertainties Energy scale (ES) of the charged lepton
The uncertainty in the lepton energy scale is the most important source of the MW measurement error for the Tevatron experiments. At the LHC, producing unequal numbers of the W + and W − bosons, its impact on the overall measurement precision will be amplified. For the measurement methods discussed in this paper the lepton energy scale error will be determined: (1) by the curvature radius (sagitta) measurement errors, (2) by the uncertainties in the magnetic field maps within the tracker volume, and (3) by the modeling precision of the physics processes which drive the link between the measurements of the particle hits in the tracker and the reconstructed particle momentum. While the first two sources of the measurement error are independent of the lepton flavour, the third one affects the electron and 26
muon samples differently. In the following we shall assume, on the basis of the Tevatron experience, that modeling of physics processes of particle tracking will be understood at the LHC to the required level of precision, on the basis of dedicated auxiliary measurements2 . This simplification allows us to discuss the muon and electron track measurement simultaneously. We assume as well that the solenoid magnetic field strength in the volume of the tracker will be understood to better than 0.1 % of its nominal value. We base this assumption on the precision of 0.01 % achieved e.g. by the H1 experiment at HERA [26] and by the ALEPH experiment at LEP [27]. If this condition is fulfilled, the energy scale error εl is driven by the curvature radius measurement error: ρl (rec.) = ρl (smr.) (1 + εl ),
(20)
where ρl (rec.) and ρl (smr.) are, respectively, the reconstructed and the true curvature smeared by the unbiased detector response function. Based on the initial geometrical surveys, the initial scale of ρl will be known to the precision of 0.5 %. This precision will have to be improved at least by a factor of 10 to match the precision of the Tevatron experiments, if the same measurement strategy is applied. To achieve such a precision, the local alignment of the tracker elements and/or average biases of the reconstruction of the trackers space-points must be known to the ≈ 3 µm precision. In addition, the global deformation of the tracker elements assembly must be controlled to a precision which is beyond the reach of the survey methods. Several modes of the global deformations have to be considered. They have been discussed in details in Ref. [28]. The main difference between the measurements of the W -boson properties at the Tevatron and the LHC boils down to their sensitivity to the different types of the global deformation modes. Both for the Tevatron and LHC measurements the ∆z translations are of no consequences since they do not affect the shape of the transverse projection of the particle helix. The ∆r deformations (the radial expansion r ∆r, the elliptical flattening φ ∆r and the bowing z ∆r) give rise to common biases for positive and negative particle tracks. On the other hand, the ∆φ curl and twist deformations give rise to biases which are opposite for negative and positive particles. In the case of the Tevatron p p¯ collisions, producing equal numbers of the W + and W − bosons, the dominant effect of ±z-coherent curling of the outer-tracker layers with respect to the inner-tracker layers has residual influence on the uncertainty of the average W -boson mass, leaving the residual effect of relative twist of the +z and −z sides of the tracker volume as the principal source of the measurement error. For the LHC p p collisions, producing unequal numbers of the W + and W − bosons, both deformation modes influence the measurement biases of the average W -boson mass. In the case of the LHC there is no escape from the necessity of precise understanding of the lepton-charge-dependent biases on top of the lepton-charge-independent biases. For example, the energy loss of the electrons in the dead material within the tracker volume will be understood using a conjugate process of the photon conversion. 2
27
In the presence of the above two sources of biases the energy scale bias εl can be expressed in the limit of small deformations as follows: εl + = εcurl + ε∆r , εl− = −εcurl + ε∆r ,
(21) (22)
where εcurl represents the particle charge-dependent ∆φ-type bias and ε∆r represents the charge-independent ∆r-type bias. While the ε∆r -type biases can be controlled with the help of the Z-boson, Υ and J/Ψ ‘standard candles’, e.g. using the CDF procedures, the global charge-dependent and symmetric εcurl biases cannot. At the Tevatron these biases were investigated using the electron samples by studying the charge dependent E/p distribution, where E is the energy of the electron (positron) measured in the calorimeter and p is its reconstructed momentum. The relative scale error of positive and negative electrons was recalibrated using the mean values of the E/p distributions. The achieved precision was the principal limiting factor of the measurement of ∆(+,−) . Even if the statistical precision of such a procedure can be improved significantly at the LHC, this method is no longer unbiased. This is related to the initial asymmetry of the transverse momentum distribution for positive and negative leptons in the selected W -boson decay samples. As a consequence, both the positive and negative lepton events, chosen for the calibration on the basis of the energy deposited in the calorimeter, will no longer represent charge-unbiased samples of tracks. The biases will be driven both by the influence of distribution shape and by the migration in and out of the chosen energy range. A partial remedy consists of using a statistically less-precise sample of positive and negative lepton tracks in a selected sample of Z-boson decays. However, due to the different weights of the V − A and V + A couplings of the Z-boson to leptons, even these track samples are biased. In both cases these biases can be corrected for, but the correction factor will be sensitive to the uncertainty in the momentum spectra of the valence quarks. Given the above sources of the uncertainties, we assume the following two values of the size of the biases, both for the charge-independent and charge-dependent scale shifts: εl+ = +εl− = ±0.5 %, ±0.05 %, εl+ = −εl− = ±0.5 %, ±0.05 %.
(23) (24)
The first value correspond to the precision which can be achieved on the basis of the initial geometrical survey and the initial measurement of the field maps. The second one corresponds to what, in our view, can be achieved using the above data based on the calibration methods – given all the LHC-specific effects, which make this procedure more difficult at the LHC than at the Tevatron.
28
6.2.2
Resolution (RF) of the charged lepton track parameters
The finite resolution of measuring the lepton track parameters may lead to biases in the measured value of MW + −MW − . We model the possible biases introduced by the ambiguity in the assumed size of the σ1/pT and σcotan θ smearing by decreasing and increasing the widths of their gaussian distributions by the factor RF = 0.7, 1.3.
7 7.1
In search for optimal measurement strategy Reducing impact of systematic measurement errors
In Section 4 three measurement methods of ∆(+,−) have been presented: the classic, charge asymmetry and double charge asymmetry methods. The basic merits of the two latter methods is that they use the dedicated observables which are meant to be largely insensitive to the precise understanding of the event selection and reconstruction efficiency, the background contamination level, understanding to the absolute calibration and the biases of the reconstruction of the neutrino transverse momentum, the internal and external (dead-material) radiation. It will remain to be proved, using the data collected at the LHC, that all these error sources have negligible impact on the precision of the ∆(+,−) measurement. At present, such a statement must rely on the extrapolation of the Tevatron experience. The impact of the remaining measurement errors specified in previous section and quantified using the analysis methods discussed in Section 5 is presented in Table 1. The precision of estimating the systematic shifts of ∆(+,−) (ξ) for each of the systematic effect ξ and each measurement method is �assessed using the vali� dation procedures described in Section 5. The resulting δ ∆(+,−) (ξ) of ≈ 5 MeV corresponds the collected luminosity of 10 fb−1 . The first observation is that the precise understanding of the measurement smearing of the track parameters does not introduce any bias in the measured values of ∆(+,−) . The impact of the energy scale errors on the ∆(+,−) biases differs for each of the discussed methods. For the lepton-charge-independent shift even the ‘initial’ (0.5 %) scale error has no statistically significant impact on the measurement precision for the charge asymmetry method. For the classic method the scale error has to be reduced to the ‘ultimate’ value of (0.05 %) to achieve a comparable measurement precision of ∆(+,−) . For the lepton charge-dependent shifts the classic and asymmetry methods provide similar measurement precision. The measurement error remains to be large (≈ 60 MeV), even if the ultimate precision of controlling the energy scale biases is reached. The double charge asymmetry method reduces the measurement error to the extend that the resulting bias is statistically insignificant, even for the initial scale uncertainty. This is illustrated in Figures 8a and 8b. These plots show the comparison of the χ2 fits for the charge asymmetry method and the double charge asymmetry method for the lepton charge-dependent scale error of |ε| = 0.05 % (a), and the χ2 fit corresponding to |ε| = 0.5 % for the double charge 29
MC truth Cent. Exp. εl + εl + εl + εl + εl + εl + εl + εl +
ES [%]
MW + − MW − [MeV] “Classic” Method Asym(+,−) (pT,l ) DAsym(+,−) (ρl ) −2 ± 5 −1 ± 3 0±3 1±6 1±4 0±4
Systematic ξ ξ=0 ξ=0 = +εl− = +εl− = +εl− = +εl− = −εl− = −εl− = −εl− = −εl−
= +0.05 % = −0.05 % = +0.50 % = −0.50 % = +0.05 % = −0.05 % = +0.50 % = −0.50 %
3 −2 16 −36 −56 57 −567 547
2 0 8 −6 −57 57 −611 515
1 −3
−2 3
0.7 1.3
RF
×
1 −1 ×
Table 1: Systematic shifts of MW + − MW − induced by the measurement biases discussed in the
text, for the classic, charge asymmetry and double charge asymmetry methods. The ”MC truth” and the ”Cent. Exp.” represent the unbiased pseudo data samples (1) at the generator, and (2) at the detector level. They are used here both as a cross-check of the estimation method and as a calibration of the statistical errors of the presented systematic shifts.
asymmetry method (b). The results for the double charge asymmetry correspond to εl+ = −εl− > 0 for the first running period with the standard magnetic field configuration and εl+ = −εl− < 0 for the running period with the inverted direction of the z-component of the magnetic field. (a), Incoherent shifts for |ε| = 0.05 %
1000
Asym(+,−)(ρl ) : εl+ = −εl− = +0.05 % Asym(+,−)(ρl ) : εl+ = −εl− = −0.05 % DAsym(+,−)(ρl ) : εl+ = −εl− = |0.05| %
800
(b), Incoherent shifts for |ε| = 0.5 %
1000
DAsym(+,−)(ρl ) : εl+ = −εl− = |0.5| %
800
χ2
600
χ2
600
400
400
200
200
dof = 49 0−150
−100
dof = 49 −50
0
50
MW + − MW − [MeV]
100
0−150
150
−100
−50
0
50
MW + − MW − [MeV]
100
150
Figure 8: The χ2 values and their polynomial fits for the incoherent shifts of the energy scale for
the charge asymmetry and double charge asymmetry methods using |ε| = 0.05 % (a) and (only for the double charge asymmetry) using |ε| = 0.5 % (b).
30
The above reduction of the measurement sensitivity to the energy scale error can be achieved for the initial survey precision of the tracker alignment. Such a survey will have to be made at the beginning of each of the two running periods. A special care will have to be taken to understand the relative curl and twist deformations induced by reversing the current in the solenoid. It has to be stressed that the precision of the double charge asymmetry method is insensitive to the relative ~ ×B ~ biases of the reconstructed hit-positions for the two data-taking periods, E provided that they are not larger than 10 times the average hit reconstruction precision achieved in the standard-field-configuration running period. Worsening of the hit-position resolution for the inverted-field configuration, driven by the geometrical layout of the silicon tracker modules, have no significant effect on the measurement precision. Similarly, the required level of precision of understanding the hysteresis effects, leading to inequality of the absolute field strength in the two running periods, corresponding to reverse solenoid current directions can be achieved with the standard field mapping methods. Note that the precision required for the asymmetry measurement may be up to 10 times worse with respect to the one needed for the measurement of the average W -boson mass. The reduced sensitivity to all the above effects is due to the fact that the impact of each of these effects is, to a large extent, canceled in each of the running periods. This is done in the same way as canceling the time-dependent effects of the detector response, calibration and alignment procedures. Note, that the residual impact of all the above effects can be reduced further (if necessary) using the B-field configuration-dependent analyses of straight track residua and/or the position of the reconstructed Z-boson mass peak.
7.2
Reducing impact of systematic modeling errors
As discussed in the previous section, by using the double charge asymmetry method the systematic measurement precision of ∆(+,−) could be reduced to the level of O(10) MeV. In this section we discuss the impact of the modeling uncertainties described in Subsection 6.1 on the measurement precision of ∆(+,−) for the charge asymmetry method3 . In Table 2 we show, in the first column, the expected measurement biases of ∆(+,−) due to the dominant modeling uncertainties, discussed in the previous section, for p p collisions at the LHC energy. We do not see a significant impact of the coherent shifts of the partonic distributions, defined in the previous section and denoted as the PDFs uncertainty. It would be, however, misleading to conclude prematurely that the ∆(+,−) biases are insensitive to the uncertainties in the partonic distributions. Indeed, the present uncertainty of the relative distribution of the the u and d valence quarks (the u(v) − d(v) asymmetry) leads to large shifts in the ∆(+,−) values. These shifts are specific to the LHC p p collider and are largely irrelevant for the From the point of view of the modeling uncertainties, the charge asymmetry and the double charge asymmetry methods are equivalent and the discussed results are the same for both methods. 3
31
MW + − MW − [MeV] results using the Charge Asymmetry of pT,l Systematic ξ MC truth Cent. Exp.
ξ=0 ξ=0
σkT [GeV]
PDF
p p - |ηl | < 2.5 −1 ± 3 1 ± 4
p p - |ηl | < 0.3
p p - |yW | < 0.3
0 ± 1 0 ± 4
0 ± 1 1 ± 4
d d - |ηl | < 2.5 −2 ± 4 0 ± 4
2 3
8 7
0 3
2 −2
24 17
5 6 7
−4 −8 −16
−3 2 2
−6 −5 −8
−15 −34 −52
Min. Max.
−4 4
6 −8
0 5
−3 2
115
69
−38
2
−139
−87
60
3
84
53
−31
4
−89
−57
44
4
17
10
7
19
−11
−10
0
−19
39
25
6
38
−29
−24
1
−39
(v)
umax = 1.05 u(v)
u(v) , d(v)
s, c
(v) dmin (v) umin (v) dmax (v) umax (v) dmin (v) umin (v) dmax
cmin smax cmax smin cmin smax cmax smin
= d(v) − .05 u(v) = 0.95 u(v) = d(v) + .05 u(v) = 1.02 u(v) = 0.92 d(v) = 0.98 u(v) = 1.08 d(v) = 0.9 c, = s + 0.1 c = 1.1 c, = s − 0.1 c = 0.8 c, = s + 0.2 c = 1.2 c, = s − 0.2 c
Table 2: Systematic shifts of MW + − MW − induced by the modeling biases discussed in the text, for the charge asymmetry method. The ”MC truth” and the ”Cent. Exp.” represent the unbiased pseudo data samples (1) at the generator, and (2) at the detector level. They are used here both as a cross-check of the estimation method and as a calibration of the statistical errors of the presented systematic shifts.
32
Tevatron p p¯ collisions. This is perhaps the reason why they were neglected in the previous studies [5, 4], in spite that they concern the average W -boson mass measurement. There are three origins for these shifts. The effects due to each of them add up and result in the amplification of the biases. Firstly, increasing the u(v) content of the proton shifts downwards the average momentum of the d¯ antiquarks. This leads to increase of the average transverse momentum of the d¯ antiquarks producing W + , mimicking the increase of the W + -boson mass. Simultaneous decreasing of the d(v) acts in the opposite direction for W − , leading to large and positive values of ∆(+,−) . Secondly, at the LHC, contrary to the Tevatron, the presence of the d(v) quarks leads to an asymmetry in the production rate of the W -boson from the c quarks and c¯ antiquarks. Since the average transverse momentum of the charm quarks is higher with respect to the light quarks, this asymmetry shows up in the relative shifts in the pT,l distributions for positive and negative leptons. Increasing the density of the d(v) quarks mimics thus the effect of increasing the mass of the W − with respect to the W + boson. The above two effects are amplified by the bias in the degree of the transverse polarisation of W − with respect to W + , induced by the event selection procedure based on the lepton kinematics. The relative movements of the d(v) and u(v) amplify (attenuate) the initial event selection procedure bias. What must be stressed is that if the d(v) shifts are compensated by the corresponding shifts of the u(v) distributions, they cannot be constrained to a better precision by the present data, and they will not affect the rapidity distributions of the Z-boson. Thus, it will be difficult to pin them down using the standard measurement procedures. The uncertainties of the relative density of the strange and charm quarks, the s − c asymmetry, gives rise to smaller but significant biases in the ∆(+,−) values, as shown in the first column of Table 2. Since the transverse momentum of the c quarks is significantly higher than the corresponding momentum for the s quarks, this effect, even if Cabbibo-suppressed, cannot be neglected. What must be stressed again is that if the c shifts are compensated by the corresponding shifts of the s distributions, they will not affect the rapidity distributions of the Z-bosons. Thus, it will be difficult to pin them down using the standard measurement procedures. This asymmetry can be constrained unambiguously only by dedicated measurements, e.g. by measuring the associated production of the W -bosons and charmed hadrons. Compared to the above, the biases corresponding to the uncertainties in the flavour independent smearing of the intrinsic transverse momentum distribution of partons are smaller in magnitude and can be neglected, if the intrinsic transverse momentum of partons is controlled to the precision of 2 GeV. It is obvious from the above discussion that using the standard measurement procedures, the modeling uncertainties will be the dominant source of the measurement errors of the W -boson mass asymmetry, already for the collected luminosity 100 times smaller than the one considered in this paper. In order to diminish the impact of the modeling errors on the measurement of ∆(+,−) to a level comparable to statistical and experimental measurement errors, some dedicated measurement methods must be applied. Two such procedures are proposed and evaluated below: 33
(1) the narrow bin method and (2) the isoscalar beams method. 7.2.1
Narrow bin method
As discussed previously, the dominant source of large uncertainties in ∆(+,−) comes from the presence of the valence quarks in the WBpB and from the uncertainties in their flavour-dependent momentum distributions. In order to reduce this effect we propose to profit from the large centre-of-mass energy of the LHC and measure ∆(+,−) using a selected fraction of the W -bosons which are produced predominantly by the sea rather than by the valence quarks. These W -bosons are produced with small longitudinal momentum in the laboratory frame. Two methods of selecting such a sample are discussed below. The first is based on restricting the measurement region to |ηl | < 0.3. The merit of the ηl -cut based selection is that it uses a directly measurable kinematical variable. Its drawback is that rather broad spectrum of the longitudinal momenta of annihilating partons is accepted due to the large mass of the W -boson. The second is based on restricting the measurement region to |yW | < 0.3. Here, only a narrow bin of the longitudinal momenta of annihilating partons is accepted in the region where the sea quarks outnumber the valence quarks. However, yW cannot be measured directly. It has to be unfolded from the measured transverse momentum of the charged lepton and the reconstructed transverse momentum of the neutrino. The unfolding procedure [29] neglects the width of the W -boson and depends upon the initial assumption of the relative momentum spectra of the valence and sea quarks. However, in the selected kinematical region the above approximation are expected to lead to a negligible measurement bias. It has to be stressed that the narrow bin measurements will require a 10 times higher luminosity to keep the statistical error of ∆(+,−) at the level of 5 MeV. Therefore, the results presented below for the narrow bin method correspond to an integrated luminosity of 100 fb−1 and are based on the dedicated set of the simulated mass-template and pseudo-data samples. Each sample contains NW + = 1.74 × 10⁹ and NW − = 1.14 × 10⁹ simulated events, respectively. The systematic biases of ∆(+,−) due to modeling uncertainties discussed in the previous sections are presented in columns 2 and 3 of Table 2 respectively for the |ηl | < 0.3 and |yW | < 0.3 selections. The ηl -cut based method reduces slightly the biases related to the uncertainties in the u(v) − d(v) and s − c asymmetries. The gain in the measurement precision is clearly seen for the yW -cut based method which reduces to a negligible level the s − c biases. It is interesting to note that the u(v) − d(v) shifts in ∆(+,−) change their signs for the above two methods, reflecting the importance of the W -boson polarisation effects discussed earlier. The narrow bin method allows, thus to reduce the impact of the W -boson modeling uncertainties on the ∆(+,−) biases to the level comparable to the statistical precision for all the effects, except for the u(v) − d(v) asymmetry effect. Here another remedy has to be found.
34
7.2.2
Isocalar beams
Isoscalar targets have been successfully used in most of the previous fix-target deep inelastic scattering experiments at SLAC, FNAL and CERN, but this aspect has been rarely discussed in the context of the electroweak physics at the LHC. The merits of the ion beams for the generic searches of the electroweak symmetry breaking mechanism at the LHC have been discussed in [12]. Their use as carriers of the parasitic electron beam, to measure the emittance of the WBpB at the LHC, has been proposed in [31]. In the presented series of papers we shall strongly advocate the merits of the isoscalar beams in improving the measurement precision of the parameters of the Standard Model. In this section we discuss their role in increasing the precision of the measurement of ∆(+,−) . We shall consider light ions: deuterium or helium. As far as the studies of the W -boson asymmetries are concerned, they are equivalent because shadowing corrections are quark-flavour independent. The energies of the LHC ion beams satisfy the equal magnetic rigidity condition. For the isoscalar beams the nucleon energy is thus two times lower that the energy of the proton beam. In the presented studies we assume that the ion–ion luminosity is reduced by the factor A2 with respect to the p p luminosity. In column 4 of Table 2 we present the impact of the modeling uncertainties on the ∆(+,−) biases. The isosacalar beams allow to reduce the measurement biases due to the u(v) − d(v) asymmetry effect to a negligible level. This colliding beam configuration allows to profit from the isospin symmetry of the strong interactions which cancels the relative biases in the momentum distribution of the u and d quarks. It is interesting to note that, as expected, the s − c biases are similar for the proton and for the light isoscalar beams. On the contrary, the biases related to the flavour-independent intrinsic momentum of the quarks and antiquarks are amplified due to the reduced centre-of-mass collision energy4 .
7.3
Two complementary strategies
Two complementary strategies to achieve the ultimate measurement precision of ∆(+,−) will certainly be tried. The first one will be based on an attempt to reduce the size of the systematic measurement and modeling uncertainties, discussed in the previous section. In our view, such a strategy will quickly reach the precision brick wall – mostly due to the a lack of data-driven constraints on modeling the flavour dependent W -boson production at the LHC energy. The second one, proposed in this paper, instead of reducing the size of the uncertainties, attempts to reduce their impact on the systematic error of the measured quantity by applying the dedicated methods. Such a strategy requires running the dedicated machine and detector configurations. It is thus time and luminosity consuming. However, in our view, only such a strategy allows to measure the W -mass charge asymmetries at the In order to amplify this effect, we have kept the same central value of the intrinsic transverse momentum smearing in the reduced collision energy as for the nominal collision energy. 4
35
precision comparable to the one achieved in the muon decay experiments. Let us recollect the main elements of the proposed dedicated measurement strategy that allow to reduce the systematic errors to the level shown in the shaded areas of Table 2: • The charge asymmetry method allows to reduce the impact of most of the systematic measurement errors, except for the relative momentum-scale errors for the positive and negative leptons. If they cannot be experimentally controlled to the level of O(10−4 ), their impact can be drastically reduced in the dedicated LHC running periods using the double charge asymmetry method. • The impact of the uncertainty in modeling of the intrinsic transverse momentum of the WBpB can be reduced to a negligible level using the narrow-bin measurement method. • The impact of the s − c uncertainty can be attenuated using the yW -selectionbased narrow bin method. • Finally, the impact of the u(v) − d(v) uncertainty can be annihilated in the dedicated LHC runs with light isoscalar beams.
8
Summary and outlook
This paper is the second in our series of papers devoted to optimisation of measurement strategies of the Standard Model parameters at the LHC. It presents a dedicated strategy for the precision measurement of the charge asymmetry of the W -boson mass at the LHC. This measurement must, in our view, precede the measurement of the chargeaveraged mass of the W -boson and the measurement of sin θW , in order to diminish the risk of false absorption of variety of unknown Beyond-the-Standard-Model effects within the Standard Model parameter space. This measurement is of particular importance for the two following reasons. Firstly, at the LHC – contrary to the Tevatron p p¯ collider – the measurement of the averaged mass of the W -boson cannot be dissociated from the measurement of the masses of its charge states. Secondly, the precision of verification of the charge-universality of the Fermi coupling constant GF , measured via the charge asymmetry of the muon life-time, must be matched by the precision of verification of the charge universality of the SU (2) coupling strength gW . This can be achieved only if the mass difference MW + −MW − can be determined with the precision of a few MeV, i.e. a factor of ∼ 20 better than the best present measurement. The Tevatron p p¯ collision mode, as far as the systematic and modeling errors are concerned, is better suited for the precision measurement of the W -boson charge asymmetry. However, the measurement will be limited by the statistical precision,
36
affecting both the W -boson samples and, more importantly, the Z-boson calibration sample. At the LHC the requisite statistical precision can be achieved already for the integrated luminosity of 10 pb−1 , i.e. in the first year of the LHC operation at the ‘low’, O(1033 cm−2 s−1 ), luminosity. However, in order to achieve a comparable systematic precision in an analysis based on the calibration and measurement strategies developed at the Tevatron, the charge-dependent biases in the energy (momentum) scale of positive (negative) leptons must be controlled to the precision of 0.005 %. As we have argued in this paper, it will be extremely hard, if not impossible, to achieve such a precision using the calibration methods developed at the Tevatron. Moreover, we have identified the LHC-specific sources of errors, related to the uncertainties in the present knowledge of the flavour composition of the WBpB which limit, at present, the measurement precision to O(100 MeV). Certainly, this uncertainty will be reduced once the high-statistic W -boson and Z-boson samples are collected. Nevertheless, it will be hard, if not impossible, to improve by a factor of 10 or more the precision of the u(v) –d(v) and s–c quark-momentum distribution asymmetries, as they are hardly detectable in the Z-boson production processes. Whether or not the requisite precision target will be reached using the standard measurement strategies remains to be seen. In our view, it will be indispensable to use the dedicated LHC-specific measurement strategies. The strategy proposed and discussed here makes a full use of the flexibility of the machine and detector configurations which, we hope, will be exploited in the mature phase of the LHC experimental program. It requires: (1) running for a fraction of time the inverted-polarity current in the detector solenoid, (2) the dedicated trigger and data-acquisition configuration in the ‘high’, O(1034 cm−2 s−1 ), luminosity LHC operation mode and (3) replacing the LHC proton beams by the light isoscalar-ion beams. The underlying principle of the proposed dedicated strategy is that, instead of diminishing the systematic measurement and modeling uncertainties, it minimizes their influence on the measured value of MW + − MW − . We have demonstrated that already for the modest (easy to fulfill) measurement and modeling precision requirements, the resulting uncertainty of MW + − MW − can be kept at the level comparable to the statistical measurement uncertainty, i.e. at the level of O(5 MeV). It remains to be demonstrated that the remaining systematic measurement errors, of the secondary importance at the Tevatron and not discussed here, could be neglected at this level of the measurement precision. This can, however, be proved only when the real data are collected and analysed, both for the standard and for the dedicated measurement strategies.
Acknowledgements We are indebted to F. Lediberder for his encouragement and support for our “Generic Searches and Dedicated Measurements at LHC” research program. 37
References [1] W. Pauli, Niels Bohr and the development of Physics, Pergamon Press, London, 1955. 1 [2] Particle Data Group, W. M. Yao et al., J. Phys. G33, 1 (2006). 1 [3] CDF Collaboration, T. Aaltonen et al., Phys. Rev. D77, 112001 (2008). 1, 2, 17, 22 [4] CMS Collaboration, V. Buge et al., J. Phys. G34, 193 (2007). 3, 17, 22, 33 [5] ATLAS Collaboration, N. Besson et al., Reevaluation of the LHC potential for the measurement of MW , 2008, hep-ex/0805.2093. 3, 17, 22, 33 [6] M. W. Krasny, F. Fayette, W. Placzek, and A. Si´odmok, Eur. Phys. J. C51, 607 (2007), hep-ph/0702251. 3, 16 [7] W. Placzek and S. Jadach, Eur. Phys. J. C29, 325 (2003), hep-ph/0302065. 3, 4 [8] C. M. Carloni Calame, S. Jadach, G. Montagna, O. Nicrosini, and W. Placzek, Acta Phys. Polon. B35, 1643 (2004), hep-ph/0402235. 3, 4, 26 [9] TeV4LHC-Top and Electroweak Working Group, C. E. Gerber et al., Tevatronfor-LHC Report: Top and Electroweak Physics, 2007, 0705.3251 [hep-ph]. 3 [10] D. Bardin, S. Bondarenko, S. Jadach, L. Kalinovskaya, and W. Placzek, Implementation of SANC EW corrections in WINHAC Monte Carlo generator, Acta Phys. Polon. B40, 75 (2009), 0806.3822 [hep-ph]. 3, 4, 26 [11] P. Golonka and Z. Was, Eur. Phys. J. C45, 97 (2006), hep-ph/0506026. 3 [12] M. W. Krasny, S. Jadach, and W. Placzek, Eur. Phys. J. C44, 333 (2005), hep-ph/0503215. 3, 35 [13] W. Placzek and S. Jadach, WINHAC version 1.30: The Monte Carlo event generator for single W -boson production with leptonic decays in hadron collisions, available from http://cern.ch/placzek/winhac. 3 [14] D. R. Yennie, S. Frautschi, and H. Suura, Ann. Phys. (NY) 13, 379 (1961). 3 [15] M. R. Whalley, D. Bourilkov, and R. C. Group, (2005), hep-ph/0508110. 4 [16] T. Sjostrand, S. Mrenna, and P. Skands, JHEP 05, 026 (2006), hep-ph/0603175. 4, 8 [17] K. J. Eskola, V. J. Kolhinen, and C. A. Salgado, Eur. Phys. J. C9, 61 (1999), hep-ph/9807297. 4 38
[18] K. J. Eskola, V. J. Kolhinen, and P. V. Ruuskanen, Nucl. Phys. B535, 351 (1998), hep-ph/9802350. 4 [19] A. Si´odmok and W. Placzek, ZINHAC: The Monte Carlo event generator for single Z-boson production with leptonic decays in hadron collisions, in preparation. 4 [20] F. Fayette, Precision measurement of the charge asymmetry of the W -boson mass at the LHC with the ATLAS experiment, January 2009, Ph. D. thesis. 5, 15, 22 [21] ATLAS Collaboration, ATLAS: Detector and physics performance technical design report. Volume 1, CERN-LHCC-99-14. 5 [22] ATLAS Collaboration, ATLAS inner detector: Technical design report. Vol. 1, CERN-LHCC-97-16. 19 [23] J. Pumplin et al., JHEP 07, 012 (2002), hep-ph/0201195. 24 [24] D. Stump et al., JHEP 10, 046 (2003), hep-ph/0303013. 24 [25] S. Gieseke, M.H. Seymour and A. Si´odmok, JHEP 0806, 001 (2008), hepph/0712.1199. 26 [26] H1 Collaboration, D. Newton et al., H1 Internal Note H1-8/90-145 (1990). 27 [27] ALEPH Collaboration, ALEPH Handbook, Vol. 1 (1995). 27 [28] D. Brown, A. Gritsan, and D. Roberts, Prepared for 1st LHC Detection Alignment Workshop, Geneva, Switzerland, 4-6 Sep 2006. 27 [29] A. Bodek, Y. Chung, B.-Y. Han, K. McFarland, and E. Halkiadakis, Phys. Rev. D77, 111301 (2008), 0711.2859. 34 [30] A.D. Martin, W.J. Stirling, R.S. Thorne and G. Watt, Parton distributions for the LHC, 2009, hep-eph/0901.0002. 25 [31] M. W. Krasny, Nucl. Instr. Meth. A540, 222 (2005). 35
39