also produce explanations of how and why those results were obtained. ...... forward and backward, also possibly producing animations of how such values.
A DSL for Explaining Probabilistic Reasoning Martin Erwig and Eric Walkingshaw School of EECS, Oregon State University
Abstract. We propose a new focus in language design where languages provide constructs that not only describe the computation of results, but also produce explanations of how and why those results were obtained. We posit that if users are to understand computations produced by a language, that language should provide explanations to the user. As an example of such an explanation-oriented language we present a domain-specific language for explaining probabilistic reasoning, a domain that is not well understood by non-experts. We show the design of the DSL in several steps. Based on a story-telling metaphor of explanations, we identify generic constructs for building stories out of events, and obtaining explanations by applying stories to specific examples. These generic constructs are then adapted to the particular explanation domain of probabilistic reasoning. Finally, we develop a visual notation for explaining probabilistic reasoning.
1
Introduction
In this paper we introduce a domain-specific language for creating explanations of probabilistic reasoning together with a visual notation for the explanations. This DSL is an example of an explanation-oriented language, that is, a language whose primary goal is not to describe the computation of values, but rather the construction of explanations of how and why values are obtained. In this introduction we will first introduce the idea of explanation-oriented programming in Section 1.1 and then motivate the application domain of probabilistic reasoning in Section 1.2. The specific components required for an explanation DSL for probabilistic reasoning will be outlined in Section 1.3. 1.1
Toward Explanation-Oriented Programming
A program is a description of a computation, and a computation can be broadly viewed as a transformation of some input to some output. The produced output typically is a result sought for some problem. In this sense, programming is about producing results. This view is appropriate as long as the produced results are obviously correct or can be trusted for other reasons, which is not always the case. There are many instances in which programs produce unexpected results. These results are not necessarily incorrect, but a user might not understand how the result was produced and/or cannot judge whether or not the result is correct. W.M. Taha (Ed.): DSL 2009, LNCS 5658, pp. 335–359, 2009. c IFIP International Federation for Information Processing 2009 �
336
M. Erwig and E. Walkingshaw
In situations like these an explanation of how the result was obtained or why it is correct would be very helpful. Unfortunately, however, those explanations are not easy to come by. In many cases, one has to go through a long and exhausting debugging process to understand how a particular result was produced. One reason for this situation is that explanations are not the objects of concern of programming languages. Therefore, explanation tools, such as debuggers, have to be designed as an add-on to programming languages, mostly as an afterthought. Since an explanation concept is missing in the design of programming languages, explanation tools are difficult to integrate, and this mismatch forces debuggers to reflect the notion of computation realized in the design of the programming language, which in many cases leads to “explanations” that are difficult to produce and have low explanatory value. In particular, traces generated through debugging are difficult to reuse and often impossible to combine to produce other explanations. The idea of explanation-oriented programming is to shift the focus toward explanations of the described computations, so that in devising abstractions and constructs, language design does not only center on producing final values, but also on explanations of how those values are obtained and why they are correct. This idea has a huge potential to innovate language design. In particular, with a large and growing group of end-user programmers (creating, reusing, and modifying spreadsheets, web macros, email filters, etc.) [28] there is a growing need to provide explanations in addition to effective computations. Besides the obvious application of supplementing or replacing current debugging approaches, there is also a huge potential to define domain-specific languages that can be employed to create explanations in specific application areas that can be customized and explored by users, ranging from the explanation of mechanical devices to medical procedures, or defining explanations for all kinds of scientific phenomena (in natural and social sciences). One such application area is probabilistic reasoning, which is generally not well understood and can thus benefit greatly from a language to create corresponding explanations. A domain-specific language for creating explanations of probabilistic reasoning is thus one example of an explanation-oriented language. 1.2
Understanding Probabilistic Reasoning
Probabilistic reasoning is often difficult to understand for people that have little or no corresponding educational background. Even rather simple questions about conditional probabilities can sometimes cause confusion among lay people, and disbelief about answers to probability questions in many cases remains despite elaborate justifications. Consider, for example, the following question: “Given that a family with two children has a boy, what is the probability that the other child is a girl?” Many people respond that the probability is 50%, whereas it is, in fact, 662/3 %. Given the importance of probabilistic and statistical reasoning in all areas of science and in many practical questions concerning modern societies (insurances, effectiveness of medical procedures, etc.), the question is what can be done to
A DSL for Explaining Probabilistic Reasoning
337
help this situation. In addition to trying to improve education in general and the teaching of basic probability theory in schools in particular, a more immediate approach is to provide concrete help with specific probability problems. Currently, somebody who wants to understand the answer to the above question has several options: First, they could ask somebody for an explanation. Second, they could try to find explanatory material on their own, for example, by searching the web or maybe even by looking into a textbook. Third, they could give up and not understand the problem, which is likely to happen if no one is around who could take the time to provide a personal explanation, or if the explanation found on a web site (or in a textbook) does not provide the right amount of information on the right level. In general, a personal explanation can be expected to be the best option in most cases since it allows the explainer to rephrase explanations, to answer potential questions, make clear the underlying assumptions, and also to use different examples to provide further illustration. Unfortunately, personal explanations are a comparatively scarce resource. Not only are they not always available, but they also have a very low degree of shareability and reusability. In contrast, an explanation provided on a web site, say, can be accessed almost at any time, by almost anyone from anywhere, and as often as needed, that is, it has very high availability, sharability, and reusability. On the other hand, explanations on web sites tend to be rather static and lack the adaptive features that a personal explanation provides. In many cases, one has to read a whole text, which might for a particular reader be too elaborate in some parts, which can potentially cause exhaustion, and too short in other aspects, which can cause frustration. The goal of our DSL is to combine the positive access aspects of electronically available explanations with the flexibility that personal explanations can offer and to provide a language to create widely accessible and flexible explanations. Our goal is not, however, to replace personal or web-based explanations, but to complement them. For example, a teacher or a web page can provide an explanation in the traditional sense and then offer a structured, explorable explanation object as an additional resource. Another combined use is that different views of an explanation object can be employed as illustrations as part of a personal or written explanation. 1.3
This Paper
The design of a successful explanation DSL ultimately requires several different components. – – – –
Language constructs to build explanations A visual representation of probability distributions and transitions Interaction concepts to support the dynamic exploration of explanations A visual explanation programming language to allow domain experts who are not programmers to develop explanations
338
M. Erwig and E. Walkingshaw
In this paper we will focus on the first two aspects. First, we investigate the notion of an explanation in Section 2 and try to identify an explanation concept that is most suitable for our task of defining explanation DSLs. Based on those insights we then design in Section 3 a domain-specific embedded language in Haskell [14] for building explanations. This DSL can be employed to create explanations in a variety of domains. We then specialize some parts of the DSL to the domain of probabilistic reasoning in Section 4. The visual representation of those explanations is introduced in Section 5. After the discussion of related work in Section 6 we present some conclusions and goals for future work in Section 7. The contributions of this paper are these. – – – –
2
A A A A
DSL for building (generic) explanations DSL for building explanations of probabilistic reasonings prototypical implementation of both DSLs as an embedding into Haskell visual notation for probabilistic reasoning explanations
Theories of Explanation
The question of what an explanation is has been discussed by philosophers of all times [26], dating back to Aristotle. Despite all these effort, the concept of explanations remains elusive, and an all-encompassing theory that could be agreed upon does not yet exist. One of the most influential approaches in the 20th century was the so-called “deductive nomological” theory of explanation by Carl Hempel [12]. According to that theory an explanation is essentially an inference rule that has laws and facts as premises and the explanandum1 as a conclusion. This view is very attractive and has initiated renewed interest and research in the subject. However, Hempel’s theory has been criticized, in particular, for being too permissive and thus failing to characterize the essential aspects of explanations. One problem is the overdetermination of inference rules, that is, by adding irrelevant facts or laws to an inference rule, the inference rule is still considered to be an explanation even though the added facts and laws are not explanatory and, in fact, weaken the explanation (regardless of their truth). For example, a law that says that men taking birth control pills do not get pregnant does not explain the fact that a specific man did not become pregnant as well as the simpler, more general law that men do not become pregnant. The other problem with Hempel’s theory is that it fails to capture asymmetry in explanations. For example, an inference rule that can explain the length of a shadow by the height of a flagpole and the position of the sun can also be used to “explain” the height of the flagpole from the length of the shadow even though this would not be accepted as an explanation. In search for a unifying theory of explanation, the problem has been approached not only from philosophy, but also from other related areas, including cognitive science [13] and linguistics [2]. 1
The thing that is to be explained.
A DSL for Explaining Probabilistic Reasoning
2.1
339
Criteria for an Explanation Model
An initial survey of the literature quickly reveals that a comprehensive overview over the field is well beyond the scope of this paper. Therefore, in order to have an effective approach to finding an appropriate explanation theory, we have devised some criteria that an explanation theory should fulfill. Traditionally, the search for an explanation model has been driven by the goal to achieve generality. However, an explanation model that is adequate in most cases is sufficient for our purpose, in particular, if it supports the definition of a DSL for building explanations. The main criteria for selecting a working model of explanation are the following. An explanation model should be: – Simple and intuitive. The model should be understandable by ordinary people, not just philosophers and scientists, because explanations expressed in this model are to be consumed by ordinary people. – Constructive. The model should identify the components of an explanation and how they are connected or assembled to support the definition of a DSL. The need for simplicity rules out some advanced statistical models [25,21], models based on physical laws [27] or process theory [4]. Unificationist models [18] do not provide a constructive approach, and they are quite complicated too. 2.2
Causal Explanations
We believe the most promising explanation theory is based on the notion of causation, that is, to explain a phenomenon A means to identify what caused A. The idea that explanations reveal causes for why things have happened goes back to Plato [24]. The theory put forward by Woodward [30] ties the notion of a cause to the concept of manipulability, which, simply said, allows one to ask the question “What would happen to the explanandum if things had been different?”. In this way, manipulating a cause shows effects on the explanandum and thereby places it into a context of alternative outcomes. Similar emphasis on the importance of an explanations to reveal opportunities to intervene to change the outcome can be found in the work of Humphreys and von Wright [15,29]. An argument for the importance of the manipulability aspect of explanations is that the motivation to understanding something comes from the promise of using the knowledge to manipulate nature for one’s own advantage. This has been nicely demonstrated by Dummett’s “intelligent tree” thought experiment [5]: Suppose we humans were intelligent trees, capable of only passive observations. Would we have developed the concepts of causation and explanation as we have them now? In Woodwards model, an explanation is represented by a directed graph with variables as nodes and directed edges between nodes X and Y if X has a direct effect on Y . A similar representation is used by Pearl [21]. Essentially, each variable in such a graph corresponds to a type of possible values (typically boolean), and a directed edge from X to Y corresponds to a function of type X → Y .
340
M. Erwig and E. Walkingshaw
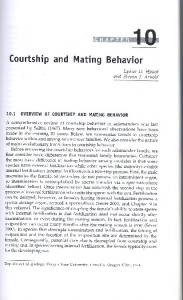
Therefore, an explanation graph represents a set of interconnected functional relationships. This is essentially the same view as strutural equation modeling, which dates back almost 90 years [31]. As an example, consider the desert traveler Poke Hole Poisoning problem, in which a traveler takes a bottle of water on a trip through the desert. Two people try to kill the traveler: One pokes a hole in the botNo Water Poison tle, the other one poisons the water. When the travler later gets thirsty, he will find the bottle empty and dies of dehydration. A graph repreHealth sentation of this story is shown in Figure 1 on the right. This example is used to test theories about causation and whether they can properly Fig. 1. Causal graph for the desert traveler problem attribute the blame for the traveler’s death.
3
The Story-Telling Model of Explanations
It seems that we could use the graph representation suggested by Woodward and Pearl [30,21] directly as a representation for explanations. However, a potential problem with the graph representation is that it puts an additional navigational burden of the user. In particular, the user has to decide which nodes, edges, or paths to look at in which order, which can be a frustrating experience. Therefore, we have aimed for a more linear representation. The idea is that an explanation consists of a sequence of steps that guide the user from some initial state to the explanandum using a series of well-understood operations to transform the explanation state. Of course, the linearity requirement might mean more work for the explanation programmer who has to define the state in a way that is general enough to include all aspects of a potentially heavily branched graph representation. On the other hand, if done well, this effort pays off since it makes the life for the explanation consumer much easier. This task of creating an explanation is similar to writing a story in which events happen that transform the state of the story to a final outcome, the explanandum.2 There is empirical evidence that presenting facts and explanations in the form of a story makes them more convincing and understandable [22]. We will therefore employ the story-telling metaphor for explanations in the design of our explanation DSL. Each event denotes a change and is represented by a function that is annotated by a textual comment to be used in printing explanations. So a simplified view of an event is given by the following Haskell type definition. type Event a = Annotate (Chg a)
-- preliminary definition
The type constructors Annotate and AnnotateP are used to attach a Note to a single or a pair of values, respectively. 2
Friedman explicitly calls explanations “little stories” [9].
A DSL for Explaining Probabilistic Reasoning
341
type Note = String type Annotate a = (Note,a) type AnnotateP a = (Note,a,a) The type constructor Chg simply represents a function type. It is one of several type constructors to be used (and explained) in the following. data data data data
Id a Chg a Agg a Sum a
= = = =
I C A S
a (a -> a) ([a] -> a) [a] a
The definition of Event can be generalized in two ways. First, in addition to a linear sequence of events we also consider stories that can branch into separate substories and add two constructors for branching and joining story lines. Second, a story or explanation can be viewed on two different, but closely related levels. On the one hand, we can talk about the sequence of events. On the other hand, we can look at the sequence of results that are produced by the events when they happen to a particular (initial) state. Therefore, we define a general type Step, of which the types for events and states are instances. These requirements are captured by the following type definition. The parameter type s, which is a type constructor, defines what is represented in each step of a story, and j defines how results from multiple stories can be combined. In an Event we store a function in each step and an aggregation function for joins. In contrast, in a state we just store a value for each step and a summary of the values of the branches and the computed aggregate value for joins. data Step s j a = Linear (Annotate (s a)) | Branch (AnnotateP [Step s j a]) | Join (Annotate (j a)) type Event a = Step Chg Agg a type State a = Step Id Sum a A story is a list of events, and an explanation is given by a list of states. The construction of an explanation happens by first building a story and then instantiating it to an explanation. type Story a = [Event a] type States a = [State a] newtype Explanation a = E (States a) We can illustrate the operations for building stories with the desert traveler example. We represent two aspects of the traveler, his health and his water bottle. type Traveler = (Health,Bottle)
342
M. Erwig and E. Walkingshaw
This definition shows how a fan-out graph explanation can be linearized by defining a richer story state. The traveler’s health is given by two states, dead or alive, where we are interested in the case of death, how he died. The water bottle can be empty, full, or leaking, and we have to indicate in the non-empty cases whether the bottle contains water or poison. data Health = Alive | Dead Note data Fluid = Water | Poison data Bottle = Full Fluid | Leak Fluid | Empty To define a story that explains the traveler’s death, we have to define four events: poisoning the water, poking a hole in the bottle, traveling through the desert, and (attempted) drinking. In many cases, an aggregated state definition, such as Traveler, requires operations that allow the application of events to parts of the state. In the example, poking a hole or poisoning are events that actually apply to a bottle, but that will need to be defined to transform the whole traveler state. This state access is provided by the following function. inBottle :: (Bottle -> Bottle) -> Traveler -> Traveler inBottle f (h,b) = (h,f b) Now we can define the poisoning event as a function putPoison that has an effect on a bottle, but that is lifted to transform a traveler state. poison :: Event Traveler poison = "Poison the water" ## inBottle putPoison where putPoison (Leak _) = Leak Poison putPoison _ = Full Poison The annotation of the lifted function is performed with the smart constructor ##, which is defined as follows. (##) :: Note -> (a -> a) -> Event a n ## f = Linear (n,C f) The events of poking a hole in the bottle and the potential draining of the bottle’s content during the travel are defined in a completely analogous ways. poke :: Event Traveler poke = "Poke hole in bottle" ## inBottle pokeHole where pokeHole (Full f) = Leak f pokeHole b = b travel :: Event Traveler travel = "Travel through desert" ## inBottle drain where drain (Leak _) = Empty drain b = b
A DSL for Explaining Probabilistic Reasoning
343
The final event of the story is when the traveler gets thirsty and wants to drink. quench :: Event Traveler quench = "Traveler gets thirsty and tries to drink" ## drink where drink (h,Full Water) = (h,Empty) drink (h,Leak Water) = (h,Empty) drink (h,Empty) = (Dead "thirst",Empty) drink (h,_) = (Dead "poison",Empty) A story about the desert traveler is given by a list of events. For the original story as told in Section 2.2 we have: story :: Story Traveler story = [poison,poke,travel,quench] We can generate an explanation from the story by successively applying the story events to an initial state value. desertTravel :: Explanation Traveler desertTravel = explain story ‘with‘ (Alive,Full Water) The function explain is actually just a synonym for the identity function and is used only as syntactic sugar. The function with threads a state value through a list of events and builds a corresponding trace of resulting state values that constitute the explanation. with :: Story a -> a -> Explanation a If we evaluate desertTravel, we obtain a description of the events and how they lead to the death of the traveler. --{Start}--> (Alive,Full Water) --{Poison the water}--> (Alive,Full Poison) --{Poke hole in bottle}--> (Alive,Leak Poison) --{Travel through desert}--> (Alive,Empty) --{Traveler gets thirsty and tries to drink}--> (Died of thirst,Empty) This result is obtained by simply pretty printing the states and interjecting the notes associated with the events. Arguably, the trace “explains” how the traveler died, but it is not necessarily obvious that it is the poking event that is responsible for the death. To strengthen the explanation in this regard we could add a branch to the story that shows that the poisoning has no effect on the outcome. Adding a version of the story to the explanation that omits the poisoning event achieves this because the outcome stays the same.
344
M. Erwig and E. Walkingshaw
poisonEffect :: Explanation Traveler poisonEffect = explain [Branch ("Effect of poisoning",story,tail story)] ‘with‘ (Alive,Full Water) The evaluation of this explanation will produce a pair of traces that both end with the same result (Died of thirst,Empty), which thus illustrates that poisoning has no causal effect on the death. We will present an output that includes an explanation with a Branch constructor later in Section 4.3. The Branch construct has much the same purpose as the do operation presented in [21], which permits the representation of interventions in causal networks. The difference is that the do operation changes a probability network, whereas Branch combines two explanations representing both situations before and after the intervention, similar to the twin network representation, also described in [21].
4
Explanations of Probabilistic Reasoning
Explanations for probabilistic reasoning are built using, in principle, the same operations as introduced in Section 3. However, the domain of probability distributions presents specific challenges, and opportunities, to adapt the story-telling model to this particular domain. By specializing the generic explanation DSL with respect to another domain, probabilistic reasoning, we obtain a “domainspecific domain-specific language”. This section introduces the components of our DSL in several steps. In Section 4.1 we review an approach to computing with probabilistic values that forms the basis for the representation of probability distributions. In Section 4.2 we adapt the explanation DSL to the specific domain of probabilistic values, and we show example explanations in Section 4.3. 4.1
Computing with Probabilistic Values
In previous work we have presented an approach to represent probabilistic values explicitly as probability distributions [7]. Any such probability distribution is basically a list of values paired with associated probabilities. Probability distributions can be constructed using a variety of functions. For example, the function uniform takes a list of values and produces a distribution of the values with equal probabilities. uniform :: [a] -> Dist a Coin flips or die rolls can be conveniently expressed using uniform. Or, to use the example we started in Section 1.2, we can represent the birth of a child as a probability distribution.
A DSL for Explaining Probabilistic Reasoning
345
data Child = Boy | Girl birth :: Dist Child birth = uniform [Boy,Girl] The evaluation of a probabilistic value will show the elements of the distributions together with their probabilities. > birth Boy 50% Girl 50% It turns out that the Dist type constructor is actually a monad [10,23]. The return function produces a distribution of a single value (with 100% probability). The bind operation takes a probability distribution d of type Dist a and function f of type a -> Dist b and applies f to all elements of d. The list of distributions obtained in this way will be combined into one distribution, and the probabilities of the elements will be adjusted accordingly. The meaning of the bind operation >>= can probably be best explained by showing an example. To compute the probability distribution of families with two children we can use bind to extend the distribution birth by another birth. However, we have to represent the second birth as a function that transforms each child value from the first distribution into a pair of children in the produced distribution. secondChild :: Child -> Dist (Child,Child) secondChild c = uniform [(c,Boy),(c,Girl)] twoKids : Dist (Child,Child) twoKids = birth >>= secondChild Evaluation of twoKids results in the following distribution. (Boy,Boy) (Boy,Girl) (Girl,Boy) (Girl,Girl)
25% 25% 25% 25%
Another operation on probability distributions that will be employed in explanations of probabilistic reasoning is the filter operation ||| that restricts a probability distribution by a predicate. (|||) :: Dist a -> (a -> Bool) -> Dist a The definition of ||| selects all the elements that pass the filter predicate and then scales the probabilities of these elements equally so that they sum up to 100%. The Haskell definition requires several helper function and is not so important; it can be found in the distribution of the PFP library.3 The operation 3
See eecs.oregonstate.edu/~erwig/pfp/
346
M. Erwig and E. Walkingshaw
||| computes a distribution of all conditional probabilities with respect to the filter predicate. For example, the riddle from Section 1.2 asks us to consider only families with boys. This constraint can be expressed by filtering twoKids with the predicate that one kid must be a boy. oneIsA :: Child -> (Child,Child) -> Bool oneIsA c (c1,c2) = c1==c || c2==c The filtered distribution of conditional probabilities looks then as follows. > twoKids ||| oneIsA Boy (Boy,Boy) 33% (Boy,Girl) 33% (Girl,Boy) 33% This distribution almost tells the answer to the riddle. Formally, the result can be obtained by using a function to compute the total probability of an event that is given by a predicate. (??) :: (a -> Bool) -> Dist a -> Float The probability that in a family that has one boy the other child is a girl is thus obtain as follows. > oneIsA Girl ?? twoKids ||| oneIsA Boy 67% We will present a generalization of ?? in the next subsection. 4.2
Adapting Explanations to Probabilistic Values
The explanation of the riddle that was provided in Section 4.1 by a sequence of function definitions intertwined with textual comments is, so we hope, effective and has high explanatory value. The reason may be that it follows to some degree the story-telling schema propagated earlier. In any case, it is, however, not represented in a formal language and thus is not well suited for reuse, manipulation, or exploration. When we try to express the boy/girl riddle as a story we encounter the difficulty that the types of events, stories, and explanations have only one type parameter, which means, for example, that we cannot directly reuse the function secondChild to represent an event because it changes the type of the distribution. There are two ways to deal with this problem. One approach is to generalize the explanation types to two type parameters to allow for type changes in explanations. The alternative is to define a union type, say Family, that accounts for all possible types encountered during the course of the explanation.
A DSL for Explaining Probabilistic Reasoning
347
It seems that the two-type-parameter approach is preferable since it is less constraining and promises more modularity and a higher degree of reuse. However, the problem with this approach is that it requires the use of existential types, which would make our approach to grouping probability distributions (to be described below) impossible. We have therefore adopted the simpler solution and require a single type for the explanandum. For the riddle example the definition of such a union type is rather obvious. data Family = NoKids | One Child | Two Child Child Now before we go on to define family events, we extend the representation of probability distributions by an optional function to group values in a distribution into different categories. We call the new type VDist since the grouping is an example of a view on the distribution. data VDist a = Group (Dist a) (Maybe (a -> Int)) At this point we only consider grouping views, but there are other kinds of views that we might want to add in the future to the type definition. We also specialize the event, story, and explanation types to VDist distributions by reusing the definitions given in Section 3 (assuming they are defined in a module with name E). type Event a = E.Event (VDist a) type Story a = E.Story (VDist a) type Explanation a = E.Explanation (VDist a) We also define the following type synonyms for events that emphasize special functions of probabilistic events. type Generate a = Event a type Filter a = Event a type Group a = Event a The presence of a grouping function does not change the distribution of values, it just provides a particular presentation of the distribution, which is reflected in the fact that the effect of the grouping is noticeable when distributions are printed. instance Show a => Show (VDist a) where show (Group d Nothing) = show d show (Group d (Just f)) = show (partition f d) Without a grouping function, distributions are shown as normal. However, when a grouping function is present, values of the distribution are grouped into lists by the following function.4 4
The actual argument type of the result distribution is not [a] but a specialized list type ZoomList a that allows a more flexible and condensed printing of large lists, which occur frequently in probability distributions.
348
M. Erwig and E. Walkingshaw
partition :: (a -> Int) -> Dist a -> Dist [a] Since the distributions in explanations are all wrapped by a Group constructor, we need auxiliary functions to lift functions defined on distributions to work on the new type and to embed distributions in the new type. vmap :: (Dist a -> Dist a) -> VDist a -> VDist a vmap f (Group d g) = Group (f d) g toV :: Dist a -> VDist a toV d = Group d Nothing With the help of vmap we can easily adapt the annotation function ## introduced in Section 3. Since we have different kinds of transitions between probability distributions, we introduce several new versions of annotations. In particular, we have distribution generator events that are defined using the monadic bind operation and distribution filter events that are directly based on the probabilistic filter operation. (##>) :: Note -> (a -> Dist a) -> Generate a n ##> f = n ## vmap (>>= f) (##|) :: Note -> (a -> Bool) -> Filter a n ##| p = n ## vmap (||| p) We also specialize the with function that instantiates stories with examples. with :: Story a -> Dist a -> Explanation a s ‘with‘ d = s ‘E.with‘ (toV d) 4.3
Example Explanations
The explanation for the boy/girl riddle is now straightforward. First, we define the individual events, then we combine the events into a story, and finally we instantiate the story with an example to obtain an explanation. The two generators are variations of the birth distribution, rewritten as argument functions for the bind operation. firstChild :: Generate Family firstChild = "First child" ##> \_->uniform [One Boy,One Girl] secondChild :: Generate Family secondChild = "Second Child" ##> \(One c)->uniform [Two c Boy,Two c Girl] With these two events we can define a story and explanation of a two-children family. Note that certainly is simply a synonym for return.
A DSL for Explaining Probabilistic Reasoning
349
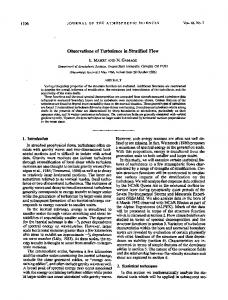
twoKids :: Story Family twoKids = [firstChild,secondChild] family :: Explanation Family family = explain twoKids ‘with‘ certainly NoKids The other two elements of the riddle are the restriction to families that have a boy and the focus on the families that also have a girl. These two events represent, respectively, a filter and a grouping operation on distributions. hasA :: Child -> Family -> Bool hasA c (Two c1 c2) = c==c1 || c==c2 oneIsBoy :: Filter Family oneIsBoy = "Only families that have a Boy" ##| hasA Boy otherIsGirl :: Group Family otherIsGirl = "Other child is a girl" ##@ hasA Girl The special annotation function ##@ defines the grouping function for a distribution. In contrast to filtering, the argument function (which is here a predicate) does not change the probability distribution, but rather creates groups of values together with their accumulated probabilities. (##@) :: Grouper b => Note -> (a -> b) -> Group a n ##@ f = n ## groupBy f groupBy :: Grouper b => (a -> b) -> VDist a -> VDist a groupBy f (Group d _) = Group d (Just (toInt . f)) The type class Grouper ensures the availability of the function toInt, which turns the grouping function into one of type a -> Int, the type expected by partition. Finally, we can express the whole riddle story by the events defining the twoKids family followed by the boy filtering and then by focusing on the group containing family with girls. The solution to the riddle can be found in the resulting distribution of the explanation, which is obtained as an instance using the with function. riddle :: Story Family riddle = twoKids ++ [oneIsBoy,otherIsGirl] solution :: Explanation Family solution = explain riddle ‘with‘ certainly NoKids The explanation, shown in Figure 2, illustrates how the result is obtained from an initial state through the successive application of simple events.
350
M. Erwig and E. Walkingshaw
Once the structure of the explanation has been identified, it is easy > solution --{Start}--> to write transformations that change No children 100% the examples, that change generators --{First child}--> (for example, replace children with coin Boy 50% flips), or that provide more or less detailed sequences of steps. Such a Girl 50% --{Second Child}--> collection of explanations constitutes Boy Boy 25% an explorable explanation object that, Boy Girl 25% made accessible through a correspondGirl Boy 25% ing user interface, provides a flexible, Girl Girl 25% yet structured explanation of the par--{Only families with a boy}--> ticular problem at hand. Boy Boy 33% As another example we consider an explanation of the so-called “Monty Boy Girl 33% Hall problem” in which a game show Girl Boy 33% --{Other child is a girl}--> contestant is presented with three [Boy Girl,Girl Boy] 67% doors, one of which hides a prize. The [Boy Boy] 33% player chooses one of the doors. After that the host opens another door that does not have the prize behind it. Fig. 2. Textual explanation of the boys The player then has the option of stay- and girls riddle ing with the door they have chosen or switching to the other closed door. This problem is also discussed in [7,11,20]. Most people believe that switching doors makes no difference. However, switching doors does make a difference—it doubles the chances of winning from 331/3 % to 662/3 %. To build an explanation we first define a data type to represent the different states of the story. Each door means a potential win or loss for the candidate unless it is opened, in which case it is out of the game. data Door = Win | Loss | Open type Doors = [Door] Since the opening of doors is captured by the Door type, the game needs to distinguish only two states, the initial situation of the prize being hidden, and then the selection of a door through the contestant. data Game = Hide Doors | Select Int Doors The story starts with a situation that can be represented by three different door lists with Win in one place. Then the first event, selecting the door is represented by a generator that creates for each door list three possible selections, represented by an integer between 0 and 2. (Starting with 0 accomodates standard list indexing convention.)
A DSL for Explaining Probabilistic Reasoning
351
hiddenPrize :: Dist Game hiddenPrize = uniform $ map Hide [[Win,Loss,Loss],[Loss,Win,Loss],[Loss,Loss,Win]] selectDoor :: Generate Game selectDoor = "Candidate selects closed door" ##> \(Hide ds)->uniform [Select n ds | n \(Select n ds)->uniform $ map (Select n) (openBut n ds) openBut :: Int -> Doors -> [Doors] openBut n ds = [upd i Open ds | i Int -> Doors -> [Int] avoid d n ds = [i | ids!!n == Win Finally, we define two events for switching and non-switching and place them in a branching event. Not switching is an annotated identity function, whereas switching means to select the door that has not been opened. This event is implemented by a function that simply transforms one game into another and does not generate multiple possibilities. This means that when we reuse the avoid function, we have to extract an element from the produced list. Since we know that the list can have only one element in this case, we can obtain it using the function the. Moreover, we need a new annotation function that lifts into the Event type, for which we also use the synonym Map. stay :: Map Game stay = "Don’t switch door" ##* id
352
M. Erwig and E. Walkingshaw
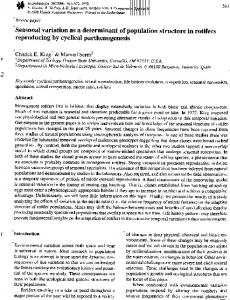
switch :: Map Game switch = "Switch door" ##* \(Select n ds)->Select (the (avoid Open n ds)) ds where the [x] = x (##*) :: Note -> (a -> a) -> Map a n ##* f = n ## vmap (fmap f) The definition of ##* exploits the fact that probability distributions are also defined as functor instances. The contemplation of both alternative story lines can be expressed as a branching event as follows. contemplate :: Event Game contemplate = Branch("Consider switching doors",[stay],[switch]) We can now create an explanation from all these events. However, we can observe (either by inspecting the produced explanation or by simply thinking about the story) that it does not really matter which door hides the prize. We might want to exploit this knowledge and integrate it into the explanation since it helps to reduce the number of possibilities to be inspected. This idea can be realized very easily by a function that picks a particular element of a probability distribution and sets its probability to 100%. forExample :: Int -> Event a It is up to the explanation programmer to ensure that the explanation for the picked example is isomorphic to the other elements in the distribution. In future work we plan to extend the function forExample by requiring evidence that can be effectively checked against the other elements of the probability distribution. Finally, the explanation for the Monty Hall problem can be put together as follows. montyHall :: Explanation Game montyHall = explain [forExample 1,selectDoor,openDoor, winning,contemplate] ‘with‘ hiddenPrize The explanation that is produced is shown in Figure 3. In the textual representation $ means win, x means loss, and a blank denotes an open door. Underlining indicates the door selected by the contestant. Even though the textual representation is quite frugal, it still illustrates the progression of the probability distribution along the story. In particular, the grouping step shows that before the question of switching, the candidate’s chances of losing are about 67%, and, of course, this probability doesn’t change if the candidate doesn’t switch. In contrast, the switching event in the second branch illustrates that switching will always move from winning to losing and from losing to winning, that is, the 67% losing probability turns into a 67%
A DSL for Explaining Probabilistic Reasoning
353
> montyHall --Start--> $xx 33% x$x 33% xx$ 33% --Select 1st value as representative--> $xx 100% --Candidate selects closed door--> $xx 33% $xx 33% $xx 33% --Game master opens non-chosen no-win door--> $ x 17% 17% $x 33% $x $ x 33% --Group outcomes by winning and losing--> [$ x,$x ] 33% [$x ,$ x] 67% BRANCH Consider switching doors >>> Fig. 3. Textual explanation of the Monty Hall problem
winning probability. The representation also shows why this is the case, namely, because the underscore has only one other case to switch to. Laws that relate different stories with respect to their produced results can be employed to turn one explanation into several explanations to be explored by te user. We briefly illustrate this aspect with one example. For example, given a function result :: Explanation a -> [a] that yields the result(s) of an explanation5 , we can observe the following invariant. If f is a total function on T and s :: Story T is well formed (that is, any event directly following a branch event is a join), then for any story decomposition s1 ++ s2 == s we have: result (s ‘with‘ x) == result ((s1++["" ##@ f]++s2) ‘with‘ x) In other words, we can insert a grouping anywhere into an explanation without changing the resulting probability distribution. 5
The list type is needed to aggregate results from branches.
354
M. Erwig and E. Walkingshaw
For explanations this means that we can move groupings around to improve the explanatory value of explanations. (But we have to be careful to move grouings into the branches of a Branch constructor.) In the Monty Hall example this result means that we can safely move the grouping before the door opening or into the branch after the switching/staying, which yields alternative perspectives for the explanation that could be offered for exploration by the user.
5
Visual Explanations of Probabilistic Reasoning
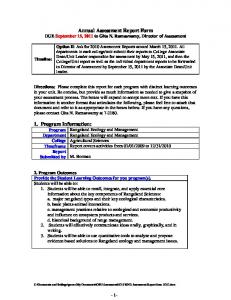
The visual notation for explanations of probabilistic reasoning was not simply designed as a replacement for the clunky textual representation. In fact, we started the design of the DSL with the visual notation. The two major motivations were the following. (The first aspect is part of future work and will therefore not be discussed in this paper.) – Providing a basis for interactive explanation exploration. – Adding explanatory power by employing the two metaphors of spatial partitions and story graphs. The explanatory value of spatial partitions and story graphs can be best explained by an example. Figure 4 shows on the left the visual representation of the explanation for the boy/girl riddle from Section 4.3.
100% First child is added to the family
GENERATE
B
G
50%
50% Second child is added to the family
GENERATE
BB
BG
25%
GB
25%
25%
GG 25%
Consider only families that have a boy
FILTER
BB 33%
BG
P%
BB
50% of P
GB
33%
33%
Group by whether or not a girl is in the family
GROUP
BB 33%
BG
67%
GB
Fig. 4. Visual explanation of the boys and girls riddle
BG
50% of P
A DSL for Explaining Probabilistic Reasoning
355
A probability distribution is represented as a partition of a horizontal area in which the area of each block is proportional to the probability of the represented value. In this way spatial partitions capture the notion that a probability distribution is, in fact, a partitioning of the “space” of all posibilities. It treats the probability space as a resource that is split by generators and merged by groupings. Moreover, it illustrates indirectly how space that is filtered out is redistributed to the remaining blocks of the partition. Each partition of an explanation is linked to its successor by basically two kinds of directed edges. First, filter and group edges link blocks of two partitions that either have identical values (in the case of filter) or that are considered equivalent (by the grouping function in the case of grouping). Second, generator edges are, from a graph-theoretic point of view, sets of edges that lead from one block to a set of blocks that are created from the value in the source block by a generator. They are represented visually with one shared tail and as many heads as there are generated values/blocks. Similarly, “for example” edges are sets of edges that map a set of blocks that are equivalent with respect to the continued probabilistic reasoning to one block chosen as an example. The chosen example is indicated by a fat tail (see Figure 5 for an example). Since generators are more complicated events than filters or groupings, generator edges are necessarily more abstract and less informative about what exactly happens in that generating step. We have therefore also a notation that shows the effect of a generator operation in more detail. One example is shown in Figure 4 on the right. Showing this expanded notation everywhere would make the visual notation too noisy, so we envision it as part of the interaction capabilities of these explanations to expand individual operations into such a more detailed representation. We have employed a very similar strategy successfully in another visual language [8]. The notation can also be the basis for a visual explanation programming language in which explanations can be assembled on the fly using distributions and generators and then modified further through filters and groupings. The chosen graph representation for linking the spatial partitions provides another opportunity for explanations. A user could mark a particular value anywhere in an explanation, and the system can trace the evolution of that value forward and backward, also possibly producing animations of how such values flow through the graph, changing the probabilities on their way. In Figure 5 we show the story graph representation of the explanation for the Monty Hall problem. In anticipation of a visual user interface, we assume that only one branch is “active” or “selected” at a time so that there is only one set of edges that connect blocks into one branch to avoid confusion. We have added another Map event at the end, to illustrate the switch of winning and losing more clearly. In future work, we will define the formal syntax and semantics of story graphs [6] and explore more of their potential usages, in particular, possible interactions for story graphs that support explanation exploration. We will also extend story graphs to a visual programming language for explanations. Moreover, we plan a
356
M. Erwig and E. Walkingshaw
�����
�����
�����
33%
33%
33% Select first value as a representative
EXAMPLE
����� 100% Candidate selects closed door
GENERATE
�����
�����
�����
33%
33%
33% Game master opens non-chosen no-win door
GENERATE
����� ����� 17%
17%
���
��� �
33%
33% Group by winning or losing
GROUP
����� ����� 33%
��� �
��� � 67%
MAP
BRANCH
����� ����� 33%
Switch door
��� �
��� � 67%
MAP
����� ����� 33%
�����
� ��� 67%
MAP
Win
Lose
33%
67%
Lose 33%
Win 67%
Fig. 5. Visual explanation of the Monty Hall problem
detailed comparison with Bayesian networks. In particular, we will devise methods for translating Bayesian networks into story graphs.
6
Related Work
In Section 2 we have already discussed work in the philosophy of science regarding theories of explanation. One important idea that has emanated from that work is the importance of causality for explanations [5,29,15,27,4,21,30]. Some notational support for expressing explanations and reasoning about causality has developed in the form of causal graphs [21,30]. Pearl provides a precise definition of causal graphs, and he demonstrates how they support the reasoning about intervention [21]. Our explanation language is based on a story-telling model that is a deliberate restriction of causal graphs to a mostly linear form. Since our language is embedded into Haskell it encourages the use of types to structure the domain of the explanandum. The existence of laws for the explanation operators (briefly pointed out in Section 4.3) allows the systematic generation of alternative explanations and thus provides support for explanation exploration.
A DSL for Explaining Probabilistic Reasoning
357
It is not clear whether similar results hold in less constrained general graph models. Another difference between causal graphs and our explanation model is that intervention is represented in causal graphs by an operation (do) that transforms one causal graph into another, that is, there is no explicit representation of intervention in the graph representation itself. In contrast, we employ a Branch construct that allows the integration of different story lines into one explanation, which means that intervention can be represented explicitly.6 This difference might be important when we consider exploration operations for explanations since the explicit representation supports the exploration of intervention, which could be a huge advantage given the importance that interventions in causal graphs have for explanations. When we look for explanation support for specific domains, we find in the area of algorithm animation [17] many ideas and approaches to illustrate the working of algorithms dynamically through custom-made or (semi-)automatically generated animations [16]. The story-telling metaphor has been employed in that area as well [3], but only in the sense of adding textual explanations and not as a structural guide as in our case. Related to algorithm animation is the more general idea of obtaining explanations of programs or program behavior, which, as discussed in Section 1.1, is not well supported by existing tools. Most debuggers operate on a very low level and often require much time and effort by the user to deliver meaningful information. The approach taken by the WHYLINE system [19] improves this situation by inverting the direction of debugging. This system allows users to ask “Why...?” and “Why didn’t...?” questions about particular program behaviors, and the system responds by pointing to parts of the code responsible for the outcomes in question. Even though this system improves the debugging process significantly, it can only points to places in a program, which limits its explanatory value. In the domain of spreadsheets we have extended this idea so that users can express expectations about outcomes of cells, and the system then generates change suggestions for cells in the spreadsheet that would produce the desired results [1]. From the point of view of causal explanations, the produced change suggestions play the role of counterfactuals. In the context of probabilistic reasoning, although there are languages that support the computation with probabilities, such as IBAL [23] or PFP [7], there is, as far as we know, no language support for generating explanations of probabilistic computations. Finally, the idea of elevating explainability as a design criterion for languages was first proposed in [8] where we have presented a visual language for expressing game strategies. A major guiding principle for the design of the visual notation was the traceabilty of game results, that is, how well the strategies could be explained by relating them to actual game traces. In this sense that visual language is an example of an explanation-oriented language.
6
Pearl [21] briefly describes the concept of twin networks that is similar in this respect.
358
7
M. Erwig and E. Walkingshaw
Conclusions and Future Work
Let us reconsider the boy/girl riddle and compare the program for solving it given in Section 4.1 with the explanation program presented in Section 4.2. Both programs can be used to obtain a solution to the riddle, but only the latter provides an explanation of how and why the solution is obtained. An explanation is given by a linear sequence of values that describe the evolution from some start situation to the value describing the situation to be explained. Such an explanation trace is obtained by threading a value through a list of function applications. Each function is a causal link in the explanation and represents a part of a “story” that constitutes the explanation. The visual notation for probability explanations combines the concepts of spatial partitions and story graphs and suggests the view of an explanation as a set of values that flow along edges and that show changes in their probabilities as growing or shrinking areas. The idea of explanation-oriented programming is to shift the focus from producing values and results to producing explanations for how they are obtained. This shift changes the objective of programming and has implications for language design on multiple levels. In future work we will investigate laws that allow semantics-preserving transformations of explanation to automatically generate a collection of related explanations that can be navigated by the user. We will also investigate the user interface aspect of explanation navigation and identify operations (and potential extensions of the representation, such as new kinds of views on probability distributions) that can help formally capture and support the exploration and navigation of explanations. We will also continue to explore opportunities for explanation-oriented languages in other domains.
References 1. Abraham, R., Erwig, M.: GoalDebug: A Spreadsheet Debugger for End Users. In: 29th IEEE Int. Conf. on Software Engineering, pp. 251–260 (2007) 2. Achinstein, P.: The Nature of Explanation. Oxford University Press, New York (1983) 3. Blumenkrants, M., Starovisky, H., Shamir, A.: Narrative Algorithm Visualization. In: ACM Symp. on Software visualization, pp. 17–26 (2006) 4. Dowe, P.: Physical Causation. Cambridge University Press, Cambridge (2000) 5. Dummett, M.: Bringing About the Past. Philosophical Review 73, 338–359 (1964) 6. Erwig, M.: Abstract Syntax and Semantics of Visual Languages. Journal of Visual Languages and Computing 9(5), 461–483 (1998) 7. Erwig, M., Kollmansberger, S.: Probabilistic Functional Programming in Haskell. Journal of Functional Programming 16(1), 21–34 (2006) 8. Erwig, M., Walkingshaw, E.: A Visual Language for Representing and Explaining Strategies in Game Theory. In: IEEE Int. Symp. on Visual Languages and HumanCentric Computing, pp. 101–108 (2008) 9. Friedman, M.: Explanation and Scientific Understanding. The Journal of Philosophy 71(1), 5–19 (1974)
A DSL for Explaining Probabilistic Reasoning
359
10. Giry, M.: A Categorical Approach to Probability Theory. In: Banaschewski, B. (ed.) Categorical Aspects of Topology and Analysis, pp. 68–85 (1981) 11. Hehner, E.C.R.: Probabilistic Predicative Programming. In: Kozen, D. (ed.) MPC 2004. LNCS, vol. 3125, pp. 169–185. Springer, Heidelberg (2004) 12. Hempel, C.: Aspects of Scientific Explanation and Other Essays in the Philosophy of Science. Free Press, New York (1965) 13. Holland, J., Holyoak, K., Nisbett, R., Thagard, P.: Induction: Processes of Inference, Learning and Discovery. MIT Press, Cambridge (1986) 14. Hudak, P.: Building domain-specific embedded languages. ACM Computing Surveys 28(4es), 196–196 (1996) 15. Humphreys, P.: The Chances of Explanation. Princeton University Press, Princeton (1989) 16. Karavirta, V., Korhonen, A., Malmi, L.: Taxonomy of Algorithm Animation Languages. In: ACM Symp. on Software visualization, pp. 77–85 (2006) 17. Kerren, J.T., Stasko, A.: Algorithm Animation – Introduction. In: Diehl, S. (ed.) Dagstuhl Seminar 2001. LNCS, vol. 2269, pp. 1–15. Springer, Heidelberg (2002) 18. Kitcher, P.: Explanatory Unification and the Causal Structure of the World. In: Kitcher, P., Salmon, W. (eds.) Scientific Explanation, pp. 410–505. University of Minnesota Press, Minneapolis (1989) 19. Ko, A.J., Myers, B.A.: Debugging Reinvented: Asking and Answering Why and Why Not Questions About Program Behavior. In: IEEE Int. Conf. on Software Engineering, pp. 301–310 (2008) 20. Morgan, C., McIver, A., Seidel, K.: Probabilistic Predicate Transformers. ACM Transactions on Programming Languages and Systems 18(3), 325–353 (1996) 21. Pearl, J.: Causality: Models, Reasoning and Inference. Cambridge University Press, Cambridge (2000) 22. Pennington, N., Hastie, R.: Reasoning in Explanation-Based Decision Making. Cognition 49, 123–163 (1993) 23. Ramsey, N., Pfeffer, A.: Stochastic Lambda Calculus and Monads of Probability Distributions. In: 29th Symp. on Principles of Programming Languages, January 2002, pp. 154–165 (2002) 24. Ruben, D.: Explaining Explanation. Routledge, London (1990) 25. Salmon, W.: Scientific Explanation and the Causal Structure of the World. Princeton University Press, Princeton (1984) 26. Salmon, W.: Four Decades of Scientific Explanation. University of Minnesota Press, Minneapolis (1989) 27. Salmon, W.: Causality without Counterfactuals. Philosophy of Science 61, 297–312 (1994) 28. Scaffidi, C., Shaw, M., Myers, B.: Estimating the Numbers of End Users and End User Programmers. In: IEEE Symp. on Visual Languages and Human-Centric Computing, pp. 207–214 (2005) 29. von Wright, G.: Explanation and Understanding. Cornell University Press, Ithaca (1971) 30. Woodward, J.: Making Things Happen. Oxford University Press, New York (2003) 31. Wright, S.: Correlation and Causation. Journal of Agricultural Research 20, 557– 585 (1921)