WATER RESOURCES RESEARCH, VOL. 36, NO. 9, PAGES 2501–2515, SEPTEMBER 2000
A dual-domain mass transfer approach for modeling solute transport in heterogeneous aquifers: Application to the Macrodispersion Experiment (MADE) site C. Erin Feehley and Chunmiao Zheng Department of Geological Sciences, University of Alabama, Tuscaloosa
Fred J. Molz Department of Environmental Engineering and Science, Clemson University, Clemson, South Carolina
Abstract. A large-scale natural-gradient tracer test in a highly heterogeneous aquifer at the Macrodispersion Experiment (MADE) site on the Columbus Air Force Base in Mississippi is simulated using three-dimensional hydraulic conductivity distributions derived from borehole flowmeter test data. Two methods of hydraulic conductivity interpolation, ordinary kriging and conditional geostatistical simulation based on fractional Brownian motion (fBm), are used to construct the hydraulic conductivity distributions needed by the numerical model. Calculated and observed mass distributions are compared to evaluate the effectiveness of the dual-domain mass transfer approach relative to the single-domain advection-dispersion approach. The results show that the classical Fickian advection-dispersion model can reproduce reasonably well the observed tritium plume above a certain concentration limit but fails to reproduce the extensive spreading of the tracer at diluted concentrations as observed in the field. The alternative dual-domain mass transfer model is able to represent the rapid, anomalous spreading significantly better while retaining high concentrations near the injection point. This study demonstrates that the dual-domain mass transfer approach may offer a practical solution to modeling solute transport in highly heterogeneous aquifers where small-scale preferential flow pathways cannot be fully and explicitly represented by the spatial discretization of the numerical model.
1.
Introduction
In recent years several natural-gradient tracer tests have been conducted at the Columbus Air Force Base in Mississippi to study solute transport in heterogeneous aquifers. The Columbus site has been commonly known as the MADE (Macrodispersion Experiment) site. The first experiment (MADE-1) was conducted from October 1986 through June 1988, using bromide and three organic tracers. The data from the MADE-1 test were analyzed and reported in a series of papers [Boggs et al., 1992; Adams and Gelhar, 1992; Rehfeldt et al., 1992; Boggs and Adams, 1992]. These papers present an overview of the site condition and monitoring network, geostatistical analysis of the hydraulic conductivity distribution, spatial moment analysis of the bromide plume, and investigation of adsorption and sampling bias. The second experiment (MADE-2) was conducted between June 1990 and September 1991, using both nonreactive and reactive tracers [Boggs et al., 1993]. The third and most recent test (August 1995 to September 1997) was an in situ release of hydrocarbon chemicals and bromide for the purpose of studying natural attenuation (H. E. Julian et al., Numerical simulation of a natural gradient tracer experiment for the natural attenuation study: Flow and physical transport, submitted to Ground Water, Copyright 2000 by the American Geophysical Union. Paper number 2000WR900148. 0043-1397/00/2000WR900148$09.00
2000). This paper will focus on an analysis of tritium transport during the second (MADE-2) experiment. From over 2000 measurements of the hydraulic conductivity using borehole flowmeters, Rehfeldt et al. [1992] indicate that the shallow alluvial aquifer at the MADE site is at least 1 order of magnitude more heterogeneous than the aquifers at previous test sites. Owing to the extreme heterogeneity in the measured hydraulic conductivity distribution at the site the classical Fickian advection-dispersion model may not be able to provide an adequate tool for transport simulation. Indeed, Zheng and Jiao [1998] simulated the MADE-2 tracer test using a standard advection-dispersion model and found that the modelcalculated plume is not only highly sensitive to the interpretation of the hydraulic conductivity field but also fails to accurately represent significant spreading of the tritium tracer as observed in the field. This spreading is believed to be due to transport along certain preferential flow pathways resulting from the highly heterogeneous hydraulic conductivity distribution. It is evident from their study that the advection-dispersion model may be able to reproduce the plume reasonably well above a certain concentration limit, but it cannot accurately represent spreading at low concentrations which may be occurring below the model grid scale. In another recent study conducted at the MADE site by Eggleston and Rojstaczer [1998], an advection-dispersion model was used to simulate transport of the bromide tracer from the MADE-1 test. This tracer shows a non-Gaussian concentration distribution, similar to the tritium plume modeled in this study.
2501
2502
FEEHLEY ET AL.: DUAL-DOMAIN MASS TRANSFER APPROACH
Three different trend identification methods, polynomial regression, Kalman filtering, and hydrofacies delineation, as well as ordinary kriging, were used in the simulation, but none of the hydraulic conductivity fields produced simulated plumes with the observed non-Gaussian transport behavior. Eggleston and Rojstaczer [1998] state that the observed lack of simulated dispersion may be alleviated by incorporation of small-scale hydraulic conductivity variations, artificial dispersion, or nonequilibrium partitioning. A recent theoretical study [Harvey, 1996; Harvey and Gorelick, 2000] indicates that the dual-domain mass transfer model may be more appropriate than the classical advectiondispersion model for interpreting the tracer experiments at the MADE site. With the dual-domain model the aquifer is conceptualized as consisting of two overlapping domains, a mobile domain in which transport is dominated by advection and an immobile domain in which transport is mostly by molecular diffusion. The exchange between the two domains is characterized by a mass transfer term. The dual-domain concept provides a mechanism for transport to take place along the small-scale preferential pathways which may be smaller than those that can be represented by the spatial discretization of the numerical model. There are experimental and observational evidences suggesting that the mobile-immobile mass transfer process may, indeed, be responsible for the anomalous plume behaviors at the MADE site. Harvey and Gorelick [2000] point out that, unlike the classical advection-dispersion model, the mass transfer model explains the facts that the observed mass of the plume was greater than the injected mass in early snapshots of the plume and less than the injected mass at late times. They suggest that at early times, the relatively clean water in the immobile domain was not sampled, and thus the observed mass was overestimated by incorrectly assuming the same high concentration in both mobile and immobile domains. Similarly, at late times the mass was underestimated because the solute trapped in the immobile domain was not sampled and thus ignored. They also mention that the studies of bromide in core samples [Boggs and Adams, 1992] extracted nearly 2 years after the MADE-1 tracer injection (7 months after the last snapshot) indicate substantial mass in the immobile domain. Furthermore, our direct observations of exceptionally wellexposed aquifer outcrops at several rock quarries adjacent to the MADE site reveal the existence of highly permeable interconnected structures on the scale of centimeters to decimeters sandwiched between low-permeability units. These highly permeable interconnected structures could act as a mobile domain where significant advection takes place. The dual-domain mass transfer concept is not new; in fact, it has been around nearly as long as the advection-dispersion model [see, e.g., Gardner and Brooks, 1957; Barenblatt et al., 1960; Deans, 1963; Coats and Smith, 1964], particularly in modeling transport in structured soils or fractured media [Skopp and Warrick, 1974; van Genuchten et al., 1974; Selim et al., 1977; van Genutchen and Wierenga, 1977; Rao et al., 1979, 1980; Grisak and Pickens, 1980; Huyakorn et al., 1983; Nkedi-Kizaa et al., 1983; Herr et al., 1989; Haselow and Greenkorn, 1991; Gerke and van Geuchten, 1993; Zimmerman et al., 1993; Brusseau et al., 1994; Haggerty and Gorelick, 1995, 1998; Hamm and Bidaux, 1996; Hu and Brusseau, 1996; Zhang and Brusseau, 1999; Harvey and Gorelick, 2000]. These and other studies have demonstrated that locally heterogeneous media (i.e., small clay lenses or microstratified laminae of different hydraulic conductivi-
ties) can cause nonideal transport, controlled by preferential flow and rate-limited mass transfer between mobile and immobile domains. A recent overview of the dual-domain approach and data requirements is provided by Griffioen et al. [1998]. Despite numerous studies of the mobile-immobile mass transfer approach, however, very few studies have been conducted to establish the applicability and usefulness of the dualdomain approach for characterizing plume-scale solute transport in heterogeneous media under field conditions. The primary objective of this paper is to demonstrate that transport models based on the dual-domain mass transfer approach may provide a more effective means for modeling transport in highly heterogeneous sites. We will first briefly describe the site conditions and the tracer test and then discuss the dual-domain mass transfer modeling approach and the procedures for model construction and calibration. Finally, we compare the simulation results based on the dual-domain mass transfer model with those based on the standard advectiondispersion model. In addition, we will evaluate the influence of hydraulic conductivity interpolation algorithms on the simulation results by using two algorithms, that is, ordinary kriging and conditioned fractional Brownian motion (fBm), to develop hydraulic conductivity distributions from the flowmeter test data. It should be pointed out that this study is mainly intended to compare the dual-domain mass transfer model with the classical advection-dispersion model as applied to the MADE site. A secondary objective is to investigate whether or not the conclusion resulting from the comparison holds for different techniques of generating the hydraulic conductivity distributions. Ordinary kriging and fBm-based techniques were selected because the former is a simple deterministic technique widely used in field applications, while the latter represents a more sophisticated stochastic simulation methodology. As will be shown in subsequent comparisons of simulation results, the dual-domain mass transfer model results in significant improvement over the classical advection-dispersion model in representing the non-Gaussian behavior of the observed plume, regardless of whether the hydraulic conductivity distribution is generated with ordinary kriging or the fBm-based technique. Similar results are given by Feehley [1999] in which conditional sequential Gaussian simulation was the technique used to generate realizations of hydraulic conductivity based on the same variogram as used for ordinary kriging. This paper does not consider the indicator-simulation type of hydraulic conductivity generating schemes which would be the obvious approach if the preferential pathways of high hydraulic conductivity could be resolved at the grid scale and explicitly modeled. However, this study is only directed at field-scale problems where sufficient data do not exist for resolving and representing the preferential pathways at the grid scale.
2. 2.1.
Description of the Site and the Test Site Characterization
The field data used for this study are from the MADE site at the Columbus Air Force Base in Mississippi (Figure 1). The shallow unconfined aquifer which immediately underlies the site consists of an alluvial terrace deposit with an average thickness of 11 m. Pleistocene river deposits associated with the nearby Tombigbee and Buttahatchee Rivers may account for the heterogeneity observed in the field. The heterogeneous aquifer is composed of poorly sorted to well-sorted sandy
FEEHLEY ET AL.: DUAL-DOMAIN MASS TRANSFER APPROACH
Figure 1. Location of the Macro Dispersion Experiment (MADE) site [after Boggs et al., 1992]. gravel and gravely sand with significant amounts of silt and clay. Sediments are generally unconsolidated. Soil facies occur as irregular lenses and layers having horizontal dimensions ranging up to 8 m and vertical dimensions of less than 1 m.
2503
Marine sediments, which belong to the Eutaw Formation and consist of clay, silts, and fine-grained sands, form an aquitard beneath the alluvial aquifer. A more detailed description of the site condition is provided by Boggs et al. [1990, 1992]. The spatial distribution of hydraulic conductivity at the test site was determined from over 2000 measurements obtained from borehole flowmeter tests conducted at different vertical intervals in around 50 fully penetrating wells. Details of the borehole flowmeter tests are described by Rehfeldt et al. [1992]. The geometric mean of all measured hydraulic conductivity data is approximately 5 ⫻ 10⫺3 cm s⫺1, but the variations in the horizontal and vertical directions range from 2 to 4 orders of magnitude. The overall variance of the natural logarithm of hydraulic conductivity is 4.5 [Rehfeldt et al., 1992], which is significantly greater than that of any previously reported tracer test sites. For example, the reported variance of ln K is 0.29 for the Borden site [McKay et al., 1986; Sudicky, 1986], 0.26 for the Cape Cod site [Garabedian, 1987; LeBlanc et al., 1991], and 0.031 for the Twin Lake site [Killey and Moltyaner, 1988]. The hydraulic head field at the experiment site was monitored with piezometers installed at the flowmeter wells (see Figure 2). Some of these piezometers were equipped with continuous groundwater level recorders, while the remainder were monitored at monthly intervals during the study. The general direction of groundwater movement is along the y axis of Figure 2, although local differences in the magnitude and the direction of hydraulic gradient were evident [Boggs et al., 1993]. 2.2.
MADE-2 Tracer Test
Several natural-gradient tracer tests have been conducted at this site. In the MADE-2 test conducted between June 1990 and September 1991 [Boggs et al., 1993], a tritium tracer was
Figure 2. Three-dimensional view of the monitoring network at the MADE site. Vertical lines consisting of closely spaced dots indicate the locations of the flowmeters. Circles indicate multilevel sampler locations.
2504
FEEHLEY ET AL.: DUAL-DOMAIN MASS TRANSFER APPROACH
Figure 3. Observed tritium plume at 328 days after injection. injected into the aquifer for 48.5 hours at a uniform rate of 3.3 L min⫺1. The tracer solution was injected through five wells spaced 1 m apart in a linear array. Each injection well was screened over a 0.6 m interval between elevations 57.5 and 58.1 m, approximately halfway between the water table and the aquifer bottom. The injected fluid had a tritium concentration of 55,610 pCi mL⫺1. The total injected mass (activity) was 0.5387 Ci. Extensive snapshots of the tracer plume were taken at 27, 132, 224, 328, and 440 days. This study considers only the tritium concentration plume at 328 days because the plumes at earlier times were not as extensive, and the plume at 440 days was not sampled completely. The tritium concentration present in field samples was measured with a liquid scintillation analyzer. Injection continued for approximately 2 days, and the maximum increase in hydraulic head in the injection wells was 0.45 m. The 328 multilevel samplers (MLS) constructed for monitoring the tracer plume in three dimensions are shown in Figure 2. Each MLS was equipped with 20 –30 sampling points spaced 0.38 m apart in the vertical dimension. The network consisted of over 6000 sampling points. Groundwater samples from each MLS were collected for each of the five snapshots. 2.3.
Observed Tritium Plume
Shown in Figure 3 is the observed tritium plume at 328 days after the start of injection. The plume was generated using inverse distance squared interpolation of all measured concentration values. It is highly irregular and significantly fringy. From studies conducted at the Bordon aquifer, it would be predicted that the plume would have traveled a considerable distance from the injection area after such a long observation period. However, the location with the maximum observed concentration of approximately 3800 pCi mL⫺1 is less than 6 m
away from the injection location. This may be explained by the fact that the aquifer is extremely heterogeneous and injection wells are located in a zone with relatively low hydraulic conductivity thus trapping the tracer. Downstream, there is diffusive spreading at low concentration (5 pCi mL⫺1, the lower limit of concentration shown in Figure 3, is only 0.13% of the maximum observed concentration). This phenomenon may be caused by the existence of preferential connected flow pathways. Such an array would constitute a highly correlated longrange structure which would yield a flow field violating the basic assumptions of the Fickian dispersion model, as observed numerically by Zheng and Jiao [1998].
3. 3.1.
Modeling Approach Conceptual Models
The classical, Fickian advection-dispersion transport equation for conservative tracers is
⭸C ⭸ ⫽ ⭸t ⭸ xi
冉
D ij
冊
⭸C ⭸ ⫺ 共q C兲 ⫹ q sC s, ⭸ xj ⭸ xi i
(1)
where C is the solute concentration, is the porosity, t is time, D ij is the dispersion coefficient tensor, q i is the Darcy flux, q s is the fluid sink/source, and C s is the concentration of the fluid sink/source. The classical, Fickian advection-dispersion model, first introduced by Taylor [1953] and Bear [1961] among others, has been shown to be inadequate for representing field-scale solute transport in highly heterogeneous porous media [e.g., Carrera, 1993; Harvey, 1996; Zheng and Jiao, 1998; Benson et al., 2000]. This inadequacy is probably caused by the inability to account for local-scale physical heterogeneity and solute transport
FEEHLEY ET AL.: DUAL-DOMAIN MASS TRANSFER APPROACH
along preferential pathways that may persist at scales much smaller than those that can be practically represented in flow and transport models. It has been demonstrated that locally heterogeneous media (i.e., small clay lenses or microstratified laminae of different hydraulic conductivities) can cause nonGaussian transport [Herr et al., 1989]. Laboratory-scale miscible displacement experiments performed to explore the effect of local-scale heterogeneities on contaminant transport showed that these heterogeneities can cause enhanced dispersion, early breakthrough, and long tailing, which are difficult to model with the advection-dispersion equation [Haselow and Greenkorn, 1991; Brusseau and Zachara, 1993]. Dye-tracing studies indicate that preferential flow of water, particularly in structured soils, is a common phenomenon [Flury et al., 1996]. An alternative to the single-porosity advection-dispersion model is the dual-porosity or dual-domain mass transfer model, as given below for conservative tracers:
m
⭸C m ⭸C im ⭸ ⫹ im ⫽ ⭸t ⭸t ⭸ xi
im
冉
冊
⭸C m ⭸ ⫺ 共q C 兲 ⫹ q sC s ⭸ xj ⭸ xi i m (2) ⭸C im ⫽  共C m ⫺ C im兲, ⭸t
mD ij
where m is the porosity of the “mobile” domain, or pore spaces filled with mobile water, im is the porosity of the “immobile” domain, or pore spaces filled with immobile water,  is the mass transfer rate coefficient, C m is the concentration in the mobile domain, and C im is the concentration in the immobile domain. The dual-domain mass transfer model partitions transport into two domains: Transport in the mobile domain is mainly by advection, while transport in the immobile domain is by diffusion. Porosity at any location is characterized by two parameters: mobile ( m ) and immobile ( im ) porosities, with the total porosity equal to ( m ⫹ im ). The connection between the zones of mobile and immobile fluids is through a mass transfer rate proportional to the concentration difference between the two zones, with constant of proportionality . Other factors affecting mass transfer include sorption, measurement scale, and fluid velocity [Griffioen et al., 1998]. The larger the rate constant  is, the faster transport occurs between the mobile and immobile zones for a given concentration difference. As  3 ⬁, the connection is instantaneous, and the system acts like a single-domain model with the porosity approaching total porosity. Conversely, as  3 0, the system behaves as a singledomain model with total porosity equal to m . The mass transfer rates can be determined through laboratory and field procedures of Clothier et al. [1992], Jaynes et al. [1995], and Hollenbeck et al. [1999] or through trial-and-error model calibration. 3.2.
Spatial Discretization and Boundary Conditions
A three-dimensional block-centered finite difference grid was used for modeling of the site. The model domain has 55 columns, 153 rows, and 22 layers, with 185,130 nodes covering a flow domain of 110 ⫻ 306 ⫻ 11 m. The grid spacing is 2 ⫻ 2 m in the horizontal direction and 0.5 m in the vertical direction. Specified-head boundaries along the north and south, and no-flow boundaries to the east and west, bound the model domain laterally. The Eutaw Formation acts as a no-flow boundary at the bottom, and a uniform recharge rate is specified at the water table. Transport simulation was conducted
2505
using the mesh developed for the flow model. The boundary conditions for the transport model are zero-mass flux at all boundaries except at the northern boundary where dispersive flux is assumed to be zero and advective flux is determined by outflow rate and concentration. Values along the specified-head boundaries were calibrated to achieve the best match between the calculated and observed heads at 48 piezometers. The calibration was done manually by minimizing the root mean of squared differences between the calculated and observed heads. 3.3.
Simulation and Calibration Procedures
Only steady state flow simulation was attempted using the three-dimensional groundwater flow model MODFLOW code [McDonald and Harbaugh, 1988] because detailed data required for transient calibration such as specific yield, storage coefficient, and time-dependent recharge distribution were not available. The steady state flow equation solved by MODFLOW is as follows: ⭸ ⭸ xi
冉
Ki
冊
⭸h ⫹ q s ⫽ 0, ⭸ xi
(3)
where h is the hydraulic head and K i are the principal components of hydraulic conductivity aligned with the coordinate axes. Because the transport simulation was intended for the tritium plume at 328 days, the hydraulic heads observed within 1 year of the tracer test were averaged and used as the observed steady state heads. A first-order trend analysis method used by Zheng and Jiao [1998] was used to generate the initial head distribution for the steady state flow model from the following equation: h共 x, y, z兲 ⫽ a 0 ⫹ a 1 x ⫹ a 2 y ⫹ a 3 z,
(4)
where coefficient a 0 represents a reference background head value and coefficients a 1, a 2, and a 3 represent the hydraulic gradients in the x, y, and z directions, respectively. These coefficients were initially estimated using observed heads at the piezometers. They were then used in (4) to generate a three-dimensional head field. Two sets of coefficients were estimated for the northern and southern portions of the flow model to reflect the changes in general flow direction. The generated heads at the two specified-head boundaries were used as the boundary heads for the flow model. After each trial model run the calculated heads at the observation points were compared with the observed values. All four coefficients in (4) were adjusted, and the boundary heads were replaced with newly generated values. This procedure was repeated until a satisfactory match was achieved between the calculated and observed heads at the observation points. As mentioned in section 2.2, the tracer was injected into the aquifer over a period of 2 days. To accommodate the injection in the model, the flow field over 328 days was approximated by two instantaneous steady state stress periods of 2 and 326 days, respectively. In the first stress period the tracer injection through five wells was represented by three cells with a total injection rate of 3.3 L min⫺1 and a concentration of 55,610 pCi mL⫺1. The transport model is solved using the MT3DMS code [Zheng and Wang, 1999], which includes both the standard advection-dispersion approach and the alternative dualdomain mass transfer approach.
2506
FEEHLEY ET AL.: DUAL-DOMAIN MASS TRANSFER APPROACH
Figure 4. Three-dimensional conductivity field generated with kriging.
3.4.
Hydraulic Conductivity Generation
Because the true hydraulic conductivity field is unknown except for local measurements, the measured hydraulic conductivity distribution was directly incorporated into the model by assigning a different hydraulic conductivity value to each model node using interpolation. Two methods of estimating the hydraulic conductivity were evaluated by comparing transport model results to the observed tritium plume at 328 days. If the calculated plume is similar to the observed plume, the proper hydraulic conductivity patterns have been effectively reproduced by the interpolation method. All estimation was performed on ln (K) data and then transformed to hydraulic conductivity values (m d⫺1) for flow simulation. The first approach used to represent the hydraulic conductivity was ordinary kriging. On the basis of Rehfeldt et al. [1992] the exponential model was used to fit the measured ln (K) variogram,
冋
冉 冊册
␥ 共h兲 ⫽ 2 1 ⫺ exp ⫺
h
,
(5)
where 2 is the variance of ln (K) and the spatial correlation length. The sill value was set equal to the ln K variance of 4.5, and the spatial correlation length was estimated to be 12.8 m and 1.64 m for the horizontal and vertical directions, respectively. These values were input into a three-dimensional kriging program [Deutsch and Journel, 1998]; the three-dimensional kriged hydraulic conductivity field is shown in Figure 4. The corner of the cutaway block represents the approximate location of the observed tritium plume centerline. In order to investigate the influence of hydraulic conductivity interpolation methods on the modeling results, another method of hydraulic conductivity generation was used. As real conductivity distributions are not the smooth distributions that the kriging algorithm produces, a method of generating non-
smooth hydraulic conductivity distributions is desired. A significant amount of information indicates that hydraulic conductivity distributions, in general, may be described by power law variograms [see, e.g., Neuman, 1990; Di Federico and Neuman, 1997; Liu and Molz, 1998]. Essentially, all data sets studied to date, including the MADE site data, have shown scaling typical of a truncated power law variogram, with fractional Brownian motion (fBm) being suggested as an overall model [Molz et al., 1997]. Once a fractal pattern is identified, hydraulic conductivity can be generated to preserve heterogeneity at different scales. Many methods are available to determine whether or not hydraulic conductivity data exhibit fractal-like structure (scaling), including rescaled-range analysis [Molz and Bowman, 1993], the variogram method [Kemblowski and Chang, 1993], and the spectral method [Molz et al., 1997]. Work in review further indicates that this is, indeed, the case for the MADE site hydraulic conductivity data [Boufadel et al., 2000]. For fractal distributions the variogram is not bounded as it is correlated over all scales and is described by a power law [Hewett and Behrens, 1988]:
␥ 共l 兲 ⫽ ␥ 1l 2H,
(6)
where ␥1 is the variogram value at l ⫽ 1 and H is the fractal codimension or the Hurst coefficient, which is equal to the difference between the Euclidean dimension in which the fractal distribution is described and the fractal dimension of the distribution. Thus the codimension in two-dimensional space is given by [see Kemblowski and Chang, 1993] H ⫽ 2 ⫺ D.
(7)
The distributions whose variogram is given by (6) are statistically self-affine because variations over any scale rl may be expressed in terms of the variations over a scale l by
FEEHLEY ET AL.: DUAL-DOMAIN MASS TRANSFER APPROACH
2507
Figure 5. One realization of conditioned hydraulic conductivity distribution based on fractional Brownian motion (fBm).
␥ 共rl 兲 ⫽ ␥ 共l 兲r 2H,
(8)
where r is a scaling factor. Hence the variance at any scale can be defined by the variance estimated at any other scale, since ␥ (rl )/ ␥ 2H is scale invariant. Plotting the variogram on log-log axes yields log ␥ 共l 兲 ⫽ log ␥ 1 ⫹ 2H log l,
(9)
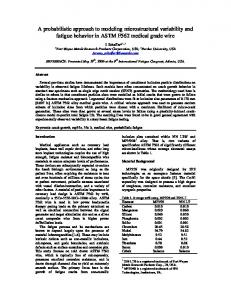
and calculating the slope (2H ⫽ 4 ⫺ 2D) will result in the estimate of the fractal dimension [Kemblowski and Chang, 1993]. However, only the early portion of the variogram relating to short lags would be expected to produce accurate results. If the data are, in fact, fractal (i.e., the variogram is proportional to the lag and never reaches a sill), any method of geostatistical simulation, preferably one that considers the whole range correlations, may be used to generate realizations of hydraulic conductivity (see Molz et al. [1997] for a discussion of the spectral method). Each realization will be statistically similar to the next, and owing to the scale-invariant property of fractals, values generated will retain small-scale heterogeneities that may help simulate preferential pathways. The conditional realizations of hydraulic conductivity produced for this study were generated using a combination of successive random additions and the spectral method of Molz et al. [1997] and were based on a Hurst coefficient of 0.4. One of these realizations is shown in Figure 5. Compared to the kriged hydraulic conductivity field shown in Figure 4, it is evident that the conditional realization includes many more small-scale variabilities. The difference between Figures 4 and 5 also underscores the large uncertainty in generating the hydraulic conductivity distribution in a highly heterogeneous aquifer such as that at the MADE site.
3.5.
Assignment of Transport Properties
An average total porosity of 0.35 was used for the entire model area, which is close to the value of 0.32 determined from the soil cores collected from the test site [Boggs et al., 1990]. The difference in the two values was intended to account for potential consolidation during handling of the core samples [Adams and Gelhar, 1992]. A uniform recharge rate of 1.4 ⫻ 10⫺4 m d⫺1 was used for the steady state flow model. Different values of longitudinal dispersivities were tested. The ratios of the transverse and vertical dispersivities to the longitudinal dispersivity were fixed at 0.01 and 0.001, respectively, consistent with very limited transverse and vertical dispersion as observed at the MADE site and other field sites [Gelhar et al., 1992]. For the dual-domain mass transfer model it is also necessary to specify mobile and immobile porosities and a mass transfer rate coefficient. These parameters were estimated through trial-and-error calibration based on a comparison of observed and calculated tritium plumes. In all simulations conducted, a mobile porosity of 1/8 of the total porosity was judged to produce the most consistent match between observed and calculated plumes. The mass transfer rate coefficient was found to be sensitive to the hydraulic conductivity distribution. For simulations with the kriged field a uniform value of 0.001 day⫺1 was used for the entire model domain. For simulations with the fractal-based field, a uniform value of 0.0005 day⫺1 was used. Thus increased heterogeneity embedded in the fractal-based hydraulic conductivity distribution apparently reduces the optimum rate coefficient by a factor of 2. The effect of the mass transfer rate on the simulated plume will be discussed in greater detail in section 4.2.
2508
FEEHLEY ET AL.: DUAL-DOMAIN MASS TRANSFER APPROACH
Figure 6. Simulated tritium plume at 328 days after injection with the advection-dispersion model (simulation 1). The hydraulic conductivity distribution is interpolated with kriging; the longitudinal dispersivity used is 5 m. 3.6.
Mass Distributions
The model domain was divided into six equally spaced zones along the general flow direction (the y axis) in which the mobile-domain mass (i.e., the zeroth moment) of the simulated plume was calculated and compared with that of the observed plume. The mass of each zone is determined by computing the mass per zone and dividing it by the total mass of all zones. This “relative” mass instead of absolute mass is used for the convenience of comparison.
4. Simulation Results for the Kriged Hydraulic Conductivity Field 4.1.
Advection-Dispersion Model
For the advection-dispersion model a single porosity equal to the total porosity of 0.35 was used. In a previous study by Zheng and Jiao [1998] a longitudinal dispersivity value of 5.0 m was found to result in a reasonable match of the overall plume configuration to the observed plume above a certain concentration limit. The longitudinal dispersivity was varied spatially during the calibration process, but the overall match was not significantly improved; thus those results are not reported here. The first simulation in this communication (simulation 1), based on the single-domain model, utilizes the hydraulic conductivity field generated with ordinary kriging as shown in Figure 4. The calculated plume is shown in Figure 6. A large amount of mass is retained near the injection wells, as is observed in the measured data (Figure 3). However, the simulated plume fails to represent rapid, anomalous spreading at low concentrations. Furthermore, the resulting plume does not
reproduce the fringy appearance of the observed plume. The distribution of calculated relative mass in the different zones (shown in Figure 7 as columns with a dot pattern) does not closely mimic the observed (shown as solid columns). In the injection area, zone 1, the relative mass of the calculated plume is much higher than that of the observed plume. There is a steady decline in calculated relative mass with increasing distance from the injection zone, while the relative mass for the observed plume shows a sharp decrease from zone 1 to 2 but increases and decreases again with distance. In the far field (zones 5 and 6) the relative mass for the calculated plume is zero even though the observed plume shows significant mass in these zones. Several possible reasons exist for the discrepancies between the observed and calculated plumes. First, characterization of solute transport in highly heterogeneous porous media is, in general, very difficult because of the large physical heterogeneity of aquifers and a lack of a satisfactory way to depict the heterogeneity and retain spatial variability for adequately simulating the transport process [Carrera, 1993; Molz and Boman, 1993; Jang et al., 1994; Harvey, 1996]. Measured hydraulic conductivity distributions need to be incorporated into models by assigning a different hydraulic conductivity value to each model node using interpolation. Interpolation methods, such as the method of ordinary kriging used for simulation 1, generate a unique hydraulic conductivity field and only preserve local accuracy near data points while smoothing data in areas of sparse sampling [Deutsch and Journel, 1998]. Second, even with a more sophisticated hydraulic conductivity generation methodology, it may still be impossible to achieve a sufficiently accurate representation of the true hydraulic conductivity vari-
FEEHLEY ET AL.: DUAL-DOMAIN MASS TRANSFER APPROACH
2509
Figure 7. Bar graph showing results of the single-domain advection-dispersion model (ADM) and the dual-domain mass transfer model (DDMT) for simulations 1 and 2 based on the kriged hydraulic conductivity field.
ations and the resulting velocity field, if macroscopic- or localscale heterogeneities are smaller than numerical model grid spacings and occur in certain preferential directions. The failure to account for these preferential pathways eliminates the mechanism for rapid spreading of a certain amount of mass; hence the resulting simulated plume in Figure 6 does not show mass transported a significant distance downstream. 4.2.
Dual-Domain Mass Transfer Model
The second simulation (simulation 2) was based on the dualdomain mass transfer model with the same kriging-generated hydraulic conductivity distribution as used in simulation 1. The mass transfer rate () used for this simulation is 0.001 day⫺1, and the mobile porosity was set to 1/8 of the total porosity. The longitudinal dispersivity used in the dual-domain mass transfer model is 1.0 m, compared to 5.0 m used in the single-domain advection-dispersion model (simulation 1). Note that the dispersivity is the driving force for all mechanical dispersion and mixing in the single-domain advection-dispersion model. However, the dispersivity becomes secondary in the dual-domain mass transfer model as much of the mechanical dispersion and mixing are accounted for by mass transfer between the mobile and immobile domains at each model cell. Thus the dispersivity used in this simulation is necessarily smaller than that in the previous simulation and intended to account for randomly occurring local dispersion not already accommodated by the mass transfer process. Additional analysis has shown that the simulated plume in the dual-domain mass transfer model is not sensitive to the dispersivity value. The overall configuration of the simulated plume, Figure 8, resembles that of the observed plume, Figure 3. There is a high amount of mass near the source area and sufficient spreading downstream at low concentrations. The narrowing of the plume front as simulated by the advection-dispersion model (simulation 1) has disappeared. However, the simulated plume is considerably smoother than the observed plume. The rela-
tive mass for simulation 2 is shown in Figure 7 as columns with a line pattern. The calculated relative mass in each zone closely resembles that of the observed plume. While the match is not exact, the result is much more satisfying than that from the previous simulation based on the advection-dispersion model. By simulating a mobile and immobile domain, the dualdomain mass transfer model allows for advective transport to occur in the mobile region at velocities increased inversely proportional to the ratio of mobile/immobile porosities thus providing a mechanism for rapid spreading of a certain amount of mass downstream while retaining a bulk of mass near the source area. The smooth contour surface appears for the same reason as for simulation 1 (i.e., because of the use of the kriging-generated hydraulic conductivity field), but simulation 2 shows a significant improvement in matching the overall size and shape of the observed plume compared to simulation 1.
5. Simulation Results for the Fractal Hydraulic Conductivity Field 5.1.
Advection-Dispersion Model
The third simulation (simulation 3) was again based on the advection-dispersion model but utilizes a realization of the fBm-generated hydraulic conductivity field. The particular realization used is shown in Figure 5, and the calculated plume is shown in Figure 9. The calculated plume for simulation 3 is highly asymmetrical, and a large amount of mass is retained near the injection wells, as is observed in the measured data (Figure 3). Some anomalous spreading at low concentrations is represented, with the front of the plume extending to a little over 200 m in the flow direction. Although the simulated plume is not as long as the observed plume, the nonsmooth appearance is desirable (compared to the smooth contour surface seen in simulation 1). The distribution of the calculated relative mass along the aquifer zones (shown in Figure 10 as
2510
FEEHLEY ET AL.: DUAL-DOMAIN MASS TRANSFER APPROACH
Figure 8. Simulated tritium plume at 328 days after injection with the dual-domain mass transfer model (simulation 2). The hydraulic conductivity distribution is interpolated with kriging; the longitudinal dispersivity used is 1 m; the ratio of mobile/total porosities used is 1/8; and the mass transfer rate is 0.001 day⫺1.
Figure 9. Simulated tritium plume at 328 days after injection with the advection-dispersion model (simulation 3). The hydraulic conductivity distribution is based on fBm; the longitudinal dispersivity used is 5 m.
FEEHLEY ET AL.: DUAL-DOMAIN MASS TRANSFER APPROACH
2511
the simulated plume captures the fringy appearance of the observed plume better. However, the calculated plume does not travel nearly as far downgradient as observed. Also, it should be pointed out that, as with any geostatistical simulation, many equally probable realizations that preserve regional variability can be generated. Simulation 3 is the result based on just one randomly selected realization. Simulated plumes vary from one simulation to another according to the realization selected and the corresponding velocity field. However, none of the several realizations examined, which were all conditioned to the data, resulted in any significant improvement in matching the observed plume in the far field. 5.2.
Figure 10. Bar graph showing results of the single-domain advection-dispersion model (ADM) and the dual-domain mass transfer model (DDMT) for simulations 3 and 4 based on the fBm-generated hydraulic conductivity field. columns with a dot pattern) shows the same trend of steady decline in relative mass with increasing distance from the source area as seen in simulation 1. There is less mass in zone 1 than that in the corresponding simulation 1 with the kriged hydraulic conductivity field, but the mass travels farther downstream into zone 5. The fBm-generated hydraulic conductivity field retains more small-scale heterogeneity compared to the kriged field. Thus
Dual-Domain Mass Transfer Model
The fourth simulation (simulation 4) was also based on the dual-domain mass transfer model but utilizes the same fBmgenerated hydraulic conductivity field as used for simulation 3. The mass transfer rate used for this simulation is 0.0005 day⫺1, which is one half of the value for the dual-domain model based on the kriged hydraulic conductivity field (simulation 2). As pointed out in section 3.5, the smaller mass transfer rate in this simulation is apparently a result of more detailed heterogeneity included in the fBm-generated hydraulic conductivity field. The mobile porosity was again set to 1/8 of the total porosity, and the longitudinal dispersivity was 1.0 m, as in simulation 2. The overall size, shape, and structure of the calculated plume from this simulation, as shown in Figure 11, are very similar to those of the observed tritium plume, as shown in Figure 3. As in simulation 2, a high amount of mass is retained near the injection wells, while a sufficient amount of mass spreads downstream at low concentrations. The narrowing of the
Figure 11. Simulated tritium plume at 328 days after injection with the dual-domain mass transfer model (simulation 4). The hydraulic conductivity distribution is based on fBm; the longitudinal dispersivity used is 1 m; the ratio of mobile/total porosities used is 1/8; and the mass transfer rate is 0.0005 day⫺1.
2512
FEEHLEY ET AL.: DUAL-DOMAIN MASS TRANSFER APPROACH
Table 1. Summary of Transport Parameters for the MADE-2 Tritium Plume Used in This Study and Harvey and Gorelick [2000] Model Identification Dimension K-field generating scheme
AdvectionDispersion
Dual-Domain Mass Transfer
AdvectionDispersion
Dual-Domain Mass Transfer
Harvey and Gorelick [2000]
Simulation 1 3-D kriging
Simulation 2 3-D kriging
Simulation 3 3-D fBm
Simulation 4 3-D fBm
5 0.05 0.005 N/A N/A
1 0.01 0.001 1/8 0.0033
5 0.05 0.005 N/A N/A
1 0.01 0.001 1/8 0.0016
HG2000 2-D Analytically generated velocity field 0 0 0 1/7 0.011
1.0
1.0
1.0
1.0
Longitudinal dispersivity, m Horizontal transverse dispersivity, m Vertical transverse dispersivity, m Ratio of mobile to total porositiesa Product of mass transfer rate and immobile porosity,b day⫺1 Retardation factor
1.13
a The original value given by Harvey and Gorelick [2000] is 1/6 for the ratio of mobile to immobile porosities, which is converted to 1/7 for the ratio of mobile to total porosities. b The mass transfer rate as defined by Harvey and Gorelick [2000] is equivalent to the product of mass transfer rate and immobile porosity as defined in this study.
plume front simulated by the advection-dispersion model (simulations 1 and 3) has also disappeared. Furthermore, the plume has a fringy appearance, similar to the observed plume, but unlike that simulated with a kriged hydraulic conductivity field. The calculated relative mass for simulation 4 is shown in Figure 10 as columns with a line pattern. The calculated relative mass in each zone resembles that of the observed plume relative mass. The match of calculated relative mass to the observed is not as close as that for simulation 2 near the source, but the match in downstream zones is comparable. Again, the result is much more satisfying than those from simulations 1 and 3 based on the advection-dispersion model. It should be pointed out again that the results of this simulation, as those of simulation 3, are based on an arbitrarily selected realization of the conditional fBm hydraulic conductivity field. The simulation results necessarily vary from one realization to another. However, the basic conclusions remain the same.
6.
Comparison and Discussion
As pointed out previously, a fundamental difficulty with the classical advection-dispersion model at the MADE site may be the existence of preferential flow pathways (high-conductivity lenses) whose scale (centimeters to decimeters) is smaller than the grid spacing (0.5 to ⬃2 m) of the numerical model. Unless we have sufficiently detailed hydraulic conductivity data to explicitly delineate these preferential flow pathways and sufficiently fine grid resolution to fully incorporate them in the numerical model, the advection-dispersion model is unlikely to reproduce the observed plume behavior satisfactorily, regardless of what technique is used to generate the hydraulic conductivity distribution, as illustrated by simulations 1 and 3. The use of the dual-domain mass transfer model has allowed for fast spreading to be represented in both simulations 2 and 4, regardless of the method of hydraulic conductivity generation. Both simulations 2 and 4 result in satisfactory matches between calculated and observed plumes and mass distributions, particularly at low concentrations, which represents a significant improvement over simulations 1 and 3. From a comparison of simulations 2 and 4 it is clear that the simulated plume based on the kriging-produced hydraulic conductivity
field appears much smoother than that based on the fBmgenerated hydraulic conductivity field, because of the smoothing effect of the kriging algorithm. However, it is noted that the difference in the simulation results caused by using different methods of hydraulic conductivity generation is secondary compared to that caused by using different conceptual models of mass transport, that is, the classical advection-dispersion model or the alternative dual-domain mass transfer model. Table 1 provides a summary of transport parameters for both the advection-dispersion and dual-domain mass transfer models developed in this study and those of the dual-domain mass transfer model used by Harvey and Gorelick [2000]. While the dispersivity becomes secondary in the dual-domain mass transfer model, two new parameters are required, namely, the ratio of mobile to total porosities and the mass transfer rate. The recent study on the applicability of the dual-domain mass transfer approach for the MADE site by Harvey and Gorelick [2000] yields a ratio of mobile to total porosities of 1/7 and a mass transfer rate of 0.011 day⫺1 for the tritium test, compared to the best estimates of 1/8 and 0.0005– 0.001 day⫺1 from this study. Note that the mass transfer rate as defined by Harvey and Gorelick [2000] is equivalent to the product of mass transfer rate and immobile porosity as defined in this study. Thus for comparison purposes the values of 0.0005– 0.001 day⫺1 obtained in this study are actually 0.0016 – 0.0033 day⫺1 according to the definition used by Harvey and Gorelick [2000]. The agreement between the two studies for the porosity ratio is remarkable considering how different the modeling approaches in the two studies are. Harvey and Gorelick [2000] generated a two-dimensional velocity field directly through a steady state, accelerating analytical model and used the velocity field for transport calculations. In contrast, this study started with the three-dimensional hydraulic conductivity distribution to simulate the velocity field and then used the calculated and calibrated three-dimensional flow field for transport modeling. For this reason it is believed that the numerical model developed in this study has incorporated much more detailed heterogeneity and, as a result, requires smaller mass transfer rates (by approximately 1 order of magnitude) than that used by Harvey and Gorelick [2000]. It should also be pointed out that Harvey and Gorelick [2000] assumed small sorption but no local dispersion for the tritium tracer (see
FEEHLEY ET AL.: DUAL-DOMAIN MASS TRANSFER APPROACH
2513
Table 1). In contrast, tritium is assumed to be conservative (no sorption) in this study, but some amount of local dispersion is included. This difference in the assumptions between the two studies also contributes to the difference in the mass transfer rate.
7.
Sensitivity of Dual-Domain Model Parameters
Many simulation runs based on the dual-domain mass transfer model using the fBm- and kriging-generated hydraulic conductivity distributions were run with different combinations of the transport parameters. The results of a sensitivity analysis of how relative mass varies with changes in mass transfer rate are shown in Figure 12. As results were similar regardless of the method of hydraulic conductivity generation, only results for the kriged hydraulic conductivity distribution are shown. In all runs shown in Figure 12, mobile porosity, m , was set to 1/8 of the total porosity. When the mass transfer rate is low, the system behaves more like a single-domain system with the total porosity approaching the porosity of m . Therefore the plume moves downstream at a faster rate, causing higher relative mass to appear in the last three zones. As the mass transfer rate increases substantially, the connection between the domains is more instantaneous. The system is acting like a singledomain model with the porosity approaching total porosity. The plume is traveling through the domain at a slower rate, and mass is trapped in the first zone because of the faster connection between mobile and immobile zones. Less mass moves downstream. These results suggest a combination of mass transfer rates might best model the characteristics of the observed plume. The results of an analysis of how relative mass varies with changes in the ratio of mobile/total porosity is shown in Figure 13. The mass transfer rate of 0.0006 day⫺1 is used in the model, and the ratio of mobile over total porosities is allowed to vary. It is clear that the calculated relative mass is not particularly sensitive to changes in the ratio of mobile over total porosities within the range examined (1/4 –1/8). The same analysis was conducted on results from simulations using the fBm-
Figure 12. Bar graph showing the sensitivity of calculated relative mass to changes in mass transfer rates for the dualdomain mass transfer model. Mobile porosity equal to 1/8 of total porosity is used.
Figure 13. Bar graph showing the sensitivity of calculated relative mass to changes in mobile porosity ratios for the dualdomain mass transfer model. Mass transfer rate of 0.0006 day⫺1 is used.
generated hydraulic conductivity field; the conclusion was identical; hence the figure is not included.
8.
Summary and Conclusions
This paper presents research conducted on modeling solute transport observed during a large-scale natural-gradient tracer test at the heterogeneous aquifer at the MADE site. The results from Fickian advection-dispersion models are compared with results from dual-domain mass transfer models. For each of the models, two methods of hydraulic conductivity interpolation, ordinary kriging and conditional geostatistical simulation based on fractional Brownian motion (fBm), were used to construct the hydraulic conductivity distributions needed in the numerical models so that the influence of hydraulic conductivity interpolation on both single-domain and dual-domain transport modeling could be investigated. Distributions of relative mass along the general flow direction were determined and compared to evaluate the effectiveness of the dual-domain mass transfer model as opposed to the singledomain advection-dispersion approach for modeling rapid, anomalous spreading at low concentrations as observed in the field. The single-domain model did not simulate diffusive spreading at low concentrations, as is seen in the observed plume. As a result of probable preferential flow pathways created by extreme heterogeneities in the hydraulic conductivity field, solutes may move faster and farther than predicted by the advection-dispersion equation. With the dual-domain model the overall plume structure is modeled well. There is sufficient spreading downstream at low concentrations, and the narrowing of the plume front simulated by the advection-dispersion model has disappeared. A comparison of observed and calculated mass distributions shows that the dual-domain model captures the general trend of observed mass spreading much better than does the single-domain model. Transport models based on the classical Fickian advectiondispersion equation are widely used to simulate contaminant transport in groundwater, even though the model has been shown to be inadequate in simulating field-scale solute trans-
2514
FEEHLEY ET AL.: DUAL-DOMAIN MASS TRANSFER APPROACH
port in highly heterogeneous porous media. This inadequacy is produced by the inability of the classical theory to explicitly account for local-scale, highly correlated, physical heterogeneity and the resulting solute transport along preferential flow pathways that may persist at scales much smaller than those that can be practically represented in flow and transport models. As such, models based on the Fickian advection-dispersion approach, while useful for approximating solute transport in relatively homogeneous aquifers with randomly occurring macroscopic heterogeneities, have severe limitations when applied to highly heterogeneous aquifers with potentials for preferential pathways. Uncertainty due to the assumption of Fickian macrodispersive mixing embedded in the classical advectiondispersion equation tends to increase as the plume scale decreases or as the scale of velocity field correlations increases [Beven et al., 1993; Carrera, 1993; Fitts, 1996]. The hydraulic conductivity interpolation algorithm of ordinary kriging generates a unique hydraulic conductivity field, preserves local accuracy near data points but smoothens data in areas of sparse sampling, and provides no measure of uncertainty. Stochastic geostatistical simulation generates alternative, equally probable realizations, retains heterogeneities and large spatial variability, and provides variance as a measure of uncertainty [Deutsch and Journel, 1998]. For this study, more of the observed plume characteristics are preserved when the hydraulic conductivity field is generated using fBm as a conditional geostatistical simulator. However, even though fractal-based hydraulic conductivity distributions are capable of retaining much more small-scale heterogeneity than those based on kriging, it is evident from this study that at the meter-scale grid spacing considered here, preferential flow pathways, which probably account for the rapid, anomalous spreading of tritium tracer as observed at the MADE site, cannot be adequately represented by the classical advectiondispersion model. The fractal-based method offers a natural procedure for performing conditional simulations in which data at any scale can be converted to values at any other scale. Thus it is possible that with a sufficiently fine mesh a fractal-based hydraulic conductivity field may be able to retain adequate heterogeneities such that preferential flow pathways can be simulated with a highly advection-dominated form of the advection-dispersion model. With a sufficiently fine mesh, small-scale heterogeneities would be explicitly represented in the model; hence preferential pathways for solute transport would emerge naturally. Until models at such a fine scale can be constructed, however, the dual-domain mass transfer approach provides a practical solution for modeling solute transport in highly heterogeneous porous media. We are now considering whether the natural properties of fractal hydraulic conductivity fields could be related to the key parameters of the dual-domain mass transfer model. Acknowledgments. The funding for this study was provided, in part, by a grant from the NSF. The transport code used in the dualdomain modeling was developed with support from the U.S. Army Engineer Research and Development Center. We are grateful to Silong Lu of Clemson University for generating the fBm fractal fields and to Patrick Wang of the University of Alabama for assistance with the transport code development. We also wish to thank Tom Stauffer and Mark Boggs for providing the field data and other valuable assistance. Finally, we appreciate the effort of the associate editor and three reviewers, whose comments have led to significant improvement in the organization and clarity of this paper.
References Adams, E. E., and L. W. Gelhar, Field study of dispersion in a heterogeneous aquifer, 2, Spatial moments analysis, Water Resour. Res., 28(12), 3293–3307, 1992. Barenblatt, G. E., I. P. Zheltov, and I. N. Kochina, Basic concept of the theory of seepage of homogeneous liquids in fissured rocks, J. Appl. Math. Mech., Eng. Transl., 24, 1286 –1303, 1960. Bear, J., On the tensor form of dispersion in porous media, J. Geophys. Res., 66(4), 1185–1197, 1961. Benson, D. A., R. Schumer, M. M. Meerschaert, and S. W. Wheatcraft, Fractional dispersion, Levy motion and the MADE tracer tests, Transp. Porous Media, in press, 2000. Beven, K. J., D. Henderson, and A. Reeves, Dispersion parameters for undisturbed partially saturated soil, J. Hydrol., 143, 19 – 43, 1993. Boggs, J. M., and E. E. Adams, Field study of dispersion in a heterogeneous aquifer, 4, Investigation of adsorption and sampling bias, Water Resour. Res., 28(12), 3325–3336, 1992. Boggs, J. M., S. C. Young, D. J. Benton, and Y. C. Chung, Hydrogeologic characterization of the MADE site, Interim Rep. EN-6915, Electr. Power Res. Inst., Palo Alto, Calif., 1990. Boggs, J. M., S. C. Young, and L. M. Beard, Field study of dispersion in a heterogeneous aquifer, 1, Overview and site description, Water Resour. Res., 28(12), 3281–3291, 1992. Boggs, J. M., L. M. Beard, S. E. Long, M. P. McGee, W. G. MacIntyre, C. P. Antworth, and T. B. Stauffer, Database for the Second Macrodispersion Experiment (MADE-2), Tech. Rep. TR-102072, Electr. Power Res. Inst., Palo Alto, Calif., 1993. Boufadel, M. C., S. Lu, F. J. Molz, and D. Lavallee, Multifractal scaling of the intrinsic permeability, Water Resour. Res., in press, 2000. Brusseau, M. L., and J. Zachara, Transport of CO2⫹ in a physically and chemically heterogeneous porous medium, Environ. Sci. Technol., 27(9), 1937–1939, 1993. Brusseau, M. L., Z. Gerstl, D. Augustijn, and P. S. C. Rao, Simulating solute transport in an aggregated soil with the dual-porosity model: Measured and optimized parameter values, J. Hydrol., 163, 187–193, 1994. Carrera, J., An overview of uncertainties in modeling groundwater solute transport, J. Contam. Hydrol., 13, 23– 48, 1993. Clothier, B. E., M. B. Kirkham, and J. E. Mclean, In situ measurements of the effective transport volume for solute moving through soil, Soil Sci. Soc. Am. J., 56, 733–736, 1992. Coats, K. H., and B. D. Smith, Dead-end pore volume and dispersion in porous media, Soc. Pet. Eng. J., March, 73– 84, 1964. Deans, H. A., A mathematical model for dispersion in the direction of flow in porous media, Trans. Soc. Pet. Eng., March, 49 –52, 1963. Deutsch, C. V., and A. G. Journel, GSLIB, Geostatistical Software Library and User’s Guide, 2nd ed., Oxford Univ. Press, New York, 1998. Di Federico, V., and S. P. Neuman, Scaling of random fields by means of truncated power variograms and associated spectra, Water Resour. Res., 33(5), 1075–1085, 1997. Eggleston, J., and S. Rojstaczer, Identification of large-scale hydraulic conductivity trends and the influence of trends on contaminant transport, Water Resour. Res., 34(9), 2155–2168, 1998. Feehley, C. E., A dual-domain mass transfer approach for modeling solute transport in heterogeneous aquifers: An application to the MADE site, M.S. thesis, Univ. of Ala., Tuscaloosa, 1999. Fitts, C., Uncertainty in deterministic groundwater transport models due to the assumption of macrodispersive mixing: Evidence from the Cape Cod (Massachusetts, U.S.A.) and Borden (Ontario, Canada) tracer tests, J. Contam. Hydrol., 23, 69 – 84, 1996. Flury, M., J. William, and F. Hannes, Experimental evidence of preferential flow of water and solutes in soils, Geol. Soc. Am., Abstr. Programs, 28(7), 418, 1996. Garabedian, S. P., Large-scale dispersive transport in aquifers: Field experiments and reactive transport theory, Ph.D. thesis, Mass. Inst. of Technol., Cambridge, 1987. Gardner, W. R., and R. H. Brooks, A descriptive theory of leaching, Soil Sci., 83, 295–304, 1957. Gelhar, L. W., C. Welty, and K. Rehfeldt, A critical review of data on field-scale dispersion in aquifers, Water Resour. Res., 28(7), 1955– 1974, 1992. Gerke, H. H., and M. T. van Geuchten, A dual-porosity model for simulating the preferential movement of water and solutes in structured porous media, Water Resour. Res., 29(2), 305–320, 1993. Griffioen, J. W., D. A. Barry, and J. Y. Parlange, Interpretation of
FEEHLEY ET AL.: DUAL-DOMAIN MASS TRANSFER APPROACH two-region model parameters, Water Resour. Res., 34(3), 373–384, 1998. Grisak, G. E., and J. F. Pickens, Solute transport through fractured media, 1, The effect of matrix diffusion, Water Resour. Res., 16(4), 719 –730, 1980. Haggerty, R., and S. M. Gorelick, Multiple-rate mass transfer for modeling diffusion and surface reactions in media with pore-scale heterogeneity, Water Resour. Res., 31(10), 2383–2400, 1995. Haggerty, R., and S. M. Gorelick, Modeling mass transfer processes in soil columns with pore-scale heterogeneity, Soil Sci. Soc. Am. J., 62, 62–74, 1998. Hamm, S.-Y., and P. Bidaux, Dual-porosity fractal models for transient flow analysis in fissured rocks, Water Resour. Res., 32(9), 2733–2745, 1996. Harvey, C. F., Solute transport in spatially heterogeneous aquifers: Mapping large-scale structures and modeling small-scale effects, Ph.D. dissertation, Stanford Univ., Stanford, Calif., 1996. Harvey, C. F., and S. M. Gorelick, Rate-limited mass transfer or macrodispersion: Which dominates plume evolution at the Macrodispersion Experiment (MADE) site? Water Resour. Res., 36(3), 637– 650, 2000. Haselow, J. S., and R. A. Greenkorn, An experimental investigation of the effect of idealized heterogeneity on the dispersion of miscible fluids, Water Resour. Res., 27(9), 2473–2482, 1991. Herr, M., G. Schafer, and K. Spitz, Experimental studies of mass transport in porous media with local heterogeneities, J. Contam. Hydrol., 4, 127–137, 1989. Hewett, T. A., and R. A. Behrens, Conditional simulation of reservoir heterogeneity with fractals, SPE 18326, Soc. of Pet. Eng., Tulsa, Okla., 1988. Hollenbeck, K. J., C. F. Harvey, R. Haggerty, and C. J. Werth, A method for estimating distribution of mass transfer rate coefficients with application to purging batch experiments, J. Contam. Hydrol., 37, 367–388, 1999. Hu, Q., and M. L. Brusseau, Transport of rate-limited sorbing solutes in an aggregated porous medium: A multiprocess non-ideality approach, J. Contam. Hydrol., 24, 53–73, 1996. Huyakorn, P. S., B. H. Lester, and J. W. Mercer, An efficient finite element technique for modeling transport in fractured media, 1, Single-species transport, Water Resour. Res., 19(3), 841– 854, 1983. Jang, Y.-S., N. Sitar, and A. D. Kiureghian, Reliability analysis of contaminant transport in saturated porous media, Water Resour. Res., 30(8), 2435–2448, 1994. Jaynes, D. B., S. D. Logson, and R. Horton, A field method for measuring mobile/immobile water content and solute transport rate coefficient, Soil Sci. Soc. Am. J., 59, 352–365, 1995. Kemblowski, M. W., and C.-M. Chang, Infiltration in soils with fractal permeability distribution, Ground Water, 31(2), 187–192, 1993. Killey, R. W. D., and G. L. Moltyaner, Twin Lake tracer tests: Methods and permeabilities, Water Resour. Res., 24(10), 1585–1613, 1988. LeBlanc, D. R., S. P. Garabedian, K. M. Hess, L. W. Gelhar, R. D. Quadri, K. G. Stollenwerk, and W. W. Wood, Large-scale natural gradient tracer test in sand and gravel, Cape Cod, Massachusetts, 1, Experimental design and observed tracer movement, Water Resour. Res., 27(5), 895–910, 1991. Liu, H. H., and F. J. Molz, Comment on “Scaling of random fields by means of truncated power variograms and associated spectra,” Water Resour. Res., 34(11), 3207–3208, 1998. MacKay, D. M., D. L. Freyberg, P. V. Roberts, and J. A. Cherry, A natural gradient experiment on solute transport in a sand aquifer, 1, Approach and overview of plume movement, Water Resour. Res., 22(13), 2017–2029, 1986. McDonald, M. G., and A. W. Harbaugh, A modular three-dimensional finite-difference ground-water flow model, U.S. Geol. Surv. Tech. Water Resour. Invest., Book 6, Chap. A1, 586 pp., 1988. Molz, F. J., and G. K. Boman, A fractal-based stochastic interpolation
2515
scheme in subsurface hydrology, Water Resour. Res., 29(11), 3769 – 3774, 1993. Molz, F. J., H. H. Liu, and J. Szulga, Fractional Brownian motion and fractional Gaussian noise in subsurface hydrology: A review, presentation of fundamental properties, and extensions, Water Resour. Res., 33(10), 2273–2286, 1997. Neuman, S. P., Universal scaling of hydraulic conductivities and dispersivities in geologic media, Water Resour. Res., 26(8), 1749 –1758, 1990. Nkedi-Kizza, P., J. W. Biggar, H. M. Selim, M. T. van Genuchten, P. J. Wierenga, J. M. Davison, and D. R. Nielsen, Modeling tritium and chloride 36 transport through an aggregated oxisol, Water Resour. Res., 19(3), 691–700, 1983. Rao, P. S. C., J. M. Davidson, R. E. Jessup, and H. M. Selim, Evaluation of conceptual models for describing non-equilibrium adsorption-desorption of pesticides during steady-flow in soils, Soil Sci. Soc. Am. J., 43, 22–28, 1979. Rao, P. S. C., D. E. Rolston, R. E. Jessup, and J. M. Davidson, Solute transport in aggregated porous media: Theoretical and experimental evaluation, Soil Sci. Soc. Am. J., 44, 1139 –1146, 1980. Rehfeldt, K. R., J. M. Boggs, and L. W. Gelhar, Field study of dispersion in a heterogeneous aquifer, 3, Geostatistical analysis of hydraulic conductivity, Water Resour. Res., 28(12), 3309 –3324, 1992. Selim, H. M., J. M. Davidson, and P. S. C. Rao, Transport of reactive solutes through multilayered soils, Soil Sci. Soc. Am. J., 41, 3–10, 1977. Skopp, J., and A. W. Warrick, A two-phase model for the miscible displacement of reactive solutes in soils, Soil Sci. Soc. Am. J., 38, 525–550, 1974. Sudicky, E. A., A natural gradient experiment of solute transport in a sand aquifer: Spatial variability of hydraulic conductivity and its role in the dispersion process, Water Resour. Res., 22(13), 2069 –2082, 1986. Taylor, G., Dispersion of soluble matter in solvent flowing slowly through a tube, Proc. R. Soc. London, Ser., A, 219, 186 –203, 1953. van Genutchen, M. T., and P. J. Wierenga, Mass transport studies in sorbing porous media, 2, Experimental evaluation with tritium (3H2O), Soil Sci. Soc. Am. J., 41, 272–278, 1977. van Genuchten, M. T., J. M. Davidson, and P. J. Wierenga, An evaluation of kinetic and equilibrium equations for the prediction of pesticide movement through porous media, Soil Sci. Soc. Am. Proc., 38, 29 –35, 1974. Zhang, Z., and M. L. Brusseau, Nonideal transport of reactive solutes in heterogeneous porous media, 5, Simulating regional-scale behavior of a trichloroethene plume during pump-and-treat remediation, Water Resour. Res., 35(10), 2921–2935, 1999. Zheng, C., and J. J. Jiao, Numerical simulation of tracer tests in a heterogeneous aquifer, J. Environ. Eng., 124(6), 510 –516, 1998. Zheng, C., and P. P. Wang, MT3DMS: A modular three-dimensional multispecies model for simulation of advection, dispersion and chemical reactions of contaminants in groundwater systems: Documentation and user’s guide Contract Rep. SERDP-99-1, U.S. Army Eng. Res. and Dev. Cent., Vicksburg, Miss., 1999. Zimmerman, R. W., G. Chen, T. Hadgu, and G. S. Bodvarsson, A numerical dual-porosity model with semianalytical treatment of fracture/matrix flow, Water Resour. Res., 29(7), 2127–2137, 1993. C. E. Feehley and C. Zheng, Department of Geological Sciences, University of Alabama, 202 Bevill Building, Tuscaloosa, AL 354870338. (
[email protected];
[email protected]) F. J. Molz, Department of Environmental Engineering and Science, Clemson University, Clemson, SC 29625. (
[email protected]) (Received February 22, 2000; revised April 18, 2000; accepted May 10, 2000.)
2516