tion of new timetables, new equipment, and infrastructural changes, rail .... In transport research, the time-of-day and the day-of-week are often of central interest. ..... Numerical Methods with Programs in C. New York: McGraw-Hill, Inc.
Proceedings of the 2009 Winter Simulation Conference M. D. Rossetti, R. R. Hill, B. Johansson, A. Dunkin and R. G. Ingalls, eds.
A DYNAMIC DATA-DRIVEN APPROACH FOR RAIL TRANSPORT SYSTEM SIMULATION Yilin Huang Alexander Verbraeck Section Systems Engineering Faculty of Technology Policy and Management Delft University of Technology The Netherlands ABSTRACT Public rail transport systems concern infrastructure and control strategies with long life spans. While many rail system simulations aim at planning and design, this paper proposes a dynamic data-driven approach to improve the adaptability of the model, hence promoting an extended use of the simulation model. In the proposed approach, the simulation study uses real data streams for automatic model calibration at run-time. For situations that cannot be automated, expert interference can be supported by interactive processes. Different model calibration schemes can be applied to several replications simultaneously to assess the schemes and to determine the parameter values that best match the most recent situation. The model can be fed with data derived from different scenarios, from decision variations or from real-time measurements to accomplish accurate and automated model calibration. This provides a foundation for the use of simulation for railway controller training tools and real-time rail monitoring systems. 1
INTRODUCTION
Simulation has been widely used by rail transport service providers seeking for supports to improve or possibly optimize their quality of service, as well as the efficiency of their management strategies at various levels. Because of the inherent long life span of rail infrastructure and services, and many issues and questions that usually come up for improving operations, creation of new timetables, new equipment, and infrastructural changes, rail simulation models should not be utilized only on a single-configuration basis. Often simulation analysts have to change the model and/or the model parameters by hand each time when there is a change in simulation scenarios. As this is quite a labor-intensive activity, this paper looks for an alternative, a more convenient and agile way for model calibration that provides a possibility for an extended use of the simulation model. Data plays an important role in simulation. Relevant and correct data is needed to formalize the model and its environment, including parameter fitting, calibration and validating of the model, so we can have meaningful and credible simulation results (Ören 2001). Aware of the impact of data on simulation, a question that arises is how can we efficiently use the available data to prepare the simulation studies. In this paper, we propose a dynamic data-driven approach to adapt models for rail system simulation. The goal is to improve situation awareness of the simulation under high levels of uncertainty in rail operations and to automatically adapt the simulation (model) to frequent system changes using the extensive available set of data. Where appropriate adaptations are unable to be determined, expert interference has to be supported by interactive processes, which would make the system fall back to the traditional way of readying the data for a simulation study. In section 2 of this paper, some background theories are presented. Important sources are DDDAS, Dynamic Data Driven Application Systems, and notions about extended use of simulation. Related research is reviewed in section 3. Section 4 describes a classification scheme of data to differentiate data that requires diverse data analysis methods. It is followed by a description of the proposed data-driven approach. Several data analysis methods are discussed in section 6, and an empirical example is given with real data provided by HTM, a public transport light rail company in The Hague, the Netherlands.
978-1-4244-5771-7/09/$26.00 ©2009 IEEE
2553
Huang and Verbraeck 2 2.1
BACKGROUND DDDAS
Dynamic data-driven simulation of rail transport system is conceived with the “Dynamic Data Driven Application System” approach or DDDAS, a new paradigm for application of simulation and measurements, as well as the creation and enabling of a new generation of dynamic adaptive applications. The term has been coined by the US National Science Foundation or NSF (DDDAS 2000). The ensuing established DDDAS research community has fostered projects in many research and technology areas, such as transportation and logistics, manufacturing processes, and biogeochemistry, to name a few. The concept is that simulation applications dynamically incorporate new data (archival, real-time generated data, or data from on-line measurements of the actual systems), to selectively enhance or refine the original models that are driven at execution-time by dynamic inputs, to offer more accurate analysis and predictions, and to provide more precise controls. However, today’s methods and techniques, developed assuming static data inputs, would need to be advanced to ensure their stability and convergence under dynamic inputs (Darema 2004, DDDAS 2006). Sensors and detectors can produce large quantities of data that model key quantities of interest, which can be used to estimate parameters for simulation studies. As data are processed, simulation models are adjusted in DDDAS to best agree with known measurements (Douglas 2008). Michopoulos and Lambrakos (2006) explore three issues concerning DDDAS related modeling and simulation: (1) Data-driven simulations do not need conventional validation. (2) For some cases one has to consider that the measured data coupling the experimental frame and the real system can lead to an unrealistic simulation, if the data introduces (potential) uncertainties and deviations. (3) There is a need for better data space and model parameterization procedures because of the pluralism of parametric representation and of potential mappings from the data space into the model space. Concerning point (1) above, it is of course still necessary to validate the models after “tuning” them with the observed data, but alternative methods might be needed compared to the current ways of validation. Douglas et al. (2006, 2007) discuss several DDDAS enabling technologies including multiscale interpolation and parameter updating using an objective function. They conclude that frequent updating of the sensor data in the simulations can significantly improve the prediction results. It has to be researched for applications that require consistent initial conditions and boundary conditions how to advance the solution in time, because measurements can easily be violating the conditions in the simulation model. 2.2
Extended Use of Simulation
Apart from the functionality improvement, the data-driven simulation approach can result in an extended use of the simulation model in additional phases of rail system development and management. Where traditionally simulations are used mainly to answer what-if questions, those tools can evolve via system development tools towards real-time control systems in the engineering process; nevertheless it is necessary to overcome a number of technical hurdles to turn the idea into applicable reality (Saanen, Verbraeck, and Rijsenbrij 2000). The key requirement is to have clear interface definitions with the external modules and equipment, namely that the control interfaces of both the simulated and the real equipment should be identical, by which the control signals and operational data can be transmitted in an uniform manner. Versteegt and Verbraeck (2002) demonstrated that a simulated control system can be used for real-time control of physical logistic resources; the research also addressed several important issues that need to be solved, such as scalability, disturbance detection and resolving of problems. In this context, the data-driven simulation approach can offer powerful functionalities such as detecting situation changes by data streaming and performing adequate adaptations in the simulation model(s) according to the changes. 3
RELATED WORK
In the framework of our research project, Kanacilo and Verbraeck (2006) developed a library of railway simulation components that support rail designers to analyze the dynamic aspects of rail system for the purpose of assessing control strategies and time schedules. Simulations can be carried out with the library in a distributed microscopic multi-formalism manner. Statistical plotting, generation of output files, and animation aid the users to evaluate the simulation results. A case study by Kanacilo and van Oort (2008) showed the benefits of the tool in improving the reliability of rail network design. For dynamic data-driven simulation of rail transport system, the library provides a solid foundation on which various data processing and analysis methods, and parameter estimating algorithms can be added as reusable components. In recent years, with the increasing availability of road traffic sensors/detectors and the advancement of simulation technologies, a number of researchers have looked for efficient use of the available measurement data in simulation to better cope
2554
Huang and Verbraeck with the intrinsic dynamic nature of transport systems. Some emerging simulation-based tools that integrate data processing, analysis and parameter estimating capabilities are presented here. Smith et al. (2002) propose an automated signal timing plan procedure using archived traffic data. They applied cluster analysis (hierarchical cluster method) to automatically identify time intervals in which traffic patterns are relatively constant and to auto-determine the representative traffic volumes for each interval. HUTSIG (Kosonen 2003), a traffic signal control system, is based on on-line simulation connected to real-time detector data. In the system, each signal is implemented as an agent that negotiates with other agents about the signal control strategy. The algorithm chosen to provide the agents with decision-making capability is a fuzzy inference engine, which resembles human (expert) reasoning processes. Barceló et al. (2007) developed an on-line simulation-based traffic management support tool. Some problematic traffic data patterns and their countermeasure strategies are stored in a historical database. After filtering and processing, real-time traffic data is compared with the historical data. If a problem is identified that is similar to the data in the database, i.e. if there is a pattern match, several strategies will be proposed to the traffic controller, and simulation will help to choose the most adequate option. Wang, Papageorgiou, and Messmer (2006) present a real-time freeway network surveillance tool based on a macroscopic traffic flow model and extended Kalman filtering. This on-line tool estimates traffic flow variables and model parameters, and predicts flow variables over a short-term time horizon. The methods applied include extrapolation of historical data, dynamic traffic flow modeling, spatial interpolation of detector measurements, and more. The adaptive features of the traffic state estimator are further investigated in Wang et al. (2009). This work evaluated the performance of on-line model calibration, auto-adaptation to external conditions, and enabling of incident alarms. Regiolab Delft (Muller, Miska, and van Zuylen 2005) established in 2000 is a public-private partnership traffic laboratory in the Delft region of the Netherlands. Data collection systems, including electronic measuring systems on highways, inductive loop detectors at intersections, license plate readers, infra-red measuring systems on rural roads, provide the laboratory with live traffic data from various sources. The data are subsequently transformed into on-line traffic information. Researchers of the laboratory use the (on-line or archived) data to develop models and to design anticipatory control systems such as origin-destination-matrix estimations, travel time predictions, dynamic traffic assignments, etc. Miska, Muller, van Zuylen (2006) use aggregated Regiolab data to feed a microscopic traffic simulation model and to predict the future traffic situation evolvement with a rolling horizon of 30 minutes. In the simulation, drivers are represented by agent-based selflearning driving behavior models. Collected data is fed to a belief network coupled with a decision network to “train” the agent. As the “training result” is deterministic, the model also adopts a noise function to simulate the individual behavior of the driver. Research carried out in the field of DDDAS are reported in Darema (2004, 2006, 2007) and DDDAS (2006), which contain complete lists and references of DDDAS projects funded by NSF. Among those, the research project at Georgia Tech of Hunter et al. (2006), Fujimoto et al. (2006), and Henclewood, Hunter, and Fujimoto (2008) concerns data-driven simulations of surface transportation systems. The NSF research at Georgia Tech uses real-time aggregated data streams to estimate the evolving state of surface traffic. Data streams with various update intervals were examined to study which is the best to drive the simulation for an appropriate representation of the actual traffic situation. The experiment environment contains two VISSIM simulation instances: (1) a simulated large network represents the “real-world”, and (2) a smaller network that receives aggregated data from the large network and simulates the “real-world” in real-time. The experiment is also designed as a proof of the feasibility of the data-driven concept. Henclewood, Hunter, and Fujimoto (2008) conclude that this data-driven model is capable of reflecting the performance measurements of the “real-world” with a relatively high level of accuracy. 4
CLASSIFICATION OF DATA FOR TRAFFIC SIMULATION
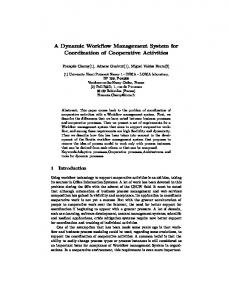
The measured data can have a lot of structural variety, which makes it difficult to treat all data with a rigid and uniform method. Diverse treatments and methods are necessary, for example, to sample the data, to study the distribution and spread of data, to prepare for testing hypotheses, to fit distributions for the simulation model, and so on (Siegmund 1998). Hence a classification of data is the first step towards tackling the data analysis issue. First of all we need to differentiate outliers from rest of the data. Outliers (Unwin 2001) may indicate quality deficiencies in a dataset caused by measurement errors, or they might indicate some special cases. They can invalidate or adversely affect the use of statistical data analysis procedures. Therefore outliers should be considered very early in an analysis. Identification of outliers can depend on the available meta-information or on the defined criteria. Outliers in datasets may be excluded as errors or be analyzed separately as special cases. Robust statistical methods may be used to down-weigh the effects of outliers if they are kept in the dataset. Figure 1 depicts a sampling example of a public tram line’s travel time. The station names are listed at the upper part of the figure. SN is the departure station and DT is the destination station. The time-schedule of the tram line is indicated by the
2555
Huang and Verbraeck dashed lines; in this case trams run every ten minutes. The diagram is a so-called x-t diagram, plotting traveled distance against time. The more “horizontal” the line, the faster the tram travels. When a tram is experiencing delays, the line becomes steeper. The solid lines indicate the actual travel time of the trams. Thus according to this figure, the tram that departed at 16:00, for example, is more punctual than the one that departed at 15:50. The outliers in this figure are indicated by the dashed ellipse where two successive trams encountered a significant delay from station PH to station BS, apparently caused by some disturbance. The travel time of these two samples do not represent the typical travel time between these two stations and have to be studied as a separate case, if it is deemed interesting enough to study further. In transport research, the time-of-day and the day-of-week are often of central interest. These are important parameters in the analysis of travel behavior and traffic assignment models (Tseng and Verhoef 2008). In time-of-day traffic modeling, a day is segmented into a number of intervals in which traffic patterns are relatively consistent (Smith et al. 2002). For example the station dwell times at peak time are generally greater than those at non-peak time. Urban public transport is scheduled more frequent at peak time due to the increased passenger demand. Hence we need to analyze these data sets separately or use e.g. a periodogram analysis (Chatfield 2003). Another data classification criterion in public transport research is based on the type and location of stopping places (Bauer and Richter 2006): whether the stops have single or multiple stopping spaces, whether they are located on the nearside or far-side of the intersection (with or without signals), or if they are located inside city centre. These factors strongly influence the station dwell time, and may be identified as categorical variables (Agresti 2003).
Figure 1: Tram line travel time from 14:40 to 16:40, x-axis: traveled distance, y-axis: clock time 5
SIMULATION APPROACH
The effort of data-drive simulation is generally using an automated procedure that continually performs model calibration using the data available during a simulation run. In the context of rail system simulation, these data are, for example, the speed
2556
Huang and Verbraeck and position of a vehicle, the timestamp when a vehicle arrives at a station, etc. Modern rail vehicles possess GPS systems and telecommunication devices that are able to periodically transmit those data to the rail control centre; however the data have limited use right now, and cannot yet be used for on-line rail simulations. Dynamically incorporating new data into a simulation offers more accurate predictions and more reliable outcomes (DDDAS 2006), but in order to use it, we have to incorporate extra functionality into the simulation model. Another potential benefit is model reuse for other purposes once the model is data-driven. Enabling the capability requires new methods in modeling, data processing, and advanced algorithms to tolerate the unstable nature of dynamic data inputs and to ensure the convergence of the result.
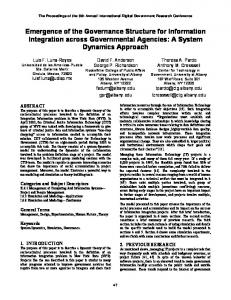
(a) (b) Figure 2: A tram line simulation example (a) and a data-driven simulation approach (b) Figure 2 shows a screenshot of a segment of a tram line simulation example (a) and a conceived data-driven approach (b). For a simpler demonstration, we observe one vehicle instance of a tram line in the example where one parameter measurement, the actual location of the vehicle, will be fed to the simulation as a data stream. At any time instant ti of the simulation, the model of the vehicle M has a state Si where
Si = { li , vi , ai | li ∈ Oi ⊆ Si ∧ vi , ai ∈ Si \ Oi } li vi ai Oi
the location of the vehicle in the simulation the velocity of the vehicle in the simulation the acceleration of the vehicle in the simulation the set of model parameters that are measurable from the real system
in which the location of the vehicle li is a measurable or observable element (from the system), i.e. li ∈ Oi ⊆ Si; the unobservable elements in Si\Oi, in this example the velocity vi and acceleration ai, are determined by the model. At simulation start t0, M is initialized with state S0 where l0 is mapped directly from the measurement 0, while the values for v0 and a0 are assigned by the model. After a certain simulation time ∆t1 = t1 – t0 ( t1>t0 ), the simulation compares the modeled location l1 of state S1 with the actual location l1’ of the measurement 1. If the discrepancy ∆l1 of l1 and l1’ does not exceed a predefined threshold, the simulation resumes without a state change. Otherwise, it updates l1 with l1’, and more importantly it estimates the actual values of v1 and a1 at t1, updates them, then resumes the simulation until the next measurement data is available. The update of Si (if feasible) is carried out iteratively along with the simulation, anticipating a convergence of li’ and li, namely the system’s measurable performance indicator(s) and the respective model state parameter(s). In short, for a model M with state Si at ti, a dynamic data-driven simulation continually updates the model parameters that are observable (in Oi) with available measurements, and estimates model parameters that are unobservable (in Si\Oi) in accordance with the system measurements. This “learning phase” continues with the hope that the modeled results will have a convergence with the measurements of the real system, hence obtaining a well-calibrated model. This model can be hereafter used to simulate faster than real-time giving in-time system predictions. The primary benefit of data-driven simulation is the adoption of observed data into the simulation to calibrate the model more precisely in line with the evolvement of the system represented by the data stream. In the surface transportation simulations reviewed in Section 3, some experiments of the data-driven concept have been conducted and reported. They demonstrate that the model is capable of reflecting the performance measurements of the “real-world” with a relatively high level of accuracy (Henclewood, Hunter, and Fujimoto. 2008). However, model calibration has not been an issue since both the measurements from the real system and its simulation are based on the “same” (model of) reality.
2557
Huang and Verbraeck Deriving model parameters from observed data requires an in-depth data analysis. As stated by Ulrich (2001), when data acquires context-dependent meaning and relevance, it becomes information; furthermore, we obviously expect information to represent valid knowledge on which users can rely for rational action. Unfortunately, it is less obvious how exactly the steps to get from data to information (and to knowledge and rational action) can be accomplished, or at least supported. Validation and calibration of a complex system is a challenging task even when the procedure is not automated. Some techniques in this regard, presented for example in Law (2007), include quantitative model-component validation, sensitivity analysis, comparison with expert opinions, statistical procedures for comparing real-world observations and simulation output data, etc. For (semi-)automated model validation and calibration, we devote our efforts to combine these classic techniques with simulation in run-time. 6
DATA ANALYSIS AND PARAMETER ESTIMATION
Simulation can be combined with different types of experiential as well as non-experiential knowledge generation techniques such as optimization, statistical inference, reasoning, and hypothesis processing, some of which lead to artificial intelligence applications (Ören 2001). The development of dynamic data-driven simulation raises issues that reach far beyond what we can discuss in a single article. In this section we focus on one essential and indispensable aspect, data analysis and the applicable numerical and cognitive methods that help us use data to calibrate model parameters. The relationship of system measurements and simulation parameters is illustrated in Figure 3.
Figure 3: Data Analysis Since it is not possible to employ the raw measurements directly for validation or for parameter calibration in almost all cases, processing and analysis of the measured data in parallel with the simulation modeling process is required. Where the available numerical and cognitive methods are insufficient, human intervention preferably with an expert opinion to improve data analysis is necessary. In certain simple cases, system variables can be mapped directly or indirectly to model parameters. Such data are good candidates to be observed as they demand minor data processing and analysis. For example, direct parameter mapping can be applied to the turning time of a train at an end station. Indirect mapping can be used e.g. when the location of a train is observable in terms of real world coordinates such as GPS coordinates (given that the coordinates are not model parameters), and can be associated with a rail track, allowing to dynamically position the train along the track. In many other cases we need more advanced data analysis methods, e.g. clustering methods, time-series analysis, hypotheses testing, Bayesian methods, maximum-likelihood methods, neural networks, fuzzy logic, to name a few (Siegmund 1998, Sivia and Skilling 2006). The main research concern is how to integrate intelligent data analysis methods into simulation, namely to choose or develop appropriate techniques that best suit the characteristics of the observed data, and of the relationship between the observed data and model parameters. When a set of discrete data points is available and an approximate functional relationship is desired, curve fitting can be used to find a mathematical form or model. Different techniques are presented e.g. in Hobson and Weinkam (1977), Koenig (1998), Hoffman (2001), Veerarajan and Ramachandran (2008). They are dedicated to define the best-fitting approximating
2558
Huang and Verbraeck curves, e.g. in the least-squares sense, or in the moments sense. When an approximating function can be determined, the values of the dependent variables at designated points can be hereafter determined or estimated. Veerarajan and Ramachandran (2008) refer to some formulas and methods for interpolation and extrapolation with equal and unequal intervals. Consider that discrete datasets of distance travelled over time are observable, we may use interpolation to determine the distance at a former time point, and use extrapolation to estimate the distance at a later time point. Automated reasoning tends to learn from how people reason. Reasoning, a cognitive method, is supported by knowledge inference and to a certain extent it is akin to mathematical theorem proving (Portoraro 2008). A fundamental view in cognitive science is that an intelligent system is not completely homogeneous; a system has a cognitive architecture when it has built-in information-processing capabilities and mechanisms (Stillings et al. 1995). Kurtz, Gentner, and Gunn (1999) differentiate two kinds of reasoning: (1) Formal reasoning that is based on propositions, rules, and schemas, which are explicit knowledge structures. (2) Similarity reasoning that is based on categorization and statistics, where prior experience is used as a basis for prediction, i.e. stored associations of feature occurrences (frequencies) and co-occurrences (correlations) of observable properties can be applied to predict unknowns as a function of the presence or absence of other features. Wickens (1998) also mentions the statistical inference in reasoning, the mnemonic effect, by which we can evaluate the chances that the conclusion will ultimately turn out to be correct. Moreover, an aging mechanism is desired as the entire collected datasets may not be as representative as recent dataset collections in terms of reflecting the evolving state of the system in some cases. Excluding or giving lower weight to the earlier data may help to obtain more accurate data analysis hence better predict future evolvement. For stochastic variables (which have no available data), the estimation can be derived from the analysis of response variances of the model. To simplify the problem, the analysis may be applied to the sub-models (if feasible) instead of the overall model, given that the sub-models and their integration are valid. Experiments with random inputs or input combinations may help to find a best match for the expected output values. Depending on the requirement of the processing time and the resource constrains, the experiments can be conducted in parallel (by independent replications), or sequentially. In the former case, the replication that generates the best match will be chosen to continue the initial simulation thread, while the others will be terminated. 7
AN EMPIRICAL EXAMPLE
Analyzing the measured data can be quite a challenge. For the tram system in The Hague, The Netherlands, a system called TriTAPT is used to capture travel data of all trams (Muller and Furth 2001 or ). The data is quite rich, and can be used to estimate parameters of simulation models that are used for instance for testing timetables at the tram company, or for assessing changes in the control system or the physical lay-out of the system (Kanacilo and van Oort 2008, Kanacilo and Verbraeck 2006). The TriTAPT data can be used to estimate halting times, driving times between two halting places, and deviations from the schedule. An example of the travel time between two stations for all trams of a certain route during one day is given in Figure 4, and the halting times for one station during the day are given in Figure 5.
Figure 4: Driving time samples in seconds for one day between two stations
2559
Huang and Verbraeck
Figure 5: Halting time samples in seconds for one day at one station along the route of a tram Figure 4 clearly shows a minimum driving time between these two stations, a deviation of around 10-15 seconds, and larger deviations that can lead to a double driving time. If patterns that explain the occurrence of longer travel times cannot be found in this data, we can take the average travel time without the 17 outliers (e.g. those more than 2 standard deviations away from the average) and the standard deviation of the remaining data points as the “normal” travel time, where a generator of disturbance can be added to the data in the model for this particular travel time with an average disturbance time and frequency of occurring during the day. The samples in figure 5 show that there is an outlier around noon. This could have been a tram with a defect, a blockage along the route, or otherwise. As this did not affect the next tram along the route very much, it can also be that this was a measurement error. Further data needs to be analyzed to see if the tram suffered a big delay after this at next stations (propagation of the delay). If so, all data points of this tram might be deleted from the dataset automatically if we want to simulate “normal” traffic. If not, only this data point might be deleted. These choices are not easy to make for a computer, and several types of heuristics will have to be researched to see which ones are effective in estimating parameters for the models. 8
CONCLUSIONS AND FUTURE RESEARCH
Preparing data for automated model calibration shows a lot of potential, but it turns out to be quite difficult. Many different algorithms exist for the analysis of data and time series, and for mapping measured data on the model state a number of steps have to be taken, such as cleaning the data for outliers by either leaving out individual data points or complete data series, separating the “normal” behavior in the system from “disturbed” behavior and instantiating generators to help the model show realistic behavior. The difference between an outlier and behavior to be modeled is very hard to make. It is already difficult for the human analyst, and even more difficult for the computer. Given the amount of data for models like those of a tram or train company, automated procedures are needed, however, to be able to populate the models with valid data. In case of the tram and train models we discussed in the paper, there are dozens of tram lines, hundreds of halting places, hundreds to a few thousand of individual distances between halting places or crossings, each with measured data for more than a hundred trams per day (daily pattern), with differences for the weekdays (weekly pattern). Analysis of a month of data can easily lead to a dataset with tens to hundreds of millions of data points to help in the estimation of the thousands of parameters in the model. Further research will therefore focus on finding and testing a number of straightforward techniques that can be used in analyzing this large set of data, and finding and testing heuristics that can help choosing between the methods. ACKNOWLEDGMENTS The authors would like to acknowledge the support of HTM, a public transport company based in The Hague, the Netherlands. Contact person: N. van Oort. His email is .
2560
Huang and Verbraeck REFERENCES Agresti, A. 2003. Categorical Data Analysis. 2nd ed. Wiley Press. Barceló, J., M. Delgado, G. Funes, D. García, and A. Torday. 2007. On-line microscopic traffic simulation to support real time traffic management strategies. In Proceedings of the 6th ITS European Congress. No. 2607. Bauer, M. and M. Richter. 2006. Statistical analysis of time lost by trams before departure from stops. In Processing of the 17th International Conference on the Applications of Computer Science and Mathematics in Architecture and Civil Engineering, eds. K. Gürlebeck and C. Könke. Chatfield, C. 2003. The analysis of time series: an introduction. 6th ed. CRC Press. Darema, F. 2004. Dynamic Data Driven Application Systems: A New Paradigm for Application Simulations and Measurements. ICCS 2004, LNCS, 3038: 662-669. Berlin: Springer-Verlag. Darema, F. 2006. Introduction to the ICCS 2006 Workshop on Dynamic Data Driven Applications Systems. ICCS 2006, Part III, LNCS, 3993:375 – 383. Berlin: Springer-Verlag. Darema, F. 2007. Introduction to the ICCS 2007 Workshop on Dynamic Data Driven Applications Systems. ICCS 2007, Part I, LNCS, 4487:955 – 962. Berlin: Springer-Verlag. DDDAS Workshop Groups. 2000. Creating a dynamic and symbiotic coupling of application/simulations with measurements/experiments. NSF DDDAS 2000 Workshop. Available via [accessed March 20, 2009]. DDDAS Workshop Groups. 2006. Dynamic Data Driven Application Systems Workshop Report, NSF DDDAS 2006 Workshop. Available via [accessed March 20, 2009]. Douglas, C. C., Y. Efendiev, R. Ewing, V. Ginting, and R. Lazarov. 2006. Dynamic Data Driven Simulations in Stochastic Environments. Computing, 77(4):321–333. Douglas, C. C., Y. Efendiev, R. Ewing, R Lazarov, M. J. Cole, G. Jones and C. R. Johnson. 2007. Interpolation and Update in Dynamic Data-Driven Application. NATO Security through Science Series C: Environmental Security, 235-246. Berlin: Springer-Verlag. Douglas, C. C. 2008. Dynamic Data Driven Applications Systems - DDDAS 2008. ICCS 2008, Part III, LNCS, 5103: 3-4. Berlin: Springer-Verlag. Fujimoto, R. M., R. Guensler, M. Hunter, H.-K. Kim, J. Lee, J. Leonard II, M. Palekar, K. Schwan, and B. Seshasayee. 2006. Dynamic data driven application simulation of surface transportation systems. ICCS 2004, Part III, LNCS 3993:425-432. Berlin: Springer-Verlag. Henclewood, D., M. P. Hunter, and R. M. Fujimoto. Proposed methodology for a data-driven simulation for estimating performance measures along signalized arterials in real-time. In Proceedings of the 2008 Winter Simulation Conference, ed. S. J. Mason, R. Hill, L. Moench, and O. Rose, 2761-2768. Piscataway, New Jersey: Institute of Electrical and Electronics Engineers, Inc. Hobson, R. F., and J. J. Weinkam. 1977. Curve fitting. Encyclopedia of Computer Science and Technology: Volume 7 Curve fitting to early development of programming languages, ed. J. Belzer, A. G. Holzman, and A. Kent. New York: Marcel Dekker, Inc. Hoffman, J. D. 2001. Numerical Methods for Engineers and Scientists, 2nd ed. New York: Marcel Dekker, Inc. Hunter, M. P., R. M. Fujimoto, W. Suh , and H.-K. Kim. 2006. An investigation of real-time dynamic data driven transportation simulation. In Proceedings of the 2006 Winter Simulation Conference, ed. L. F. Perrone, F. P. Wieland, J. Liu, B. G. Lawson, D. M. Nicol, and R. M. Fujimoto,1414-1421. Piscataway, New Jersey: Institute of Electrical and Electronics Engineers, Inc. Kanacilo, E. M. and A. Verbraeck. 2006. Simulation services to support the control design of rail infrastructures. In Proceedings of the 2006 Winter Simulation Conference, ed. L. F. Perrone, F. P. Wieland, J. Liu, B. G. Lawson, D. M. Nicol, and R. M. Fujimoto, 1372-1379. Piscataway, New Jersey: Institute of Electrical and Electronics Engineers, Inc. Kanacilo, E. M. and N. van Oort. 2008. Using a rail simulation library to assess impacts of transit network planning on operational quality. COMPRAIL 2008. Computers in Railways XI: Computer System Design and Operation in the Railway and Other Transit Systems, 103:35-43. Southampton: WIT Press. Koenig, H. 1998. Modern Computational Methods. London: Tayler & Francis. Kosonen, I. 2003. Multi-agent fuzzy signal control based on real-time simulation. Transportation Research Part C: Emerging Technologies, 11:389-402. Kurtz, K. J., D. Gentner, and V. Gunn. 1999. Reasoning. Cognitive Science, Handbook of Perception and Cognition, ed. B. M. Bly and D. E. Rumelhart. 2nd ed. London: Academic Press. Law, A. M. 2007, Simulation Modeling and Analysis. 4th ed. New York: McGraw-Hill, Inc. Michopoulos, J. G. and S. G. Lambrakos, 2006. Underlying Issues Associated With Validation and Verification of Dynamic
2561
Huang and Verbraeck Data Driven Simulation. In Proceedings of the 2006 Winter Simulation Conference, ed. L. F. Perrone, F. P. Wieland, J. Liu, B. G. Lawson, D. M. Nicol, and R. M. Fujimoto, 2093-2100. Piscataway, New Jersey: Institute of Electrical and Electronics Engineers, Inc. Miska, M. Ph., T. H. J. Muller, and H. J. van Zuylen. 2006. Calibrating Driving Behavior with Microscopic Measurement Data. In Proceedings of the 2006 IEEE Conference on Intelligent Transportation Systems,1609-1614. Muller, T. H. J. and P. G. Furth. 2001. Trip Time Analyzers: Key to Transit Service Quality. Transportation Research Record, 1760:10-19. Washington D.C.: National Research Council. Muller, T. H. J., M. Miska, and H. J. van Zuylen. 2005. Monitoring Traffic under Congestion: Base for Dynamic Assignment in Online Prediction Models. In 84th Transportation Research Board 2005 Annual Meeting. Washington D.C. Ören, T. I. 2001. Impact of Data on Simulation: From Early Practices to Federated and Agent-Directed Simulations. In Proceedings of the EUROSIM 2001, 4th International Eurosim Congress, 3-8. Portoraro, F. 2008. Automated Reasoning, The Stanford Encyclopedia of Philosophy, winter 2008 ed., ed. E. N. Zalta. Available via [accessed March 20, 2009]. Saanen, Y. A., A. Verbraeck, and J. C. Rijsenbrij. 2000, The Application of Advanced Simulations for the Engineering of Logistic Control Systems. In Proceedings of the ASIM 2000 - The new simulation in production and logistics, 215-229. Siegmund, B. 1998. Data Analysis: Statistical and Computational Methods for Scientists and Engineers. 3rd ed. New York: Springer-Verlag. Sivia, D. S. and J. Skilling. 2006. Data Analysis: A Bayesian Tutorial. 2nd ed. Oxford University Press. Smith, B. L., W. T. Scherer, T. A. Hauser and B. B. Park. 2002. Data-Driven Methodology for Signal Timing Plan Development: A Computational Approach. Computer-Aided Civil and Infrastructure Engineering, 17:387–395. Stillings, N. A., S. W. Weisler, C. H. Chase, M. H. Feinstein, J. L. Garfield, E. L. Rissland. 1995. Cognitive Science: An Introduction, 2nd ed. Cambridge: MIT Press. Tseng, Y. Y., and E. T. Verhoef. 2008. Value of time by time of day: A stated-preference study. Transportation Research Part B: Methodology, 42:607–618. Ulrich, W. 2001, A Philosophical Staircase for Information Systems Definition, Design and Development: A Discursive Approach to Reflective Practice in ISD (Part 1), The Journal of Information Technology Theory and Application (JITTA), 3(3):55-84. Unwin, A. R. 2001. Patterns of Data Analysis? Journal of the Korean Statistical Society, 30(2):219-230. Veerarajan, T. and T. Ramachandran. 2008. Numerical Methods with Programs in C. New York: McGraw-Hill, Inc. Versteegt, C. and A. Verbraeck. 2002, The Extended Use Of Simulation in Evaluating Real-Time Control Systems of AGVs and Automated Material Handling Systems. In Proceedings of the 2002 Winter Simulation Conference, ed. E. Yücesan, C.-H. Chen, J. L. Snowdon, and J. M. Charnes, 1659-1666. Piscataway, New Jersey: Institute of Electrical and Electronics Engineers, Inc. Wang, Y., M. Papageorgiou, and A. Messmer. 2006. A Real-Time Freeway Network Traffic Surveillance Tool. IEEE Transactions on Control Systems Technology, 14(1):18-32. Wang, Y., M. Papageorgiou, A. Messmer, P. Coppola, A. Tzimitsi, and A. Nuzzolo. 2009. An adaptive freeway traffic state estimator. Automatica, 45:10-24. Wickens, T. D. 1998. Drawing conclusions from data: Statistical methods for coping with uncertainty. An Invitation to Cognitive Science Vol. 4: Methods, Models, and Conceptual Issues, ed. D. L. Scarborough and S. Sternberg. 2nd ed. Cambridge: MIT Press. AUTHOR BIOGRAPHIES YILIN HUANG is a PhD candidate at the Faculty of Technology Policy and Management of Delft University of Technology. She studied Software Engineering and Distributed Systems Design at University of Applied Sciences, FH Campus Vienna, Austria, and later worked on embedded systems and real-time systems at Vienna University of Technology. Her current research focus is on-line data analysis for modeling and simulation in the field of traffic management. Her email is . ALEXANDER VERBRAECK is a full professor in Systems and Simulation in the Systems Engineering Group of the Faculty of Technology, Policy and Management of Delft University of Technology, and a part-time full professor in supply chain management at the R.H. Smith School of Business of the University of Maryland. He is a specialist in discrete event simulation for real-time control of complex transportation systems and for modeling business systems. His current research focus is on development of open and generic libraries of object oriented simulation building blocks in Java, on participative modeling, serious gaming using virtual reality, and agent technology in simulation. His email is .
2562