both the discrete relaxation times and the elastic moduli. In this technique the number of discrete modes is increased dynamically and the procedure is ...
J. Phys. D: Appl. Phys. 33 (2000) 1–11. Printed in the UK
PII: S0022-3727(00)09010-0
A dynamic nonlinear regression method for the determination of the discrete relaxation spectrum Sunrise Setting Marked Proof D/109010/PAP 19106e Printed on 27/3/00 at 10.05
S M F D Syed Mustapha† and T N Phillips Department of Mathematics, University of Wales, Aberystwyth SY23 3BZ, UK Received 27 October 1999 Abstract. The relaxation spectrum is an important tool for studying the behaviour of
viscoelastic materials. The most popular procedure is to use data from a small-amplitude oscillatory shear experiment to determine the parameters in a multi-mode Maxwell model. However, the discrete relaxation times appear nonlinearly in the mathematical model for the relaxation modulus. The indirect calculation of the relaxation times is an ill-posed problem and its numerical solution is fraught with difficulties. The ill-posedness of the linear regression approach, in which the relaxation times are specified a priori and the minimization is performed with respect to the elastic moduli, is well documented. A nonlinear regression technique is described in this paper in which the minimization is performed with respect to both the discrete relaxation times and the elastic moduli. In this technique the number of discrete modes is increased dynamically and the procedure is terminated when the calculated values of the model parameters are dominated by a measure of their expected values. The sequence of nonlinear least-squares problems, solved using the Marquardt–Levenberg procedure, is shown to be robust and efficient. Numerical calculations on model and experimental data are presented and discussed.
1. Introduction
A knowledge of the discrete relaxation and retardation spectrum of a material is important for several reasons. First, they can be used to examine the interrelation between molecular weight distribution and viscoelastic properties in the study of molecular theories of polymeric materials [4]. Secondly, they can be used to validate experiments by crosschecking results from creep and relaxation experiments, for example. Thirdly, the discrete relaxation spectrum can be used to calculate linear material functions from other standard experiments [13], and to cross-check the results with the predicted behaviour. Finally, they are necessary to perform numerical simulations of complex flows of polymeric materials. Dynamic mechanical experiments can be used to measure the relaxation modes of polymeric liquids and solids over wide ranges of frequency. Highly sophisticated instruments are commercially available for performing these measurements. However, the problem of converting the dynamic data from the frequency domain to the time domain is fraught with difficulties. The relaxation spectrum is not directly available from the experimental data. It has to be determined in an indirect manner. This particular calculation is one of the classical problems in rheology. Once the discrete relaxation spectrum has been determined the † Current address: Faculty of Computer Science and Information Technology, University of Malaya, 50603 Kuala Lumpur, Malaysia.
0022-3727/00/010001+11$30.00 © 2000 IOP Publishing Ltd
corresponding discrete retardation spectrum can be found by direct conversion (see [1, 2], for example). This information can then be fed into a constitutive equation which may, in turn, be used to simulate the flow of a material through some complex geometry either in the laboratory or in a manufacturing plant. In this paper several methods for determining the discrete relaxation spectrum of a material are described and compared on some simulated analytical data of Honerkamp and Weese [9] and on some experimental data. A new nonlinear regression technique is introduced in this paper in which the number of discrete modes is increased gradually until the calculated values of the parameters in the model are dominated by a measure of their expected values. The Marquardt–Levenberg method is used to solve the nonlinear least-squares problems. This technique is shown to be competitive with alternative methods and its dynamic nature and automatic termination criterion give it a distinct advantage. 2. Dynamic experiments
The linear relaxation modulus, G(t), is arguably the most fundamental quantity in the theory of linear viscoelasticity. It relates the stress tensor σ (t) to the rate of deformation tensor γ˙ (t) in the constitutive equation � t G(t − t ′ )γ˙ (t ′ ) dt ′ . (1) σ (t) = −∞
1
S M F D Syed Mustapha and T N Phillips
It is directly measurable by a sudden shear displacement of the material. In small-amplitude oscillatory shear flow with frequency ω and strain given by γxy (t) = γ0 eiωt
(2)
where γ0 is small enough to satisfy the linearity constraint, the shear stress is generated using (1). If we write σxy (t) = G∗ (ω)γxy (t)
(3)
where G∗ is the complex shear modulus, then � ∞ G∗ (ω) = iω G(ζ ) exp(−iωζ ) dζ.
(4)
0
We write G∗ (ω) = G′ (ω) + iG′′ (ω), where G′ and G′′ are known as the storage and loss moduli, respectively. For an N-mode Maxwell model the relaxation modulus is given by GN (t) =
N �
gi exp
i=1
�
t − λi
�
(5)
where the parameters gi , λi (1 � i � N) are the discrete elastic moduli and relaxation times, respectively, of the material. The corresponding discrete relaxation spectrum, HN (t), which is also known as the distribution of relaxation times, has the form HN (t) =
N � i=1
ηi δ(t − λi )
(6)
where ηi denotes the partial viscosity associated with the ith Maxwell mode and δ(t − λi ) is the Dirac delta function centred at t = λi . The partial viscosities are related to the elastic moduli by η i = g i λi . Inserting (5) into (4) yields the following expressions for the dynamic moduli G′ (ω) =
N �
gi
ω2 λ2i 1 + λ2i ω2
G′′ (ω) =
N �
gi
ωλi . 1 + λ2i ω2
i=1
i=1
In a dynamic experiment the dynamic moduli are calculated at a discrete set of frequencies. The discrete relaxation times are therefore not directly available. 3. Mathematical background
The problem of determining the continuous relaxation spectrum of a viscous fluid from dynamic data involves the inversion of the following pair of Fredholm integral equations � ∞ ω2 λ2 dλ ′ G (ω) = Ge + H (λ) (7) 1 + ω 2 λ2 λ 0 � ∞ ωλ dλ G′′ (ω) = H (λ) (8) 1 + ω2 λ2 λ 0 2
where H (λ) denotes the continuous spectrum as a function of the relaxation time λ. The equilibrium modulus Ge is finite for solids (Ge > 0) and zero for liquids (Ge = 0). The inversion of either (7) or (8) or both as a pair is ill-posed in the sense of Hadamard [10]. In particular, this means that small perturbations in the measurements of G′ (ω) or G′′ (ω) can lead to arbitrarily large perturbations in the spectrum H (λ). Therefore, great care is required to determine H (λ) from dynamic mechanical data. In practice the discrete relaxation spectrum is determined by fitting models such as the discrete representation of (7) and (8) G′ (ω) = Ge + G′′ (ω) =
N � j =1
N � j =1
gj
gj
ω2 λ2j 1 + ω2 λ2j
ωλj 1 + ω2 λ2j
(9)
(10)
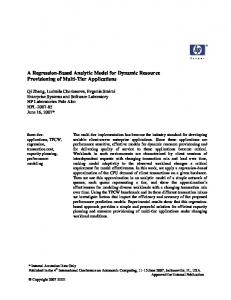
to discrete measurements of the storage and loss moduli. The fitting process is stabilized in various ways, including regularization [4, 8, 9] and restricted parametrization [1, 12, 13]. One of the main practical difficulties of working with indirect methods is assessing the extent to which information about the relaxation spectrum is not recoverable because of limitations in the measurements of the oscillatory shear data. Davies and Anderssen [3] list the following limitations in the measurements: (a) the storage and loss moduli are measured over a limited range of frequencies ωmin < ω < ωmax , say; (b) only discrete sampling at specific frequencies {ωi : 1 � i � M} is performed; and (c) observational errors occur as a natural consequence of the measurement process. The limitations imposed by (a) are considered in a recent paper [3]. Contrary to popular belief that the storage and loss moduli over the frequency range ωmin < ω < ωmax yield information about the relaxation spectrum over the reciprocal frequency range, i.e. (ωmax )−1 < λ < (ωmin )−1 , Davies and Anderssen [3] show that the relaxation spectrum is determined on a shorter interval of relaxation times defined −1 −1 < λ < e−π/2 ωmin . by eπ/2 ωmax A key question concerns the number of discrete relaxation times which can be realistically calculated from the data provided. The overfitting of excessive parameters only represents the noise in the data and not the material behaviour itself. The ill-posed problem can be described by comparing the relationship between the improvement in the least-squares error and the number of modes, N. In figure 1 we give a schematic picture of the typical behaviour of the leastsquares error as the number of modes is increased. There is no discernible improvement in the least-squares error beyond some value of N, say N˜ . In this range of values of N there may not be a unique solution to the least-squares problem. The manifestation of this is that there may be a number of parameter sets which minimize the least-squares error, not all of which are physically meaningful. We would like to construct an algorithm which terminates before the number of modes enters this zone, the beginning of which is marked
A dynamic nonlinear regression method
with ′ Ki,j = Ki,j
i = 1...M
′′ Ki+M,j = Ki,j
i = 1...M
(17) (18)
and Gi = G′i
i = 1...M
Gi+M = G′′i
least-squares error on the number of discrete modes, N .
˜ the by a circle in figure 1. Before this region, for N � N, problem appears to be well-posed and the solution reliable. Suppose that the storage and loss moduli are measured over a discrete set of frequencies {ωi : 1 � i � M}. Then one has to solve the following system of equations G′ (ωi ) = G′i = ′′
G (ωi ) =
G′′i
=
Kij′ gj
1�i�M
(11)
Kij′′ gj
1�i�M
� �2 N 2M � � 1 σ G − K g . i,j j i 2 j =1 i=1 σi
ωi2 λ2j
Kij′ =
(1 + ωi2 λ2j )
Kij′′ =
ω i λj (1 + ωi2 λ2j )
(13) (14)
and N may be unknown. This is a system of 2M equations for the 2N unknowns {gi , λi : 1 � i � N}. The nonlinear nature of this sytem makes it extremely difficult to solve. There are several avenues open to us. In the following sections we describe and discuss some of the techniques for doing this. We assume M � N . 4. Regularization techniques
In this method the discrete relaxation times are given and the least-squares error between the measurements and the expressions for G′ and G′′ is minimized with respect to the unknown elastic moduli. Given the data and the matrices K ′ and K ′′ (i.e. the relaxation times are specified) one tries to find the best set of gi for which the objective function �2 � �2 M � N M � N � � � 2 ′ ′ ′′ ′′ χ = Gi − Kij gj + Gi − Kij gj (15) j =1
i=1
j =1
is minimized. This problem can also be formulated as �2 2M � N � � 2 χ = Gi − Kij gj i=1
j =1
K = UWV T
(16)
(22)
where U is the matrix of orthonormal eigenvectors of KK T corresponding to the N largest eigenvalues, V is the matrix of orthonormal eigenvectors of K T K, and W is the diagonal matrix containing the non-zero singular values, wi , i = 1, . . . , N, of K. Then the solution of the above minimization problem can be written as g=
N �
vk wk−1 (uTk · Gσ )
(23)
k=1
where g and Gσ are the vectors of unknowns and measurements, respectively. The standard error for g is given by σ 2 (g ) = σ02
4.1. Linear regression method
(21)
An elegant solution of this minimization problem can be derived by performing a singular value decomposition (SVD) of the matrix K (see [9], for example). Let
(12)
j =1
where
i=1
χ2 =
j =1
N �
(20)
In practice, of course, the measurements Gi (1 � i � 2M) are subject to errors. Suppose that the measurement Gi is subject to the standard error σi . Then we denote the measured value by Gσi . The linear regression method seeks to minimize the objective function
Figure 1. Schematic diagram showing the dependence of the
N �
i = 1 . . . M.
(19)
N �
wk−2 (vk )2 .
(24)
k=1
Note that if some singular value becomes too small the errors become large. Furthermore, because the expression for g contains reciprocals of the singular values small variations in Gσ may cause large changes in g . Therefore, the calculated values of g may be quite different from the true values. It only takes one small singular value or a small condition number of the matrix K, i.e. the ratio of the smallest to largest singular values, for the problem to be ill-posed. This means that the minimum of the objective function may be very flat yielding many solutions that are compatible with the given data. Some of these solutions may be physically meaningless giving, for example, negative values for some of the elastic moduli. Therefore, there are serious shortcomings in the use of the linear regression method to determine the relaxation spectrum. 3
S M F D Syed Mustapha and T N Phillips
4.2. Regularization method The source of the difficulty in the method of linear regression lies with the appearance of small denominators in (23). Honerkamp and Weese [9] introduced a regularized version of (23), viz gµ =
N �
wk (vk )(uk · Gσ ) +µ
2 k=1 wk
(25)
which converges to g if the regularization parameter µ converges to zero. The form of g µ ensures that no small denominators are present for µ = 0. Note that g µ is going to differ from g for µ = 0 and cannot minimize the same objective function. For wk2 ≫ µ we have 1 wk ≈ wk +µ
(26)
wk wk ≈ . µ +µ
(27)
wk2 and for wk2 ≪ µ we have wk2
It can be shown that g µ is the solution of the following minimization problem: min χµ2 , where χµ2 = χ 2 + µ
N �
gk2 .
(28)
k=1
χµ2
leads to a well defined The search for a minimum of solution in which the difficulties encountered previously have been overcome provided µ has an appropriate value. The extra term in (28) is the square of the norm of g . So the minimization procedure takes into account not only the meansquare deviation of Gσ from K g but also the norm of g . The parameter µ weights these two terms. There are several strategies in the theory of Tikhonov– Phillips regularization to determine µ. Honerkamp and Weese [9] examine several ways of doing this. These include the discrepancy principle, a method based on the minimization of the predictive mean-square signal error and the self-consistence method which is a modified form of the discrepancy principle. This latter method is shown to be more robust and reliable than the others, as far as the determination of the discrete relaxation spectrum is concerned, in the sense that the estimated regularization parameter is nearly constant and unsuccessful determinations of the spectrum do not appear. 5. Nonlinear regression techniques
One of the drawbacks of linear regression methods, apart from the obvious ill-posedness, is that the relaxation times are specified a priori. If some of these are placed too close together then the neighbouring columns of K will become almost linearly dependent. This leads to small singular values. Note that if two columns of a matrix are linearly dependent then this will produce a zero singular value. In nonlinear regression methods the relaxation times themselves are allowed to be fully adjustable as well. The objective 4
function is now nonlinear with respect to the relaxation times and therefore nonlinear regression techniques need to be used to determine the solution. Additionally, the number of modes, N, can be chosen to be a freely adjustable parameter. The choice of N is crucial for the success of methods of this type. With too few relaxation modes the least-squares error is large. However, it decays rapidly when a few more relaxation modes are added. Winter and Baumgaertel [12] minimize the χ 2 function defined by (15) with an initial number of modes between one and two per decade. They found that it was advantageous to start with a large number of relaxation modes and to allow their numerical procedure to merge or eliminate unnecessary ones. Beyond some critical value of N, say Nc , the least-squares error will not improve significantly and negative values of the elastic moduli may begin to appear. Initially, Winter et al [13] select N to be some large number which is decreased gradually until all the elastic moduli are positive. An alternative way of keeping the problem well-posed is the one we adopt in this paper. We start with a single mode and increase the number of modes smoothly, ensuring the problem is well-posed throughout the process. The nonlinear least-squares problem at each stage is solved using the Marquardt–Levenberg method. The discrete relaxation times and elastic moduli are determined by minimizing the following objective function [1]: 2
χ =
M �� ′ � G (ωj ) j =1
Goj
′
�2 � �2 � ′′ G (ωj ) −1 + −1 . ′′ Goj
(29)
where G′ (ωj ) and G′ (ωj ) are defined by (9) and (10), ′ ′′ respectively. The values Goj and Goj are the measured data. A nonlinear least-squares technique is used to determine the unknown parameters in this model. Several methods are available to perform this task. We have selected the Marquardt–Levenberg algorithm for this purpose. This will be described in the next section. The discrete relaxation times and elastic moduli are determined in the following order gi < gi+1 λi > λi+1
(i = 1, . . . , N − 1) (i = 1, . . . , N − 1).
Once the discrete relaxation spectrum of a material is known it can be used to simulate data from other transient experiments. The results in [13] illustrate the success of this strategy. It should be noted, however, that the discrete relaxation spectrum is only valid for the time or frequency window corresponding to the input data [14]. 6. The Marquardt–Levenberg method
Gradient methods are known to perform well for parameter estimation problems which involve the minimization of the least-squares error of some residual. Consider the minimization problem min F (x)
x ∈ RK
(30)
A dynamic nonlinear regression method
where
M 1� [fi (x)]2 F (x ) = 2 i=1
(31)
is the objective function. We assume M � K. Typically each iteration of a gradient method requires: (1) the evaluation of the gradient g ≡ ∇F of the objective function, (2) the determination of the new search direction, Gg , where G is a given matrix. The choice of the matrix G characterizes a particular gradient method from the family of available methods. Difficulties with convergence of gradient methods are usually associated with indefiniteness or nearsingularity of the matrix G. We define the gradient, g , of the objective function F by gj =
M � ∂F ∂fi (x) = fi (x). ∂xj ∂x j i=1
(32)
We also define the Hessian matrix, H , associated with F by Hj,k
� M � � ∂fi ∂fi ∂ 2 fi = . + fi (x) ∂xj ∂xk ∂xj ∂xk i=1
(33)
This means that the line starts out horizontally and the process appears to converge to a point which is not a stationary value. An alternative then is to choose p(k) = −(J T J + µ(k) I )−1 g (k)
with µ(k) > 0. The search direction now lies between the Gauss–Newton direction and the downhill gradient. One can always find a value of µ(k) such that J T J + µ(k) I is positive definite. This is the basis of the Marquardt– Levenberg method. It exploits the advantages of both the Gauss–Newton method and the maximum gradient method. For small values of µ(k) the method behaves like the Gauss– Newton method. However, when µ(k) is large the diagonal of the matrix J T J + µ(k) I is dominant and the method becomes a maximum gradient method. 6.1. The fitting of a model to data Suppose that we have some experimental measurements yi (1 � i � M) at the data points xi (1 � i � M). Suppose we wish to fit some model Y (x, b) to this data where b contains the unknown model parameters. This may be done by minimizing the objective function χ 2 (b) defined by � M � yi − Y (xi , b) 2 1� χ (b) = 2 i=1 σi 2
It is conventional to write Ji,j =
∂fi . ∂xj
(34)
Then we may write g = JT f
(35)
where the vector f is defined by fi ≡ fi (x). Newton’s method for solving (30) takes the form x(k+1) = x(k) + p(k) (k)
p
(k)
−1 (k)
= −[H (x )] g
(36)
where p(k) is known as the search direction and g (k) ≡ g (xk ). Convergence is quadratic near the minimum unless H (x(k) ) becomes singular. The convergence and stability of Newton’s method may be improved by using G = (J T J )−1
(37)
instead of the inverse of the Hessian in (36). This is an approximation to the Hessian matrix H in which the second term in (33) has been neglected. The resulting method is known as the Gauss–Newton method. Provided the rank of J is K, the matrix J T J is positive definite and therefore the direction defined by (J T J )−1 g (k) is downhill at x(k) unless |g | = 0. The penalty for stability of the Gauss–Newton method is that unless fi (x) → 0 at the minimum or the functions fi (x) are linear in x then the ultimate convergence of this method is only linear. However, it is possible to get into a situation in which J is not of full rank so that J T J is positive� semi-definite. If g (k) is in the null space of J T J so g (k) = γi vi , where vi are the eigenvectors corresponding to the zero eigenvalues then (p(k) )T g (k) = 0.
(38)
(39)
where σi is the standard error of the measurement yi . The gradient of χ 2 with respect to each component of b can be calculated by determining the derivative of χ 2 with respect to each bk (1 � k � K): gk =
� M � � yi − Y (xi , b) ∂Y (xi , b) ∂χ 2 =− . ∂bk ∂bk σi2 i=1
(40)
The elements of the Hessian matrix of χ 2 are given by � M � ∂χ 2 1 ∂Y (xi , b) ∂Y (xi , b) = 2 ∂bk ∂bl ∂bk ∂bl i=1 σi � 2 ∂ Y (xi , b) . (41) −(yi − Y (xi , b)) ∂bk ∂bl An approximation to the latter is � � M � ∂χ 2 1 ∂Y (xi , b) ∂Y (xi , b) . ≈ 2 ∂bk ∂bl ∂bk ∂bl i=1 σi
(42)
The term neglected in (42) contains the residual yi − Y (xi , b) as a factor. Since one would hope that the residuals are small this seems a reasonable approximation to the Hessian matrix particularly near the minimum. It also means that one does not have to calculate second derivatives of the model Y (x, b). For a given approximation, b(k) , to b the entries of the matrix J (k) and vector g (k) are defined by (k) Ji,j =
gi(k)
=
M � j =1
(k) Jj,i
∂Y (xi , b(k) ) ∂bj(k) �
� yj − Y (xj , b(k) ) . σj2
(43)
(44)
5
S M F D Syed Mustapha and T N Phillips
The Marquardt–Levenberg method for minimizing (39) is then [(J (k) )T J (k) + µ(k) I ](δ b)(k) = g (k) (45) b(k+1) = b(k) + (δ b)(k) .
(46)
The parameter µ(k) may be viewed as a regularization parameter which prevents the coefficient matrix in (45) becoming semi-definite. 6.2. The Marquardt–Levenberg algorithm In this section we apply the Marquardt–Levenberg algorithm to determine the K parameters bk , k = 1, . . . , K, in the problem described in section 6.1. The input parameters are the number of unknowns, K, and an initial approximation to those unknowns. On termination the algorithm will yield the vector b which minimizes χ 2 (b) defined by (39). Algorithm (1) (2) (3) (4) (5) (6)
Set k ← 0 and define an initial approximation b(k) to b. Calculate χ 2 (b(k) ). Set µ(k) ← 0.001. Compute the entries of J (k) and g (k) . Solve (45) for (δ b)(k) . Calculate (47) χ 2 (b(k) + δ b(k) ).
(1) Set N ← 0, tol ← 10−3 . (2) Introduce a new relaxation mode into the spectrum: N ← N + 1. Set g(N) ← 103 and λ(N) ← 10−3 . Save the current values of the discrete relaxation times and elastic moduli in a vector b of length 2N. (3) Minimize χ 2 (b) using the Marquardt–Levenberg algorithm. This gives the best least-squares fit to the data using N modes. (4) Estimate the variances: (k) T (k) −1 Calculate the diagonal entries of [(J2N ) J2N ] . (5) If λi < σλi or gi < σgi for any 1 � i � N then goto 6 else goto 2. (6) Set N ← N − 1. The relaxation times and elastic moduli are in b. Stop. To implement the Marquardt–Levenberg method on this problem we need to define the following matrices and derivatives. First of all, we define the matrix Ki,j Kˆ i,j = σ0 Gσi
i = 1, . . . , 2M; j = 1, . . . , N
and Pi,j =
(7) If χ 2 (b(k) + (δ b(k) )) � χ 2 (b(k) )
(48)
then set µ(k) ← 10µ(k) and goto (5), else set µ(k) ← max(0.1µ(k) , 10−7 ) and update the solution b(k+1) = b(k) + (δ b)(k) . (49) (8) If χ 2 (b(k+1) ) < χ 2 (b(k) ) and |χ 2 (b(k+1) ) − χ 2 (b(k) )| < ǫ then stop else set k ← k + 1 and goto (4). 6.3. Determination of the relaxation spectrum If we write σi = σ0 Gσi then the objective function given by (21) can be rewritten in the form χ2 =
2M � 1 2 i=1 σ0
� �N
�2 j =1 Ki,j gj −1 . Gσi
(50)
Recall that the minimization of χ 2 is now performed over the parameter space {λi , gi : 1 � i � N} where N is also allowed to vary. The entries of the 2M × N matrix K depend nonlinearly on the relaxation times λi , 1 � i � N . At each step in the procedure a new mode is introduced into the discrete spectrum and the parameters which minimize the objective function are determined to within a prescribed tolerance. This iterative procedure is repeated while the standard errors of the unknown parameters are lower than the calculated values of the parameters. The final spectrum is then given by the values obtained in the last but one iteration. 6
Algorithm
(51)
2λj ωi2 gj (1 + ωi2 λ2j )2 σ0 Gσi
i = 1, . . . , M; j = 1, . . . , N Pi+M,j =
(52)
ωi (1 − ωi2 λ2j )gj
(1 + ωi2 λ2j )2 σ0 Gσi
i = 1, . . . , M; j = 1, . . . , N
(53) 2
which enables us to write the first derivatives of χ with respect to gk and λl : � 2M � � N � ∂χ 2 1 ˆ ˆ Ki,k = Ki,j gj − ∂gk σ0 i=1 j =1
(54)
� 2M � � N � ∂χ 2 1 ˆ Pi,k . = Ki,j gj − ∂λk σ0 i=1 j =1
(55)
Then the following approximations to the Hessian matrix of χ 2 are constructed: 2M � ∂χ 2 ≈ Kˆ i,l Kˆ i,k ∂gl ∂gk i=1
(56)
2M � ∂χ 2 ≈ Pi,l Pi,k ∂λl ∂λk i=1
(57)
2M � ∂χ 2 ≈ Kˆ i,l Pi,k . ∂λk ∂gl i=1
(58)
These are the approximations which result in the Gauss– Newton method.
A dynamic nonlinear regression method
6.4. Stopping criteria The algorithm described in the previous section determines the discrete relaxation spectrum of a material. The number of relaxation times is increased steadily until they are no longer reliable. Our test for reliability involves checking the computed values of the relaxation times and elastic moduli against the diagonal entries of the covariance matrix. The diagonal entries of this matrix give the expected values of the squares of the errors. Once the computed values are dominated by their respective variances the algorithm is terminated and the spectrum calculated at the previous iteration is taken to be the solution of the least-squares process. This procedure would seem to give a reliable spectrum, and to avoid problems of ill-posedness associated with demanding ‘too many’ modes. This stopping criterion seems to be more soundly and mathematically based than an alternative strategy which involves terminating the algorithm when one of the elastic moduli becomes negative.
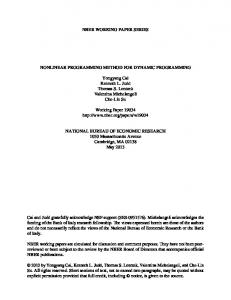
Figure 2. The double Gaussian spectrum of Honerkamp and
Weese [9] defined by (59) and (60) and the normalized spectrum obtained using the nonlinear regression technique on the exact data, i.e. σ = 0.
7. Numerical results
7.1. Analytical data The first example to be considered is for a model material and is generated from a relaxation spectrum proposed by Honerkamp and Weese [9]. This is a double Gaussian spectrum and is defined by � � � 1 1 gk = √ exp − 2(ln λk − ln λx )2 2 (2π ) � �� 1 + exp − (59) 2(ln λk − ln λy )2 � �(k−1)/(K−1) λb λk = λa k = 1, . . . , K (60) λa where λx = 5 × 10⁻² , λy = 5, λa = 1 × 10⁻³ , λb = 1 × 10² and K = 100. The corresponding simulated experimental results for the storage and loss moduli are given by K �
ωi2 λ2k G (ωi ) = gˆ k (1 + ωi2 λ2k ) k=1 ′
G′′ (ωi ) =
K � k=1
gˆ j
ωi λk (1 + ωi2 λ2k )
(61)
(62)
where �(i−1)/(N−1)
�
� ωb λb gˆ i = gi ln /(K − 1) ωi = ωa ωa λa (63) for i = 1, . . . , N, and ωa = 1 × 10⁻³ , ωb = 1 × 10³ and N = 30. Orbey and Dealy [11] present a comparison of a number of different methods for determining the discrete spectrum of this hypothetical material. The exact spectrum (◦) is shown in figure 2. Also shown in figure 2 is the simulated discrete spectrum (*) obtained by the nonlinear regression technique described in this paper. Orbey and Dealy [11], in figure 1 of their paper, provide a comparison of the regularization method of Honerkamp and Weese [9] and the nonlinear regression technique of �
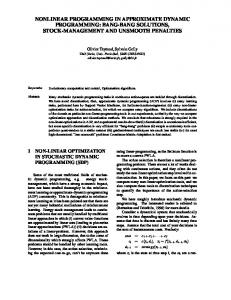
Figure 3. The dynamic moduli given by (61) and (62) and the
simulated fit to the perturbed data with σ = 0.04.
Baumgaertel and Winter [1]. Since different ranges and numbers of relaxation times are used in each method, the elastic moduli are normalized by dividing by a constant, g0 , where g0 = ln(λb /λa )/(K − 1). The spacing between the relaxation times in the nonlinear regression techniques is not uniform. The method presented in this paper determines eight relaxation times and as can be seen in figure 2 these lie on or very close to the original spectrum. A comparison of this discrete spectrum with those generated by the other techniques shows that it falls slightly closer to the original spectrum and is therefore competitive with these methods. The next numerical experiment assumes that the simulated experimental data are affected by a relative error of size σ in the following manner G′ (ωi )(1 + σ N (0, 1))
G′′ (ωi )(1 + σ N (0, 1))
i = 1, . . . , N 7
S M F D Syed Mustapha and T N Phillips Table 1. Discrete spectrum and estimated errors for sample A.
i 1 2 3 4 5
λi
gi
24.615 697 2.123 696 0.270 102 0.034 361 0.003 887
4970.486 055 10 760.170 404 29 159.299 427 68 185.273 941 162 305.539 687
σλi
σgi −2
1.175 × 10 1.000 × 10⁻⁴ 1.738 × 10⁻⁶ 2.635 × 10⁻⁸ 3.215 × 10⁻¹⁰
1.380 × 10² 1.509 × 10³ 9.063 × 10³ 3.858 × 10⁴ 8.384 × 10⁴
Table 2. Discrete spectrum and estimated errors for sample B.
i 1 2 3 4 5
λi
gi
16.861 48 1.508 904 0.213 075 0.030 202 0.003 576
2067.868 82 8006.693 575 28 604.608 139 70 968.38 776 171 524.706 094
σλi
σgi −3
4.892 × 10 4.927 × 10⁻⁵ 1.142 × 10⁻⁶ 2.341 × 10⁻⁸ 3.464 × 10⁻¹⁰
3.950 × 101 1.346 × 10³ 1.187 × 10⁴ 4.981 × 10⁴ 1.205 × 10⁵
to the exact analytical spectrum despite using contaminated dynamic data. 7.2. Experimental data The nonlinear regression algorithm described in this paper is now applied to experimental data sets for the following material samples: Sample A, Neste HDPE (Grade 3415) at 190 ◦ C Sample B, Neste HDPE (Grade 3416) at 190 ◦ C Sample C, The model fluid S1 (see [5], for example) (a solution of 2.5% weight polyisobutylene in a solvent of 19 parts Decalin to 20 parts polybutene)
Figure 4. The double Gaussian spectrum of Honerkamp and
Weese [9] defined by (59) and (60) and the normalized spectrum obtained using the nonlinear regression technique on the noisy data with σ = 0.04. Table 3. Discrete spectrum and estimated errors for sample C.
i 1 2 3 4 5
λi 5.044 203 0.720 174 0.096 664 0.009 799 0.000 432
gi 1.565 409 13.796 343 39.650 799 94.152 547 943.854 733
σλi
σgi −4
2.419 × 10 6.154 × 10⁻⁶ 1.434 × 10⁻⁷ 1.372 × 10⁻⁹ 3.259 × 10⁻¹²
6.964 × 10⁻⁵ 2.056 × 10⁻³ 9.088 × 10⁻³ 4.269 × 10⁻² 1.105 × 101
where N (0, 1) denotes a normally distributed random number. With σ = 0.04 we use the data listed in table I of Honerkamp and Weese [9]. In figure 3 we compare the exact dynamic moduli given by (61) and (62) and the numerically simulated fit to the ‘noisy’ data. An excellent fit to the exact data is obtained by a five-mode spectrum determined by the nonlinear regression method. A more sensitive test of the method, however, is a comparison between the relaxation spectrum given by (59) and (60) and the five-mode spectrum generated from the noisy storage and loss moduli. A comparison between the two is provided in figure 4. Again, a satisfactory fit to the spectrum is obtained with the computed discrete relaxation spectrum lying very close 8
The discrete relaxation spectrum and corresponding elastic moduli for each of these materials are given in tables 1, 2 and 3, respectively. Also shown in these tables are the estimates of the standard errors which are used to determine the number of modes that are appropriate. Adding an extra relaxation mode to each of these spectra would produce values smaller than the estimated variances and, therefore, would be meaningless. In tables 4 and 5, we show what happens when we continue the algorithm to N = 8 for samples A and B, and in table 6 when N = 6 for sample C. Note that our sole purpose in presenting the results in tables 4–6 is to demonstrate that the algorithm does indeed stop before the calculated values are dominated by an estimate of the error. Note that in these tables the values of the relaxation times and elastic moduli are smaller than their estimated variances and so these results are untrustworthy. In the case of Sample C one of the elastic moduli becomes negative when N = 6 (see table 6). In figures 5, 6 and 7, we demonstrate the fit of the data by plotting the graphs of the dynamic moduli as defined by (9) and (10). The corresponding data points are also plotted. In figure 8 we show how the least-squares error decreases as the number of modes is increased for sample A. We notice that beyond N = 5 there is little discernible improvement in the leastsquares error. This is the point at which our stopping criteria cuts in and terminates the algorithm. The behaviour of the least-squares error (defined by (50) with σ0 = 1) with increasing N is shown in table 7 for sample A. Here we see very clearly that there is very little improvement in increasing
A dynamic nonlinear regression method Table 4. Extended discrete spectrum and estimated errors for sample A with N = 8.
i
λi
1 2 3 4 5 6 7 8
gi
30.900 938 4.043 001 1.008 734 0.275 804 0.074 076 0.020 511 0.005 221 0.000 214
σλi
σgi −3
7.927 × 101 2.030 × 10³ 1.313 × 10⁴ 3.678 × 10⁴ 1.266 × 10⁵ 2.993 × 10⁵ 1.068 × 10⁶ 1.519 × 10¹⁰
9.386 × 10 7.962 × 10⁻⁴ 1.563 × 10⁻⁴ 1.684 × 10⁻⁵ 1.413 × 10⁻⁶ 1.226 × 10⁻⁷ 1.119 × 10⁻⁸ 2.038 × 10⁻⁹
4201.417 977 5442.184 427 9972.812 608 18 362.675 061 31 912.304 286 51 932.731 161 88 445.820 388 665 254.282 165
Table 5. Extended discrete spectrum and estimated errors for sample B with N = 8.
i
λi
gi
σλi
σgi
1 2 3 4 5 6 7 8
19.324 877 2.391 331 0.593 426 0.170 902 0.053 116 0.016 366 0.004 460 0.000 001
1808.036 178 4223.027 237 10 275.967 650 19 779.685 580 33 558.068 563 53 774.401 582 93 719.026 059 192 826 196.463 137
2.971 × 10⁻⁵ 2.050 × 10⁻⁷ 1.321 × 10⁻⁸ 1.409 × 10⁻⁹ 1.709 × 10⁻¹⁰ 1.869 × 10⁻¹¹ 1.471 × 10⁻¹² 9.541 × 10⁻²⁰
4.979 × 10⁻² 4.567 × 10⁻¹ 2.651 1.101 × 101 3.532 × 101 1.004 × 10² 3.475 × 10² 7.808 × 10⁹
Table 6. Extended discrete spectrum and estimated errors for sample C with N = 6.
i 1 2 3 4 5 6
λi 5.046 034 0.720 667 0.096 726 0.009 771 0.000 406 0.000 020
gi 1.564 280 13.787 260 39.656 460 94.534 516 1029.092 525 −36.847 662
σλi
σgi −12
2.799 × 10 5.016 × 10⁻¹⁴ 2.074 × 10⁻¹⁵ 3.218 × 10⁻¹⁷ 1.931 × 10⁻²⁰ 1.450 × 10⁻¹⁷
4.080 × 10⁻¹³ 1.662 × 10⁻¹¹ 1.762 × 10⁻¹⁰ 1.430 × 10⁻⁹ 1.231 × 10⁻⁷ 5.056 × 10⁻⁵
Figure 5. Comparison of the data and model predictions for
Figure 6. Comparison of the data and model predictions for
sample A.
sample B.
the value of N beyond N = 5. Furthermore, if N is increased further this is likely to lead to an ill-posed problem. The value of the tolerance, ǫ, in the algorithm is set at 10−6 . Lowering this value does not effect the solution considerably. The value of σ0 = 10−4 is used in the computations. For small values of N (< 5) the algorithm
typically takes around 40–70 iterations to converge to within the required tolerance. For larger values this number increases to at most 120 iterations. For the three data sets we have considered the program takes around 3 min to run on a PC with processor speed of 100 MHz. The analysis of Davies and Anderssen [3] suggests that 9
S M F D Syed Mustapha and T N Phillips
and Andersson [3] would argue that that is all one can expect from the available data. 8. Calculation of discrete retardation spectra
A knowledge of the discrete relaxation spectrum enables one to define the corresponding discrete retardation spectrum [6, 7]. An alternative linear viscoelastic constitutive equation expresses the strain in terms of the history of the time derivative of the stress, i.e. � t γ (t) = J (t − t ′ )σ˙ (t ′ ) dt ′ (64) −∞
Figure 7. Comparison of the data and model predictions for
sample C.
where J (t) is the creep compliance. The linear relaxation function G(t) and the creep compliance are related by � t (65) G(t ′ )J (t − t ′ ) dt ′ = t. 0
Since we have an expression for the relaxation spectrum in closed form one can solve (65) using the Laplace transform technique ˆ Jˆ(s) = 1 G(s) s2
(66)
ˆ where G(s) and Jˆ(s) are the Laplace transform of G(t) and J (t), respectively. The Laplace transform of G(t) defined by (5), i.e. � � N � t G(t) = Ge + gi exp − (67) λi i=1 in the case of a viscoelastic liquid (Ge = 0), ˆ G(s) =
Figure 8. Dependence of the least-squares error on the number of
N � i=1
gi s + (1/λi )
(68)
is substituted into (66) to give the following representation for the Laplace transform of the retardation spectrum
modes for sample A.
�N 1 k=1 (s + (1/λk )) Jˆ(s) = 2 �N . �N s i=1 (gi k=1k =i (s + (1/λk )))
Table 7. Dependence of the least-squares error on N for sample A.
N
Least-squares error
1 2 3 4 5 6 7 8
5.541 2.883 1.240 5.010 × 10⁻¹ 2.127 × 10⁻¹ 1.195 × 10⁻¹ 9.371 × 10⁻² 8.937 × 10⁻²
for the given frequency ranges in their appendices A–C that the corresponding relaxation spectrum is determined in the interval 0.019 < λ < 3.309 for samples A and B, and 0.0048 < λ < 3.300 for sample C. We note that the spectra we have determined fall outside this range. If we restrict the spectra to lie inside the predicted intervals then the accuracy of the least-squares fit to the data is poor, although Davies 10
(69)
The N − 1 discrete retardation times are the inverses of the real roots of �� � � � N −1 � N � 1 1 = G0 (70) s+ gi s+ λk 5i i=1 i=1 k=1k =i where G0 =
N �
gi .
i=1
The ordering of the relaxation and retardation times is found to be [9]. λ1 < 51 < λ2 < 52 < · · · < λN−1 < 5N −1 < λN . The full details of this procedure are given in [1] together with the derivation for a viscoelastic solid (Ge = 0).
A dynamic nonlinear regression method
9. Conclusion
The determination of the discrete relaxation spectrum of a viscoelastic material is an important but difficult process. The determination of the continuous relaxation spectrum by inverting the Fredholm integral equations (7) and (8) is well known to be an ill-posed problem. When linear regression is used to determine the discrete relaxation spectrum problems occur when some of the relaxation times are close. In this paper we have introduced a new nonlinear regression technique, based on the Marquardt–Levenberg procedure, for the determination of the discrete relaxation spectrum. A comparison with other techniques has been presented for some simulated analytical data of Honerkamp and Weese [9]. The new approach compares very favourably with other techniques. In this approach the number of discrete modes is gradually increased. The expected values of the model parameters are used to guide the decision when to terminate the calculation. This strategy is applied to experimental data obtained for real fluids and shown to be robust and reliable. References [1] Baumgaertel M and Winter H H 1989 Determination of discrete relaxation and retardation time spectra from dynamic mechanical data Rheol. Acta 28 511–19 [2] Baumgartel M and Winter H H 1992 Interrelation between discrete and continous relaxation spectra Theoretical
[3] [4] [5] [6] [7] [8] [9] [10] [11] [12]
[13]
[14]
and Applied Rheology vol 1 and 2 (Amsterdam: Elsevier Science) Davies A R and Anderssen R S 1997 Sampling localization in determining the relaxation spectrum J. Non-Newtonian Fluid Mech. 73 163–79 Elster C, Honerkamp J and Weese J 1992 Using regularisation methods for the determination of relaxation spectra of polymeric liquids Rheol. Acta 31 161–74 Ferguson J and Hudson N E 1994 The shear and extensional flow properties of S1 J. Non-Newtonian Fluid Mech. 52 121–35 Ferry J D 1970 Viscoelastic Properties of Polymers (New York: Wiley) Gross B 1953 Mathematical Structure of the Theories of Viscoelasticity (Paris: Hermann and Cie) Honerkamp J 1989 Ill-posed problems in rheology Rheol. Acta 28 363 Honerkamp J and Weese J 1989 Determination of the relaxation spectrum by a regularisation method Macromolecules 22 4372–7 Morozov V A 1984 Methods for Solving Incorrectly Posed Problems (New York: Springer) Orbey N and Dealy J M 1991 Determination of the relaxation spectrum from oscillatory shear data J. Rheol. 35 1035–49 Winter H H and Baumgaertel M 1993 A parsimonious model for viscoelastic liquids and solids Techniques in Rheological Measurement (London: Chapman and Hall) ch 5 Winter H H, Baumgaertel M, Soskey P and Venkataraman S 1990 Computer aided rheometry 3rd Eur. Rheology Conf. and Golden Jubilee Meeting of British Society of Rheology pp 504–6 Winter H H and Jackson J 1995 Linear viscoelasticity: the search for patterns in the relaxation of polymer melts Rheological Fundamentals of Polymer Processing (Netherlands: Kluwer)
11
Annotations from 19106e.pdf Page 2 Annotation 1; Au: Ref [10] is Morosov, please check? Page 10 Annotation 1; Au: their appendices, OK?