A Fast Host-Based Intrusion Detection System Using Rough Set Theory Sanjay Rawat1,2 , V P Gulati2 , and Arun K Pujari1 1
AI Lab, Dept. of Computer and Information Sciences University of Hyderabad, Hyderabad-500046, INDIA
[email protected],
[email protected] 2 IDRBT Castle Hills, Road No.1 Masab Tank, Hyderabad-500057, INDIA
[email protected]
Abstract. Intrusion Detection system has become the main research focus in the area of information security. Last few years have witnessed a large variety of technique and model to provide increasingly efficient intrusion detection solutions. We advocate here that the intrusive behavior of a process is highly localized characteristics of the process. There are certain smaller episodes in a process that make the process intrusive in an otherwise normal stream. As a result it is unnecessary and most often misleading to consider the whole process in totality and to attempt to characterize its abnormal features. In the present work we establish that subsequences of reasonably small length of sequence of system calls would suffice to identify abnormality in a process. We make use of rough set theory to demonstrate this concept. Rough set theory also facilitates identifying rules for intrusion detection. The main contributions of the paper are the following- (a) It is established that very small subsequence of system call is sufficient to identify intrusive behavior with high accuracy. We demonstrate our result using DARPA’98 BSM data; (b) A rough set based system is developed that can extract rules for intrusion detection; (c) An algorithm is presented that can determine the status of a process as either normal or abnormal on-line. Keywords:Data mining, Decision Table, Rough Set, Intrusion Detection, Anomaly, Misuse.
1
Introduction
Intrusion detection systems (IDSs) have become a major area of research and product development. They work on the premise that intrusions can be detected through examinations of various parameters such as network traffic, CPU utilization, I/O utilization, user location, and various file activities. Based on the various approaches, different types of IDS are proposed in the literature. On the basis of audit data, there are two types of IDS. The network-based systems collect data directly from the network that is being monitored, in the form of packets
[29] and the host-based systems collect data from the host being protected [2]. Based on processing of data to detect attacks, IDS can also be classified into two types – misuse-based systems and anomaly-based systems. While the former keeps the signatures of known attacks in the database and compares new instances with the stored signatures to find attacks, the latter learns the normal behavior of the monitored system and then looks out for any deviation in it for signs of intrusions. It is clear that misuse based IDS cannot detect new attacks and we have to add manually any new attack signature in the list of known patterns. IDS based on anomaly detection, on the other hand, are capable of detecting new attacks as any attack is assumed to be different from normal activity. However anomaly based IDS sometimes sets false alarms because it cannot differentiate properly between deviations due to authentic user’s activity and that of an intruder. Among various IDS approaches, signature-analysis stores patterns of attacks as semantic descriptions [21]. The main drawback of the signature analysis technique, like all misuse-based approaches, is the need for frequent updates to keep up with the stream of new vulnerabilities/attacks discovered. Rule-based intrusion detection [34][20][13] assumes that intrusion attempts can be characterized by sequences of events that lead to the state of compromised-system. Such systems are characterized by their expert system properties that fire rules when audit records or system status information begin to indicate suspicious activity. The main limitations of this approach are the difficulty of extracting knowledge about attacks and the processing speed. State transition analysis technique describes an attack with a set of goals and transitions, and represents them as state transition diagrams [18][19][32]. The most widely used approach of anomaly-based intrusion detection is statistical [16][27]. User or system behavior is measured by a number of variables sampled over time and stored in a profile. The current behavior of each user is maintained in a profile. At regular intervals the current profile is merged with the stored profile. Anomalous behavior is determined by comparing the current profile with the stored profile. Forrest et al [11][12] suggest that system calls trace of a process under normal execution can be taken as its normal behavior in terms of system calls, as variation in sequences of system calls is very small. On the other hand, this variation is relatively higher when compared to a sequence of system calls under abnormal execution. This variation can be attributed to the presence of one or more alien (thus malicious) subsequences in the abnormal process. It should be noted that not all the subsequences of an abnormal process are malicious. Thus intrusive part should be detectable as a subsequence of the whole abnormal sequence of the process. In this paper we present a technique of discovering rules for intrusion detection. We make use of rough set theory for this purpose. To best of our knowledge, Lin was the first to propose the idea of applying rough sets to the problem of anomaly detection [25]. Though the paper lacks the experimental results [25], it provides some solid theoretical background. The following two theorems are important:
1. Every sequence of records in computer has a repeating sequence 2. If the audit trail is long enough, then there are repeating records Following the argument of Forrest et al and in the view of above theorems, our approach is based on subsequences of system calls. We formulate the problem as a classification problem by writing the set of subsequences as a decision table. The proposed method is a combination of signature-based and anomaly based approaches. A program behavior is monitored as a sequence of system calls. These sequences are further converted into the subsequences of shorter length. These subsequences are considered as the signatures for malicious as well as normal activities. By doing so, one of the disadvantages of signature-based approach of frequently updating the signature database can be avoided. Empirical results show that the proposed system is able to detect new abnormal activities without updating the signatures. Further, these signatures are represented in the form of IF-THEN type decision rules. The advantage of representing signatures in this form is that such signatures are easy to interpret for further analysis. Rough set theory is used to induce decision rules. Rules induced by using rough set theory are very compact because before inducing rules, all the redundant features of the audit data are removed. This makes the matching of rules faster, thus making the system suitable for on-line detection. The proposed system is also fast in the sense that process is compared, in parts, as it starts calling system calls. So we do not have to wait until it exits. The major contributions of the paper are: – It is established empirically that short sequences of system calls are sufficient to detect intrusive behavior with high accuracy; – A rough set based approach is developed that can extract decision rules for intrusion detection; – An algorithm is presented that can classify a process as normal or abnormal on-line. Rest of the paper is organized as follows: Section 2 gives an overview of research work on process profiling using sliding window approaches and learning rules for intrusion detection. Section 3 presents some preliminary background to understand the approach. A detailed description of the proposed scheme is given in the section 4. Section 5 covers the experimental setup and analysis of the results. Section 6 concludes the paper.
2
Related Work
Recently, process monitoring for the sign of intrusions has attracted the attention of many researchers and active research is being done in this area. In the approach, called time-delay embedding (tide), initiated by Forrest et al [11][12], normal behavior of processes is captured because programs show a stable behavior over the period of time under normal execution. In this approach, short
sequences of system calls are used to profile a process. It uses a sliding window algorithm to populate a table with the positional relationships between system calls. Forrest et al use a sliding window of size k + 1 to record which system calls succeed or precede each other at offsets 1 through k. This implementation is said to have a ”forward” lookahead because while matching with the testing process, the current system call is used as the index to the table and anomalies are found by performing a pair wise comparison between the current system call and each system call that follows at offsets 1 through k. If the process, under consideration, has a matching system call in the table at each offset, then it can be considered normal. Otherwise it is abnormal. Inspired by human immune system, tide approach is extended by Hofmeyr et al [17] by using a technique called sequence time-delay embedding (stide). In this approach, the traces of system calls generated by a process are scanned and a database of all unique sequences of a given length, k that occurred during the trace, is built up. The database, then, is used to monitor the ongoing behavior of the processes invoked by the program, by calculating Hamming distance between two sequences. An anomaly count is defined as the number of mismatches in a temporally local region. If the count is greater than a predefined threshold, the sequence is flagged as anomalous. A simple addition to stide, called stide with frequency threshold (t-stide) is proposed to test the premise that rare sequences are suspicious [37]. For each sequence in database, frequency of its occurrence in training data is also recorded. Sequences from test traces are compared to those in the database, just like stide. Rare sequences, as well as those not included in the database, are counted as mismatches. These mismatched are aggregated into locality frame count. Some better results are found if the length of the sequences is not fixed [38]. These approaches are not suitable for on-line detection as the frequency cannot be determined until after the process terminates [37]. Following the inspirations from immune system, Cabrera et al propose to build Anomaly Dictionaries as self for anomalous sequences [6]. These anomaly dictionaries contain short sequences of system calls spawn by processes under attacks. A string matching classifier is used to classify any new process. A similar approach is followed by Lee et al [22], but they make use of a rule learner RIPPER, to form the rules for classification. The normal process is transformed into sequences of fixed length, k. Each sequence is turned into a RIPPER sample by treating all system calls, except the last in the sequence, as attributes and the last one as the target class. All of the above approaches concentrate only on the sequences of system calls. Tandon and Chan [36] propose to consider system calls arguments and other parameters, along with the sequences of system calls. They make use of the variant of a rule learner LERAD (Learning Rules for Anomaly Detection). Three variants of LERAD are proposed to generate rules under different inputs - S-LERAD for sequences of system calls only, A-LERAD for system call arguments and other key attributes and M-LERAD for argument information and sequences of system calls. A total of six system calls are used in training -
first five as conditions and sixth one as decision. In A-LERAD, system calls are taken as pivotal attributes. Any value for other arguments (path, return value, error status), given a system call, which was never encountered in the value for a long time, would trigger an alarm. M-LERAD merges both S-LERAD and A-LERAD. Each input comprises of system call, arguments, path, return value, error status and the previous five system calls. In a recent paper [33], an efficient scheme is proposed by using kNN classifier. A new similarity measure is proposed to consider the frequency and ordering of system calls in a process under normal execution. Rough set theory has well been applied to many data mining techniques like association rules, classification and clustering. The use of rough sets in the simple and improved formation of association rules is shown by Guan et al [15] and Delic et al [10]. Guan et al show that maximal association rules can be formed by applying basic rough set operations in a much simpler manner. Delic et al argue to reduce the computational time by applying the concept of reduct extraction directly on the produced rules, not on attribute. As a result, they propose the hybridization of apriori algorithm and rough set, named as Apriori+, to generate association rules. With the increase of web-based transactions over internet, it is interesting and necessary to learn user’s activities for better understanding and improvement of web services. Often, it is very difficult to categorize users into different clusters as boundary of user’s activities is not sharp. A rough set based clustering scheme is proposed by Lingras to cluster various users, based on their access-patterns [26]. The scheme is applied on university students to cluster them into three groups– studious, crammers and workers, by using five attributes of access-patterns. The genetic algorithms are used to maximize the prescision value. The problem of vague boundaries is tackled by calculating lower and upper approximations of three groups. An et al investigate the idea of applying rough set to text classification, particularly web page classifications. As a standard technique, pages are described as frequencies or top n occurring words under each of the k categories. Out of these n words, many may be redundant and, therefore, can be discarded. Rough set based operation, called positive region, is used to calculate the importance of the attributes and thereby removing the unnecessary attributes (words). ELEM2 rule induction algorithm is used to learn the rules for each category. Each rule is given a score, termed as rule quality and based on this number, test instances are classified to different categories. Dan Zhu et al [39] present a comparative study on IDS based on neural network, inductive learning and rough sets and find that, on an average, rough set based approach performs better over other techniques. But, according to their study, rough sets are not as efficient as neural network in classifying unseen objects. Rough set theory has been applied on sequence of system calls made by a process to learn the normal behavior of process in terms of IF-THEN rules [7]. These rules are used to predict the (k +1)th system call in a sequence of length k.
If the predicted and the actual system calls are identical, the sequence is normal otherwise abnormal. The present study takes a similar approach but instead of predicting next system call in order to classify the process, it shows that a process can directly be classified as normal or abnormal based on its subsequences of system calls. Very recently, Lian-hua et al [24] apply rough set classification (RSC) technique to network-based IDS. In their approach, decision table consists of network connection records, provided by KDD data set. The approach is based on the observation that rough set reduct computation can be viewed as a minimal hitting set problem. A minimal hitting set is computed from the multiset which, in turn, computed from the discernibility function. A hybrid genetic algorithm is used to calculate the reducts of rough set. The results are compared with the SVM-based IDS and are found to be better for DoS and probing attacks, but inferior in case of R2L and U2R categories of attacks. The computation time for reduct calculation is also minimized by using new hybrid genetic algorithm.
3
Preliminary Background
In this section, we provide some basic definitions and notations used in our work. Later in the section we try to formulate intrusion detection as a problem in rough set theory. 3.1
Rough Set Theory
Knowledge discovery comprises of techniques from machine learning, statistics, pattern recognition, fuzzy and rough sets etc to extract knowledge or information from the huge amount of data. Rough set theory was introduced by Z. Pawlak [31] to provide a systematic mathematical framework for studying imprecise and insufficient knowledge to generate decision rules. A rough set is a set of objects that cannot be precisely characterized based on a set of available attributes. The idea of rough set consists of the approximation of a set by a pair of sets, called as lower approximation and upper approximation. Let S =< U, Q, V, f > be an information system where U - is the closed universe, a finite S set of N objects x1 , x2 , ..., xN ; Q is a finite set of n attributes q1 , q2 , ..., qn ; V = q∈Q Vq where Vq the domain of attribute q; and f : U ×Q → V is the total function called as information function such that f (x, q) ∈ Vq for every x ∈ U and q ∈ Q. A subset of attributes A ⊆ Q determines as equivalence relation of the universe U , called as indiscernibility relation and denoted as IND(A). Definition 1: For a given A ⊆ Q and X ⊆ U (a concept X), the A-lower approximation (AX) and A-upper approximation (AX) of set X are defined as follows: S AX = {x ∈ U : [x]A ⊆ X} = S{Y ∈ A∗ : Y ⊆ X} (1) AX = {x ∈ U : [x]A ∩ X 6= φ} = {Y ∈ A∗ : Y ∩ X 6= φ} where [x]A = {y ∈ U : xIN D(A)y} and A∗ is the partition of U generated by IND(A) on U .
Definition 2: The accuracy of an approximation of the set X by the set of attributes A is defined as: |AX| αA (X) = (2) |AX| Definition 3: Given an information system S =< U, Q, V, f >, with condition and decision attributes Q = A ∪ D, s.t. A ∩ D = φ, for a given set of condition attributes A, we can define the A-positive region P OSA (D) in the relation IN D(D) as: [ P OSA (D) = {AX : X ∈ D∗ } (3) where D∗ denotes the family of equivalence classes defined by the relation IND(D). P OSA (D) contains all the objects in U which can be classified perfectly without error into the distinct classes defined by IND(D), based only on information in relation IND(D). Similarly, in general, if A, B ⊆ Q, then A-positive region of B is defined as [ AX P OSA (B) = (4) X∈B ∗
3.2
Decision Table
A data set is represented as a table, where each row represents an object or case. Every column represents an attribute that can be measured for each object. In supervised learning, there is an outcome of classification that is known. This a posteriori knowledge is expressed by one distinguished attribute called decision attribute. A table wherein one of the attributes is decision attribute is called a decision table. More precisely: Definition 4: Given an information system S =< U, Q, V, f >, if Q can be expressed as condition and decision attributes i.e. Q = A ∪ D, with A ∩ D = φ, then S is called a decision table (or decision system) [8]. Definition 5: A decision table is said to be consistent if each unique row has only one value of decision attribute. Objects from decision table can be partitioned into disjoint classes, called concepts, based on the decision attributes D. Definition 6: An expression (a = v), where a ∈ A and v ∈ Vq , is called an atomic formula (or elementary condition) c. An elementary condition c can be interpreted as mapping: c : U → {true, f alse} A conjunction C of q elementary condition is denoted by C = c1 ∧ c2 ∧ ... ∧ cq . Definition 7: The cover of C, denoted by [C], is the subset of objects (examples), which satisfy the conditions represented by C. [C] = {x ∈ U : C(x) = true}
3.3
Decision Rules
The decision rules are logically described as If (a conjunction of elementary conditions) then (decision) In general decision rules can be considered as data patterns, which represent relationships between values of attributes in the decision table. The rule set, obtained from a consistent table, is said to be deterministic. Any set of rules may fall into any of the following three categories [35]: – Minimum set of decision rules, – Exhaustive set of decision rules, – Satisfactory set of decision rules First category contains the smallest number of rules sufficient to cover the set of objects belonging to one class. Second category consists of all the rules that can be induced from the table. However, time complexity for the second choice is exponential and using this approach may not be practical for larger data set [35]. For our experiment we, therefore, choose the first approach of inducing rules, as the data set used in our experiment is very large. We make use of a rough set based algorithm LEM2 for inducing rules [14], which is presented in figure 1. We use the same notations introduced in the previous section. Additionally C(G) denote the set of conditions c currently considered to be added to the conjunction C. K is the concept and rule r is characterized by its conditional part R. LEM2 algorithm follows a heuristic strategy from machine learning techniques. The strategy starts with creating a first rule by choosing sequentially the ’best’ elementary conditions (conjunction of attributes values). Then, all the learning examples that matches this rules are removed from consideration. The process is repeated iteratively while some learning examples remain uncovered. The rules so obtained are capable of classifying new unseen objects [35]. In the whole process, the algorithm also discards all the dispensable attributes. Thus the number of attributes to be matched is reduced which makes the algorithm faster and hence more suitable for nearly real time detection.
4
The Proposed Approach: Rough Set and Intrusion Detection
The data mining techniques are well suited for IDS design because the aim of an intrusion detection system is to trigger alarm (present knowledge) when any intrusion occurs. Thus an IDS can be thought of a decision support system which stores huge data (host or network related) and extracts useful patterns (information about the normal and abnormal behavior) so that it can classify normal and abnormal data precisely. Forrest et al [12] suggested the use of small sequences of system calls, made by a process, as the profile of the process. The study done by Lee et al [22] also validates this observation. But if we analyze normal and abnormal processes, we find that not all parts of an abnormal
Input:K- set of objects Output:R- set of rules begin G = K; R = φ; while G 6= φ do begin C = φ; C(G) = {c : [c] ∩ G 6= φ}; while (C = φ) or (!([C] ⊆ K)) do begin select a pair c ∈ C(G) such that |[c] ∩ G| is maximum; if ties, select a pair c ∈ C(G) with the smallest cardinality |[c]|; if further ties occur, select the first pair from the list; C = C ∪ {c}; G = [c] ∩ G; C(G) = {c : [c] ∩ G 6= φ}; C(G) = C(G) − C; end; for each elementary condition c ∈ C do if [C − c] ⊆ K then C = C − {c}; create rule [r basing the conjunction C and add it to R; G=K−
[R]; r∈R
end; for each [ r ∈ R do if
[S] = K then R = R − r s∈R−r
end
Fig. 1. LEM2 algorithm
process are responsible for intrusion. Thus intrusive part should be detectable as a subsequence of the whole abnormal sequence of the process. Thus one point of focus of this study is to determine the adequate length of such subsequences. Also as pointed out earlier, not all of the subsequences of an abnormal process are abnormal. Many of them will be identical to those occurred in normal process. This is the point where rough set theory can be used to derive disjoint set of subsequences. Let P be a set of normal processes, defined as sequences of system calls. Then the lth process can be represented as < pl1 , pl2 , . . . , pln > where n is the length of the process and plj is j th system call. Each of these processes is transformed into the subsequences of length k. Thus for lth sequence, ith subsequence is given by pli , pli+1 . . . , pli+k−1 Each of these subsequences is labeled as normal. In case of abnormal processes, as pointed out earlier, not all of the subsequences of an abnormal process are abnormal. Many of them are identical to those occurred in normal process. Thus a subsequence corresponding to an abnormal process, matching with any of the
normal subsequences, is discarded; otherwise it is labeled as abnormal. With the above formulation, we consider an intrusion detection system as an information system S =< U, Q, V, f >, defined in the section 3.1 with Q = A ∪ D, D= {normal, abnormal}. The number of attributes in the conditional part A equals the length of the subsequence. V consists of all the system calls appearing in all the processes used for training. U consists of all the subsequences of the chosen length that can be derived from all the processes using sliding window of the chosen length k. It should be noted that by removing duplicate subsequences, we get a consistent decision table because no subsequence can belong to normal as well as abnormal classes. To put in rough set terminology, let P and T be two normal and abnormal processes respectively given as P =< p1 , p2 , . . . , pn > and T =< t1 , t2 , . . . , tm > where pi ’s and tj ’s are system calls. Let k be the size of sliding window. Each process P and T is transformed into subsequences of length k. Then the information system S can be represented as follows: A is comprised of k attributes A1 , A2 . . . , Ak . U consists of all the subsequences of the forms Pi = pi , pi+1 , . . . , pi+k−1 and Ti = ti , ti+1 , . . . , ti+k−1 , represented as rows of S. Let us denote normal and abnormal classes by Dnormal and Dabnormal , which is a partition of U by the decision attribute D, denoted as D∗ . As mentioned earlier that there will be many Ti ’s which are identical to some Pi ’s, but labeled as abnormal. Therefore the lower approximations of both the classes Dnormal and Dabnormal are calculated as ADnormal and ADabnormal . Therefore the positive region P OSA (D) = ADnormal ∪ ADabnormal contains only those subsequences that belong to either of the classes but not both. We apply LEM2 algorithm on S to form the certain rules. By doing so, we get the signature for normal and abnormal processes. Let us take an example to make it more clear. Let P 1 = and P 2 = be normal and abnormal processes respectively. We transform P 1 into a set of subsequences using a sliding window of length 5. We label all the 4 subsequences as normal. While calculating the subsequences of P 2 , the first subsequence < fcntl, close, fcntl, close, open> matches with the last subsequence of P 1 and therefore it is discarded. The second subsequence < close, fcntl, close, open, open> is labeled as abnormal and added to the decision table. The final decision table is shown in the table 1. It can be seen in table 1 that the decision table, thus created, is consistent. We can calculate IF-THEN rules, using LEM2 algorithm, shown in table 2. The rules, induced by LEM2, are used to classify new processes. While classifying any new process, it is first transformed into a set of subsequences and each of these subsequences is classified on the basis on decision rules. If any subsequence pertaining to a process is classified as abnormal, the whole process is considered as abnormal. The algorithmic form of the proposed scheme is presented in figure 2 below.
Objects 1 2 3 4 5
A1 fcntl close close fcntl close
A2 close close fcntl close fcntl
A3 close fcntl close fcntl close
A4 fcntl close fcntl close open
A5 close fcntl close open open
Decision normal normal normal normal abnormal
Table 1. Representation of subsequences
1 (A2 = close)⇒ (Dec =normal) 2 (A1 = close)∧ (A2 = fcntl) ∧ (A3 = close) ∧ (A4 = fcntl)⇒ (Dec = normal) 3 (A1 = close) ∧ (A2 = fcntl) ∧ (A3 = close) ∧ (A4 = open) ⇒ (Dec=abnormal) Table 2. Representation of IF-THEN rules
5
Experimental Setup and Results
The scheme described in the previous section is tested upon the well-cited DARPA’98 data [9]. The whole data comprises of network level data and host level data. The host-based data is provided in two forms - NT audit logs and BSM audit logs. Process level information can be derived from BSM audit data. Therefore we use BSM audit logs from the 1998 DARPA data for training and testing of our algorithm. A detailed procedure for the extraction of process from the audit logs can be found in [33]. However, for completeness, we summarize the whole process below. For each day of data, a separate BSM file is provided with the ’BSM List File’. All the intrusive sessions are labeled with the name of the attacks launched during the sessions. On analyzing the entire set of BSM logs (list files), we locate the five days which are free of any type of attacks. We choose the first four days for our training data and the fifth one for the testing of the normal data to determine the false positive rate. There are around 2000 normal sessions reported in the four days of data. We extract the processes occurring during these days and our training data set consists of 606 unique processes. There are 412 normal sessions on the fifth day and we extract 339 unique normal processes from these sessions. We use these 339 normal processes for the testing data. A total of 28 abnormal processes are extracted from the whole seven-week of data. Out of these 28 processes, 12 are used for training and remaining 16 are used for testing the detection rate of the approach. In case of a normal process, all of its subsequences should be normal. Therefore in order to test the false positive rate, we take normal subsequences of all the 339 processes together and define coefficient of normal accuracy as ηn =
Nc N
(5)
Training Phase 1. 2. 3. 4. 5.
Collect normal and abnormal processes Calculate the subsequences of these processes of length k (number of attributes) Remove duplicates Construct the decision table with labels normal and abnormal Calculate decision rule set DR using LEM2
Testing Phase 1. For each process P in the testing data do 2. Convert the process into decision table of length k 3. Classify each subsequence using the rule set DR 4. if any of the subsequence is classified as abnormal then P is abnormal 5. 6. else P is normal 7. end do
Fig. 2. Algorithmic representation of the proposed scheme
Where Nc is the total number of normal subsequences correctly classified as normal and N is total normal subsequences used in testing data. In case of abnormal process, as mentioned earlier, not all the subsequences are abnormal. Therefore, we say that an abnormal process is detected is any of its subsequences is labeled as abnormal and we define coefficient of abnormal accuracy as ηa =
Ac A
(6)
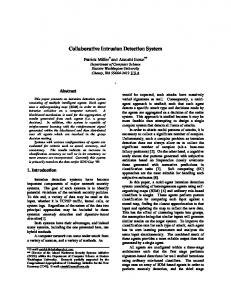
where Ac is total number of processes classified as abnormal and A is total abnormal processes used in testing data. It should be noted that coefficient of normal accuracy ηn is inversely proportional to the false positive rate i.e. higher the value of ηn , lower is the false positive rate. We perform the experiments for different values of the length of the subsequences. For each value, a set of decision rule is calculated. Using this set of rules, the values of ηn and ηa are calculated. Table 3 shows the results of experiments for different values of length of subsequences. It should be pointed out that while doing the above experiment, no default rule is defined i.e. any subsequence, not covered by any of the rules is assigned to a special class undefined and such subsequences are excluded while calculating ηn . The minimum value of ηn is 0.997 i.e. in worst case the false positive rate is 0.003, which implies that per day, there are 339 × 0.003 = 1.017 false alarms. This type of approach is well suitable in situation where there is a second level of check to further analyze the data when we are not certain about the event and tolerance level is high in terms of attacks. But such an approach may delay in decision-making due to lack of high confidence. We, therefore, repeat our series of experiments with a default rule ‘any subsequence, which is not covered by any of the rule is abnormal ’. This approach is well suited in situation wherein tolerance limit for attacks is very low. Thus no event is classified based on further analysis, but based on the rules including the default one i.e. each event is classified on-line. It may also be noted
Length of the Number of the subsesubsequence quences before/after removing duplicates 5 170976/2461 10 167886/5968 15 164801/8441 20 161724/10525 25 158669/12299 30 155640/13939 35 152625/15398 40 149628/16641 45 146654/17666
Number of Value of ηn Value of ηa rules
(ηn +ηa ) 2
929 1702 1828 1797 1707 1789 1810 1762 1699
0.8745 0.8735 0.8745 0.9050 0.8750 0.9300 0.9645 0.9290 0.9630
0.999 0.997 0.999 0.998 1.000 1.000 0.999 0.998 0.998
0.750 0.750 0.750 0.812 0.750 0.860 0.930 0.860 0.928
Table 3. Values of coefficients of normal and abnormal accuracy for different values of subsequence length without a default rule
that while the former approach is a misuse-based, second is a hybrid (anomaly and misuse) approach. Table 4 lists the results of the experiment. The minimum value of ηn is 0.958 i.e. in worst case the false positive rate is 0.042, which implies that per day, there are 339×0.042 = 14.23 false alarms. If we look at figure 3, we
Length of the subsequence 5 10 15 20 25 30 35 40 45
a) Number of Value of ηn Value of ηa (ηn +η 2 rules 929 0.966 0.875 0.9205 1702 0.959 0.812 0.8855 1828 0.954 0.812 0.8830 1797 0.958 0.875 0.9165 1707 0.960 0.875 0.9175 1789 0.958 0.930 0.9440 1810 0.959 0.930 0.9445 1762 0.958 1.000 0.9790 1699 0.959 0.928 0.9435
Table 4. Values of coefficients of normal and abnormal accuracy for different values of subsequence length with a default rule
find that for first set of experiment, the value of ηn is high (i.e. low rate of false positives (first longest bar in the figure)) but detection rate (ηa ) could not reach 1.0. There is a clear distinction between the values of ηn with and without a default rule. This can be understood as we train our system only with 12 abnormal processes, which is much smaller than 606 normal processes used in training. In the second experiment when we included a default rule, we could get detection rate of 1.0 with normal accuracy as high as 0.958. The presence of the default
rule has made the system anomaly-based and from this point of view, a decline in the value of ηn (rise in the rate of false positive) is anticipated as anomalybased systems are known to have a high rate of false positive. An efficient IDS
Fig. 3. Variation between values of coefficients of normal and abnormal accuracy, with and without a default rule
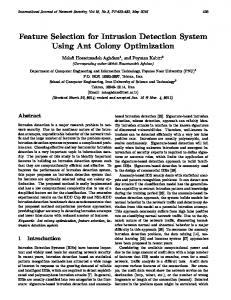
should have high values of ηn and ηa i.e. low false positive rate and high detection rate. The last column of table 3 and table 4 shows the average taken over the values of ηn and ηa . Figure 4 shows that the results obtained with a default rule (hybrid approach) outperform those obtained without a default rule (but not with a significant difference). The bold lines in the figure 4 represent the trends i.e. as we increase the length of subsequence, accuracy also increases and after a length of 35, accuracy ceases to increase. We also observe that though the accuracy increases as we increase the length of the subsequences, it is not a global pattern, particularly in the case of misuse-based approach (without a default rule). Therefore the length of the subsequence can be as short as 5 or as large as 40, we still can detect attacks without matching the whole process. The main point to observe here is that normally anomaly-based systems have good detection rate with a high false positive rate as compared to those based on misuse detection. Our experiments show that anomaly-based IDS can have as low false positive rate as that of a misuse-based system with a very high detection rate. Also once
Fig. 4. Graph between average accuracy and length of subsequence, with and without a default rule.
the rules are computed, there is no further computation involved in classifying the processes. Only the subsequences of a process are matched against the rules for classifications. This makes the system very fast suitable for on-line detection. All the above experiments are conducted using RSES and DIXER tools, developed at the University of Warsaw [5].
6
Conclusion
Rough set theory is applied to many areas as one of many data mining and machine learning techniques. The present paper proposes the use of rough set theory in the area of intrusion detection to make it more suitable as on-line detection system. The main motivation behind using rough set for IDS is that boundary between normal patterns and abnormal ones is not always very sharp which leads to the ambiguity in the decision of the classifiers. Rough set theory is known for its capability to handle such type of data where uncertainty and vagueness is difficult to avoid. In rough sets, most of the operations involve comparing logical operators. Therefore it is also faster in decision making. The resources used in data collection, preprocessing of data and detection of intrusion are directly proportional to the number of features under consideration for each object. Obviously, in order to have a real time response from IDS, number of features should be minimized without affecting the classification power of the system. Rough set theory is capable for of inducing rules that discard redundant
attribute values. Knowledge representation is very simple and learning rate is very fast as compared to other techniques. Our study shows that it is possible to detect an attack by mare looking at some portion of the abnormal process. This reduces the dimension of the data to be processed and thus makes the subsequent computations much faster. The decision rules induced by rough set theory are easy to interpret and thus can be useful in further analyzing the events. We have tested our scheme by conducting experiments on DARPA’98 data. Empirical results, reported in the paper, justify our approach of making use of rough set for intrusion detection. As our future work, we intend to use the concept of incremental learning so that new rules can be learnt without retraining on whole data. We are also analyzing the IF-THEN rules to better understand the relationship among system calls to gain more insight about attacks. Our future work also includes to combine rough set method with other learning techniques, e.g. neural networks to propose a more robust IDS in terms of accuracy.
Acknowledgement The authors are thankful to anonymous reviewers for their useful comments to improve the presentation and quality of the paper. The first author is associated with IDRBT as research fellow and thankful to IDRBT for providing financial assistance and infrastructure to carry out this work. The third author is thankful to MIT, India for its funding.
References 1. An A., Huang Y., Huang X., Cercone N.: Feature Selection with Rough Sets for Web Page Classification. In Dubois D., Grzymala-Busse J.W., Inuiguchi M., and Polkowski L. (eds), Rough Sets and Fuzzy Sets, Springer-Verlag (2004) 2. Bace R., Mell P.: NIST special publication on intrusion detection system. SP80031, NIST, Gaithersburg, MD (2001) 3. Bazan J.: A Comparison of Dynamic and non-Dynamic Rough Set Methods for Extracting Laws from Decision Tables, In: Skowron A., Polkowski L.(ed.), Rough Sets in Knowledge Discovery 1, Physica-Verlag, Heidelberg, (1998) 321–365 4. Bazan J., Nguyen H. S., Nguyen S. H., Synak P., and Wrblewski J.: Rough set algorithms in classification problem. In: Polkowski L., Tsumoto S., Lin T.Y. (eds.), Rough Set Methods and Applications, Physica-Verlag, Heidelberg, (2000) 49-88. 5. Bazan J. G., Szczuka M. S., Wrblewski A.: A New Version of Rough Set Exploration System. In: Proceedings of the Third International Conference on Rough Sets and Current Trends in Computing RSCTC, Malvern, PA, Lecture Notes in Artificial Intelligence vol. 2475, Springer-Verlag (2002) 397-404 Available at: http://logic.mimuw.edu.pl/~rses/ 6. Cabrera J. B. D., Ravichandran B., Mehra R. K.: Detection and classification of intrusions and faults using sequences of system calls. In: ACM SIGMOD Record, Special Issue: Special Section on Data Mining for Intrusion Detection and treat Analysis, Vol. 30(4) (2001) 25-34
7. Cai Z., Guan X., Shao P., Peng Q., Sun G.: A Rough Set Theory Based Method for Anomaly intrusion Detection in Computer Network Systems. J Expert System 20(5) (2003) 251-259 8. Cios K., Pedrycz W., Swiniarski Roman W.: Data mining methods for Knowledge discovery. Kluwer Academic Publisher USA, (2000) 9. DARPA 1998 Data Set, MIT Lincoln Laboratory, available at: http://www.ll.mit.edu/IST/ideval/data/data index.html 10. Delic D., Lenz Hans-J, Neiling M.: Improving the Quality of Association Rule Mining by Means of Rough Sets. In: Proceedings of the First International Workshop on Soft Methods in Probability and Statistics (SMPS’02), Warsaw (poland) (2002) 11. Forrest S., Hofmeyr S. A., Somayaji A.: Computer Immunology. Communications of the ACM, 40(10) (1997) 88-96 12. Forrest S., Hofmeyr S. A., Somayaji A., Longstaff T. A.: A Sense of Self for Unix Processes. In: Proceedings of the 1996 IEEE Symposium on Research in Security and Privacy. Los Alamitos, CA. IEEE Computer Society Press, (1996) 120-128 13. Garvey T., Lunt T. F.: Model-based Intrusion Detection. In: Proceedings of the 14th National Computer Security Conference. (1991) 372-385 14. Grzymala-Busse J. W.: A New Version of the Rule Induction System LERS. Fundamenta Informaticae, 31(1) (1997) 27-39 15. Guan J. W., Bell D. A., Liu D. Y.: The Rough Set Approach to Association Rule Mining. In: Proceedings of the Third IEEE International Conference on Data Mining (ICDM’03), (2003) 16. Helman P., Liepins G.: Statistical Foundations of Audit Trail Analysis for the Detection of Computer Misuse. IEEE Transactions on Software Engineering, 19(9) (1993) 886-901 17. Hofmeyr S. A., Forrest A., Somayaji A.: Intrusion Detection Using Sequences of System Calls. Journal of Computer Security, 6 (1998) 151-180 18. Ilgun K.: USTAT: A Real-Time Intrusion Detection System for UNIX. In: Proceedings of the 1993 IEEE Symposium on Research in Security and Privacy. (1993) 16-28 19. Ilgun K., Kemmerer R. A., Porras P. A.: State Transition Analysis: A Rule-Based Intrusion Detection Approach. IEEE Transactions on Software Engineering 21(3) (1995) 181-199 20. Kemmerer R. A.: NSTAT: A Model-based Real-time Network Intrusion Detection System. Technical Report, Number TRCS97-18, Computer Science, University of California, Santa Barbara. (1998) 21. Kumar S., Spafford E.: A Pattern-Matching Model for Intrusion Detection. In: Proceedings National Computer Security Conference, (1994) 11-21 22. Lee W., Stolfo S., Chan P.: Learning Patterns from Unix Process Execution Traces for Intrusion Detection. In: Proceedings of the AAAI97 workshop on AI methods in Fraud and risk management. AAAI Press. (1997) 50-56 23. Lee W., Stolfo Salvatore J.: Data Mining Approaches for Intrusion Detection. In: Proceedings of the 7th USENIX Security Symposium (SECURITY-98), Usenix Association, January 26-29. (1998) 79-94 24. Lian-hua Z., Guan-hua Z., Lang YU., Jie Z., Ying-cai B.: Intrusion Detection Using Rough Set Classification. Journal of Zhejiang University SCIENCE Vol. 5(9) (2004) 1076-1086 25. Lin T. Y.: Anomaly Detection: A Soft Computing Approach. In: Proceedings of the 1994 Workshop on New Security Paradigms, Little Compton, Rhode Island, United States, IEEE Computer Society Press (1994) 44-53
26. Lingras P.: Rough Set Clustering for Web Mining. In: Proceedings of the IEEE International Conference on Fuzzy Systems 2002, Honolulu, Hawaii (2002) 27. Lunt T. F.: Using Statistics to Track Intruders. In: Proceedings of the Joint Statistical Meetings of the American Statistical Association (1990) 28. Lunt T. F., Tamaru A., Gilham F., Jagannathan R., Neumann P. G., Javitz H. S., Valdes A., Garvey T. D.: A Real-Time Intrusion Detection Expert System (IDES) Technical Report, SRI Computer Science Laboratory (1992) 29. Mukherjee B., Heberlein L. T., Levitt K. N.: Network Intrusion Detection. IEEE Network. 8(3) (1994) 26-41 30. Mukkamala R., Gagnon J., Jajodia S.: Integrating Data Mining Techniques with Intrusion detection Methods. In: Research Advances in database and Information System Security: IFIPTCII, 13th working conference on Database security, July, USA, Kluwer Academic Publishers (2000) 31. Pawlak Z.: Rough sets: Theoretical aspects of reasoning about data. Kluwer Academic Publishers, Dordrecht (1991) 32. Porras P. A.: STAT – A State Transition Analysis Tool For Intrusion Detection. Technical Report, Number TRCS93-25, Computer Science. University of California, Santa Barbara (1993) 33. Rawat S., Gulati V. P., Pujari A. K.: Frequecy And Ordering Based Similarity Measure For Host Based Intrusion Detection. J Information Management and Computer Security. 12(5), Emerald Press (2004) 411-421 34. Sebring M. M., Shellhouse E., Hanna M. E., Whitehurst R. A.: Expert System in Intrusion Detection: A Case Study. In: Proceedings of the 11th National Computer Security Conference, (1988) 74-81 35. Stefanowski J.: On Rough Set Based Approaches to Induction of Decision Rules. In: Polkowski L, Skowron A (eds) Rough Sets in Data Mining and Knowledge Discovery, vol 1. Physica Verlag, Heidelberg. (1998) 500-529 36. Tandon G., Chan P.: Learning Rules from System Calls Arguments and Sequences for Anomaly Detection. In: ICDM Workshop on Data Mining for Computer Security (DMSEC), Melbourne, FL. (2003) 20-29 37. Warrender C., Forrest S., Pearlmutter B.: Detecting Intrusions Using System Calls: Alternative Data Modelss. In: IEEE Symposium on Security and Privacy (1999) 38. Wespi A., Dacier M., Debar H.: Intrusion Detection Using Variable-Length Audit Trail Patter. In : LNCS # 1907, RAID 2000. Toulouse, France. (2000) 110-129 39. Zhu D., Premkumar G., Zhang X., Chu Chao-Hsien: Data mining for Network Intrusion Detection: A comparison of alternative methods. J. Decision Sciences 32(4) (2001) 635-660