A FAST LAYOUT ALGORITHM FOR VISUAL VIDEO SUMMARIES Andreas Girgensohn FX Palo Alto Laboratory, Inc. 3400 Hillview Avenue, Palo Alto, CA 94304, USA
[email protected] ABSTRACT
2. RELATED WORK
We created an improved layout algorithm for automatically generating visual video summaries reminiscent of comic book pages. The summaries are comprised of images from the video that are sized according to their importance. The algorithm performs a global optimization with respect to a layout cost function that encompasses features such as the number of resized images and the amount of whitespace in the presentation. The algorithm creates summaries that: always fit exactly into the requested area, are varied by containing few rows with images of the same size, and have little whitespace at the end of the last row. The layout algorithm is fast enough to allow the interactive resizing of the summaries and the subsequent generation of a new layout.
A number of approaches have been used to generate visually pleasing summaries of videos. Some approaches uses aesthetic measures to guide the layout process. Coleman and Parker [2] describe aesthetic measures for graph layout. Fogarty et al. [4] use aesthetic measures to create decorative and informative collages of images. Both approaches use simulated annealing algorithms to improve the layouts. Such algorithms use random displacements to find local minima but can be pushed to different minima with large enough perturbations. In contrast to those approaches, our layout algorithm constrains the search space and reuses partial results to perform a global optimization of the layout in a small amount of time. Yeo and Yeung [9] create video summaries based on a dominance score. They place images of different sizes that are integer multiples of a base size in a grid. They use a 4x4 grid and an algorithm that selects among a small number of patterns (eight patterns are shown in the paper) based on the distribution of dominance scores. Their algorithm does not scale up to the large layouts discussed in this paper. Taniguchi et al. [7] describe a 2-D packing of “panoramas” for video browsing. The images produced by their approach have different shapes and sizes so that packing without whitespace is impossible. Like our layout algorithm, their packing approach keeps the images in a temporal left-to-right, top-to-bottom order. They describe a fast algorithm for packing images in order that uses a local optimization for each image rather than a global optimization that minimizes the overall amount of whitespace.
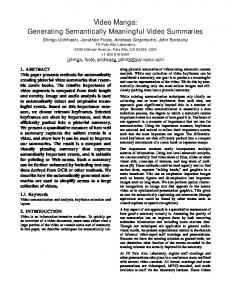
1. INTRODUCTION Visual summaries of videos composed of images can provide quick overviews of the videos and entry points into them. For example, Christel at al. [1] present filmstrips that are adjusted based on user queries. Our goal is to produce a meaningful, concise, and visually pleasing representation of the video. We do this by automatically choosing only the most salient images and efficiently packing them into a pictorial summary. Our summaries are based on the Manga layout algorithm [8] that uses an importance measure representing video segment length and repetitiveness to select keyframes and to determine their initial size. A row-packing algorithm places those keyframes in a grid by resizing some of them to produce a layout reminiscent of a Japanese Manga comic book. Manga visual video summaries have been used in several applications, most recently as part of the ACM Multimedia 2002 Video Program CD ROM. Unfortunately, the original algorithm cannot produce summaries of a specified height. It is also limited to three different image sizes and generates summaries that look too uniform because of groups of images of the same size. We developed a new algorithm that overcomes the limitations of the original algorithm. The new algorithm represents resized images and the amount of empty space as a layout score and performs a global optimization of that score. Additional requirements such as completely filling the presentation area are satisfied when determining the layout. We improved the initial new algorithm to enable large summaries to be resized in real-time for an interactive browsing user experience. Figure 1 shows a visual summary created by our algorithm of a video from the MPEG-7 content set, Science Eye [6]. In the next section, we compare our approach of producing an aesthetically pleasing layout with several other approaches. Next, we describe the layout algorithm, compare it to the original algorithm, and discuss speed-ups. In conclusion, we discuss further improvements and applications for our layout algorithm.
Figure 1: Manga Video Summary of “Science Eye”
The general packing problem is well-studied in the operations research field [3]. A typical problem places rectangular pieces into a container of given width and undetermined height to minimize the required height. Algorithms solving that problem are not applicable here because they do not preserve the order of the pieces, do not run in interactive time, and cannot resize the pieces.
3. MANGA LAYOUT ALGORITHM The original Manga algorithm [8] uses a grid to generate a visual summary. Images are assigned three different sizes based on their importance determined from the length and uniqueness of the corresponding video segment. The images are then packed in temporal order into grid rows that can vary in height from the smallest to the largest image size and are required to contain at least one image of the full height. For each row, the best height is selected and all whitespace is filled by resizing as few images as possible. A layout score makes changing images by several sizes very expensive because that would distort the importance too much. Unfortunately, there are several shortcomings with the original algorithm. First, the height of the presentation area cannot be specified, only the width. Second, only three image sizes can be used for a summary. Third, layouts often look too uniform because of groups of images of the same size. Fourth, the bottom row often contains much blank space. Finally, for large layouts, the algorithm is slow. To address these issues, we developed a new algorithm that globally optimizes the layout rather than optimizing individual rows. This is similar to the difference between early text formatting algorithms that optimize one line at a time and the TEX algorithm that optimizes the whitespace in a whole paragraph [5].
3.1. New Layout Algorithm Just like the original algorithm, the new algorithm places images in rows of a grid. Importance scores are mapped to integer sizes between one and a maximum (usually three or four). The new algorithm uses empirically determined percentages for the different image sizes.1 Using four different image sizes produces the best results whereas layouts with five and more sizes do not fit well into smaller grids (see Figure 2 for an example). The algorithm represents resized images and the amount of empty space in a variant of the original layout score applied to the entire layout. Thus, the layout algorithm becomes an optimization problem to minimize the overall layout score. Additional requirements such as completely filling the presentation area are taken into consideration when determining the layout. When resizing images, the size differences ∆i for the images i are integers ranging from zero to one less than the maximum image size. Given the size differences and the number of empty cells in the bottom row e, the layout score stot is: ∆i – 1 ° 100 ;( ∆ i > 0 ) si = ® ° 0 ;( ∆ i = 0 ) ¯
s tot = e + ¦ s i
The new algorithm creates partial layouts one row at a time starting with the bottom row of the summary because that is the only row that may be only partially filled (similar to the last line of a text paragraph). Partial layouts are extended by adding all possible combinations for selecting the height of the next row and filling it with images. By always processing the partial layout with 1
Image size percentages: 3: 20%, 2: 40%, 1: 40% and 4: 10%, 3: 20%, 2: 35%, 1: 35%.
Figure 2: 12x10 summary with five image sizes. the lowest score (best-first traversal of the tree of all possible layouts), the best complete layout is found early. To speed up the algorithm, we use a more easily computable lower bound for the layout score of a row rather than actually placing the images. We consider all combinations of image size counts that would fit. For example, a row with a 6x3 grid can hold 2, 7, and 10 images, respectively (see Figure 3). The lower bound is computed from the minimum number of images that have to be resized independent of their order, determined by comparing the counts of possible and requested sizes. The size counts are precomputed for the possible row dimensions. Using these precomputed numbers, partial layouts can be discarded if they have an insufficient number of unused images to fill the remaining rows. Partial layouts that fill all rows become candidates for the final layout. For those candidates, the images are actually placed in the rows to determine the final layout score. The best possible solution is found when the score of the best final candidate is no higher than the score of the best remaining partial layout. Because all partial layout scores are lower bounds, none of the remaining partial layout can improve on that solution. For a further speed-up, one can accept a good candidate whose score is no more than twice that of the best partial layout. That approach does not find the best but a satisfying layout.
3.2. Comparison with Original Algorithm Figures 4 and 5 show layouts produced from the same sequence of importance scores. The size changes are indicated by numbers in the centers of the images. The layouts shown are representative of 500,000 layouts produced from randomly generated importance scores with three different image sizes with respect to the layout score and the proportion of rows filled uniformly with images of the same size. The layouts with four different sizes use the same importance scores but fewer images due to the larger images. Table 1 compares the results of the new layout algorithm to two variants of the original algorithm. The averages are computed from 10,000 randomly selected importance score sequences for each of 35 different layout sizes from 6x4 to 12x14. The first variant (“Original 1x”) on average fills 84% of the requested height because it has the tendency to reduce more images in size than to increase them. It also varies the height of summaries for different videos (standard deviation 1.1) but produces slightly better results than the new algorithm with respect to resized images and uniform rows, i.e., rows containing only images of one size. When tripling the score for reducing image sizes (“Original 3x”), the original algorithm on average fills the requested height but the percentage of uniform rows increases. The deployed version of
Figure 3: Image sizes for 6x3 row.
(a) original
(a) original
(b) 3 sizes new (c) 4 sizes new Figure 4: Representative layouts for 9x7 summaries
(b) 3 sizes new Figure 5: Representative layouts for 12x10 summaries
Table 2. Times in seconds for different layout algorithms2
Table 1. Comparison of averages for original and new layout Actual vs. requested height Height std. dev. Uniform rows Empty cells in bottom row Resize 1 size Resize 2 sizes
Original 1x Original 3x 84% 101% 1.1 1.2 30.0% 41.4% 4.6 5.0 38.7% 39.7% 0.10% 0.13%
New 100% 0 31.7% 1.9 40.5% 0.06%
the original algorithm [8] penalizes shrinking images with a factor of 10 which produces worse results than either of the two examined variants (height 109%; uniform 47%; resize 1 size 43%). The variants of the original algorithm leave more empty cells in the bottom row than the new algorithm (4.6 and 5.0 vs. 1.9). The new algorithm always produces layouts with a lower score even in cases where the original algorithm resizes fewer images. The relative weight of resized images and empty cells can be adjusted in the layout score. The new algorithm already has fewer uniform rows than the original algorithm, especially when using four image sizes, but we plan to express uniform rows in the layout score after we have experimentally determined a good balance between avoiding them and not resizing many images.
4. TIME AND SPACE OPTIMIZATIONS FOR THE NEW LAYOUT ALGORITHM Layout sizes up to 22x22 can be produced for a computer screen with a resolution of 1600x1200, a base image size of 64x48, and 8-pixel margins between images. The initial new layout algorithm is unsuitable for laying out such large summary because it has an exponential time complexity and would take years (time complexity O(1.5n) for the number of images).1 We addressed this issue by developing improvements such that layouts can be computed interactively for full-screen presentations (see Table 2). 1
Estimated by linear regression of the logarithms of times for different large layout sizes. At O(1.5n), the layout of 100 images take 6E8 times as long as that of 50 images.
(c) 4 sizes new
12x10 good best Original Manga 0.03 Initial new Manga 39 49 Fewer combinations 0.12 0.51 Building blocks 0.08 0.16 Buckets of solutions 0.05 0.14 Caching scores 0.02 0.03 Delayed object creation 0.02 0.03 No lower bounds 0.02 0.03
16x14 good best 0.57 170 d 190 d 5.4 620 0.08 1.0 0.04 0.87 0.07 0.14 0.03 0.09 0.11 0.16
20x18 good best 200 6E7 d 1E8 d 1200 45 d 15 10100 1.4 250 0.51 5.8 0.12 3.3 1.2 1.8
Fewer combinations of image sizes The initial new algorithm is slow because it combines all possible sizes for each image and checks the specified counts for each combination. However, a speed-up of the algorithm can be obtained by only enumerating those combinations that produce the desired image size totals. For example, when requesting one size 2 image and two size 1 images, three combinations are valid (112, 121, 211). In addition, the initial algorithm enumerates and discards five combinations (111, 122, 212, 221, 222). For three different image sizes and counts c1 through c3, the following number of combinations have to be tested:2 initial: 3
( c2 + c2 + c3 )
( c + c + c )!
1 2 3 fewer combinations: -----------------------------------
c 1! + c 2! + c 3!
For 12 images, this decreases the number of combinations by a factor of 15 to 530,000 depending on how balanced the counts are. Table 2 shows the significant savings of this approach. However, the estimated time complexity only goes down to O(1.3n) so that larger layouts still require days.3 2
Times measured with Java Standard Edition 1.3.1_02 under Windows 2000 on an AMD Athlon 1.4 GHz with 768 MB memory. Times in italics represent estimated number of days. 3 With a time complexity of O(1.3n), the layout of 100 images take 5E5 times as long as that of 50 images.
layouts so that determining a good solution takes longer than with previous approaches. Only computing the best solution is sped up by this approach. The memory footprint is much smaller than with delayed object creation (3 MB instead of 125 MB for the best 22x20 layout). Even when good layouts are sufficient, using the actual scores and taking more time is still preferable in situations with limited memory such as in a Java applet.
5. CONCLUSIONS Figure 6: Building blocks for four image sizes.
Building blocks combining images Instead of combining image sizes that can fill a row, one can combine building blocks. Building blocks are image combinations of the height of a row that cannot be split by drawing a vertical line through them without cutting through an image (see Figure 6). Because of the smaller number of components to consider, the precomputation of image size counts for different row configurations is faster. Also, the final layout score can be determined by permuting building blocks instead of actually placing images. This makes creating good layouts faster than with the original Manga algorithm.
Buckets of partial solutions All algorithms described so far conduct the best first traversal through the solution tree by maintaining an ordered list of partial layouts. In each step, the first partial layout is removed from the list. Then, all possible expansions for it are computed. Next, the list of expanded layouts is sorted and merged with the list of partial layouts. For a large number of partial layouts, maintaining the ordered list is expensive. Instead, we keep a bucket of partial solutions for each different layout score. This improvement provides significant gains for larger summaries (see “20x18” in Table 2).
Caching scores for row-configuration/image pairs A row configuration is represented by a collection of building blocks. A row configuration that is filled starting with a particular image always receives the same layout score because it is deterministic which permutation of building blocks produces the lowest score for the same sequence of images. Rather than computing that score several times, it is associated with the pair of row configuration and start image and retrieved every time it is needed. This makes finding a good layout only slightly faster but it speeds up finding the best layout significantly.
Delayed object creation For large layouts, the creation of millions of objects representing partial layouts impacts speed and, more importantly, the memory footprint. Rather than creating the objects when a partial layout is expanded to the next row, pairs of partial layouts and row configurations are stored in the buckets of partial solutions. Only when a partial solution is processed further, the object representing it is actually created. This improvement only generates modest savings in time but the memory footprint is reduced significantly (17 MB instead of 41 MB for the best 20x18 layout and 125 MB instead of 337 MB for the best 22x20 layout).
Actual scores instead of lower bounds When caching scores, it becomes feasible to use the actual score instead of the lower bound when selecting partial layouts. However, more scores have to be cached than really needed for final
We described a new layout algorithm for visual video summaries that can combine a number of evaluation criteria such as number of images resized or empty space in the presentation to find an optimal solution. Unlike the predecessor layout algorithm that optimizes individual rows, the new algorithm performs a global optimization of the entire layout. After some refinements, the new algorithm is fast enough to interactively compute layouts for typical presentation sizes. Thus, the user experience of visual video summaries is enhanced. Furthermore, the algorithm improves on prior work by producing more visually pleasing summaries that can be configured in a number of dimensions. We are currently working on producing even more interesting video summaries that better preserve the size of the most important images and that show the center portion of some images instead of maintaining their aspect ratios. We also explore applying the algorithm to user interface component layout.
6. REFERENCES [1] M.G. Christel, A.G. Hauptman, A.S. Warmack, and S.A. Crosby. Adjustable Filmstrips and Skims as Abstractions for a Digital Video Library. IEEE Advances in Digital Libraries Conference, pp. 98-103, 1999. [2] M.K. Coleman, D.S. Parker. Aesthetics-based Graph Layout for Human Consumption. Software—Practice and Experience, Vol. 26(1), pp. 1-25, 1996. [3] K.A. Dowsland, W.B. Dowsland. Packing Problems. European Journal of Operational Research, Vol. 56, pp. 2-14, 1992. [4] J. Fogarty, J. Forlizzi, S.E. Hudson. Aesthetic Information Collages: Generating Decorative Displays that Contain Information. UIST’01, pp. 141-150, 2001. [5] D.E. Knuth. Digital Typography. University of Chicago Press, 1998. [6] MPEG Requirements Group. Description of MPEG-7 Content Set, Doc. ISO/MPEG N2467, 1998. [7] Y. Taniguchi, A. Akutsu, Y. Tonomura. PanoramaExcerpts: Extracting and Packing Panoramas for Video Browsing. Proc ACM Multimedia 97, pp. 427-436, 1997. [8] S. Uchihashi, J. Foote, A. Girgensohn, and J. Boreczky. Video Manga: Generating Semantically Meaningful Video Summaries. In Proceedings ACM Multimedia, ACM Press, pp. 383-392, 1999. [9] M.M. Yeung, B.-L. Yeo. Video Visualization of Compact Presentation and Fast Browsing of Pictorial Content. IEEE Transactions on Circuits and Systems for Video Technology, Vol. 7(5), pp. 771-785, 1997.