A Fast Method for Generating Self-Similar Network Traffic∗ S ERGIO L EDESMA1
AND
D ERONG L IU2
1. Department of Electrical and Computer Engineering Stevens Institute of Technology, Hoboken, NJ 07030, U. S. A. Tel. No.: (201) 216-5050, Fax: (201) 216-8246, Email:
[email protected] 2. Department of Electrical Engineering and Computer Science University of Illinois, Chicago, IL 60607, U. S. A. Tel. No.: (312) 355-4475, Fax: (312) 413-0024, Email:
[email protected]
Abstract
1 Introduction
Recently, self-similar/fractal traffic models have been shown to be applicable to a variety of network traffic. This gives rise to new and challenging problems for statistical inference, stochastic modeling and synthetic traffic generation. The present paper focuses on self-similar traffic generation. Network traffic modeling studies the generation of synthetic sequences. The generated sequences must have similar features to the measured traffic. Exact methods for generating self-similar sequences from the fractional Gaussian noise (FGN) and the fractional autoregressive integrated moving average process models are not appropriate for long traces.
Data traffic is the main component of computer communication systems, and traffic models are of crucial importance for assessing their performance [25]. In practice, stochastic models of traffic streams are relevant to network traffic engineering and performance analysis, and they are widely used in predicting system performance. The basic systems, of which traffic is a major ingredient, are queueing systems. Traditional traffic models have often been devised and chosen for the analytical tractability they induce on the corresponding queueing systems. While originally the validity and efficacy of models for modern high-speed network traffic were difficult to establish due to the unavailability of empirical data, very large sets of traffic measurements from working networks have become available.
Our main objective in the present paper is to improve the efficiency of the method presented by Paxson [20] for synthesizing self-similar sample paths. Paxson’s method uses a fast, approximate synthesis for the power spectrum of the FGN and uses the inverse Fourier transform to obtain the time-domain sequences. We demonstrate that a linear approximation can be used to determine the power spectrum of the FGN. This linear approximation reduces the complexity of the computation without compromising the accuracy in synthesizing the power spectrum of the FGN. Our results show that long traces can be generated in much less time. To compare our method with existing ones, we will measure the running time in generating long and short sample paths from the FGN. We will also conduct experiments to show that our method can generate self-similar traffic for specified Hurst parameters with high accuracy. ∗
This work was supported in part by the National Science Foundation under Grant ECS-9996428 and in part by Blonder Broadcasting Corporation, Morganville, New Jersey.
Recently, the notion of self-similarity has been shown to apply to a variety of traffic including wide area network (WAN) traffic [21], local area network (LAN) traffic [15], [27], video frame data generated by variable-bit-rate (VBR) encoders [5], [12], and World Wide Web (WWW) transfers [6]. The studies in [5], [6], [12], [15], [21], [27] provide inspiration for an investigation of a new type of traffic models. In particular, it is encouraged to use stochastic processes which possess scaling properties and which have distributions with infinite moments. Self-similar structures, and hence fractal processes, have been employed for this purpose. The study of [27] and others have concerned with whether it is possible to statistically distinguish between measured network traffic and model generated traffic. Actual traffic exhibits correlations over a wide range of time span (i.e., long-range dependence), while tradi-
tional traffic models typically focus on a very limited range of time spans and are thus short-range dependent in nature. In stochastic modeling, self-similar processes or their increment processes are often used in situations where it is required to model the presence of longrange dependence (cf. [2], [3]). There are two mathematical models used often to model the self-similarity effect: the fractional Gaussian noise (FGN) and the Fractional Autoregressive Integrated Moving Average process. We will investigate in this paper the use of the FGN for generating self-similar network traffic. Our goal is to develop a fast method in generating the spectral density function for the FGN so that the FGN can be generated by taking the inverse Fourier transform. The present paper is organized as follows. In Section 2, we develop a method using a linear approximation to calculate the power spectrum for the FGN. In Section 3, we compare the method developed herein with existing methods for generating selfsimilar traffic in terms of the computation time. We will also show the accuracy of the present approach in generating self-similar traffic with given Hurst parameters. Finally, in Section 4, we conclude our paper with a few pertinent remarks.
2
Computation of the FGN Power Spectrum Using a Linear Approximation
For an introduction on self-similar processes and the fractional Gaussian noise (FGN), please refer to [2], [4], [5], [15], [17], [18], [20], and [26]. In the present paper, we adopt the notation in [2], where the power spectrum of the FGN is given by [
−2H−1
f (λ; H) = A(λ; H) |λ|
]
+ B(λ; H)
(1)
for 0 < H < 1 and −π ≤ λ ≤ π, where A(λ; H) = 2 sin(πH) Γ(2H + 1)(1 − cos λ) and B(λ; H) =
∞ ∑
[(2πk +λ)−2H−1 +(2πk −λ)−2H−1 ]
k=1
(2)
In the above expression for A(λ; H), Γ(·) indicates the Gamma function. Simple calculations show that the FGN is exactly second-order self-similar with self-similarity parameter H, as long as 0.5 < H < 1 [8], [15]. There are several existing methods for synthesizing sample paths for self-similar processes including the FGN. The existing methods include alternating renewal process [27], autoregressive processes [15], [26], chaotic maps [9], fractional autoregressive integrated moving average process [1], [3], [5], [11], [13], fast Fourier transform (FFT) [20], fractal renewal process [16], queueing processes [15], [21], [26], random midpoint displacement [14], spatial renewal process [24], quasi-self-similar Markov modulated rate process [19], and wavelet transformation [10]. An approach is proposed in [20] for generating the FGN using FFT. Suppose that f (λ; H), the power spectrum of the FGN process in (1) is known. Then it is possible to construct a sequence of complex numbers corresponding to this power spectrum (this sequence is in a sense a frequency-domain sample path). An inverse Fourier transform can be used to obtain the time-domain counterpart sequence. The main difficulty with this approach lies in accurately computing f (λ; H). Another problem is to find a frequencydomain sample path that truly corresponds to the FGN power spectrum. In [20], an approximation is performed using the midpoint value of two integrals and retaining some terms of the infinite summation that is used to calculate the FGN power spectrum. As we can see from equation (2), the calculation of the power spectrum of the FGN implies the computation of an infinite summation. In order to find a fast and accurate way to approximate equation (2), we need to analyze the terms in the summation. Each term in equation (2) is a function of the index of the summation, k, and the discrete frequency, λ. Usually, λ takes discrete values in the range from 0 to π. The number of frequency samples depends on the length of the trace required. The best way to evaluate the summation consists in exploiting the speed improvement of vector operations offered by the programming languages. In this case, λ is a vector which contains the different discrete frequency values. Consider the first term in (2), (2πk + λ)−2H−1 . This term decreases as k goes to infinity. Actually,
for large values of k this term remains approximately constant for all the values of λ in the range 0 ≤ λ ≤ π. Table 1 shows the relative errors between (2πk + λ)−2H−1 and its linear approximation in the form of pλ + q for several values of k and λ, where p and q are determined by minimizing a mean-squared error. We can see from the table that the error is much larger for k = 1 than that for k > 1. As the value of k increases, (2πk + λ)−2H−1 is approximately a linear function of λ. For k ≥ 3 the deviation is very small. Table 2 shows the relative errors between the second term in (2), (2πk − λ)−2H−1 , and its linear approximation. We can draw similar conclusions to the above from Table 2. Table 1: Deviation of (2πk + λ)−2H−1 from linearity (H = 0.75). λ 0.314 0.628 0.943 1.257 1.571 1.885 2.199 2.513 2.827 π
k=1 6.03% 1.64% −1.87% −4.36% −5.66% −5.61% −4.06% −0.81% 4.31% 11.48%
k=2 2.14% 0.65% −0.51% −1.31% −1.72% −1.72% −1.26% −0.33% 1.10% 3.06%
k=3 1.09% 0.34% −0.23% −0.62% −0.82% −0.82% −0.61% −0.17% 0.49% 1.39%
k=4 0.65% 0.21% −0.13% −0.36% −0.48% −0.48% −0.36% −0.11% 0.28% 0.79%
Table 2: Deviation of (2πk − λ)−2H−1 from linearity (H = 0.75). λ 0.314 0.628 0.943 1.257 1.571 1.885 2.199 2.513 2.827 π
k=1 49.21% 19.70% −0.75% −13.35% −19.24% −19.51% −15.23% −7.37% 3.13% 15.4%
k=2 5.68% 2.08% −0.52% −2.19% −3.01% −3.03% −2.32% −0.94% 1.03% 3.54%
k=3 2.07% 0.37% −0.24% −0.88% −1.19% −1.19% −0.91% −0.35% 0.47% 1.53%
k=4 1.06% 0.37% −0.14% −0.47% −0.63% −0.63% −0.48% −0.18% 0.27% 0.85%
Equation (2) requires a lot of computation and its convergence depends on the value of H. Because (2) is an infinite summation, we use Bn to indicate that partial summation for k = 1, 2, · · · , n is used in the evaluation of (2). For example, B10 means
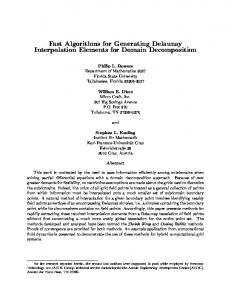
that we use 10 terms to evaluate the summation (i.e., k = 1, 2, · · · , 10). Throughout this paper, we estimate the value of equation (2) with the remaining error less than 0.0001%. Fortunately, the first few terms of equation (2) are big compared to the terms for large values of k. This is clearly illustrated in Figure 1. For H = 0.9, the summation for k = 1 and 2, i.e., B2 , represent more than 93% of B. For H = 0.6, B2 represents almost 85% of B. In Figure 1, the plots were obtained using λ = π/2. For other values of λ, very similar results are obtained. As mentioned earlier, each term in (2) can be approximated using a linear function of λ. Because the addition of linear functions is also a linear function, it is possible to use a linear approximation to estimate the sum of the terms in equation (2). The illustration in Tables 1 and 2 suggests that a better approximation using a linear function for B in (2) should not include the terms for k = 1 and k = 2. A simple analysis shows that B2:∞ is almost a linear function of λ. The index 2: ∞ means that the summation was performed starting with k = 2 and ending at a k that the remaining error in the computation of B2:∞ is less than 0.0001%. For 0.7 < H < 1 the linear approximation does a better job than for 0.5 < H < 0.7. On the other hand, B3:∞ can be perfectly approximated, for any H, using a linear function of λ, as illustrated in Figure 2. In the sequel, we will develop a method for using a linear approximation to evaluate equation (2). Using (1) to get the power spectrum implies the computation of the infinite summation as in (2). We will write (2) as 2 [ ∑
B(λ; H) =
]
(2πk+λ)−2H−1 + (2πk−λ)−2H−1
k=1
+B3:∞ where B3:∞ =
∞ [ ∑
(2πk+λ)−2H−1 +(2πk−λ)−2H−1
]
k=3
In order to approximate B3:∞ using a linear function of λ, we define D(λ; H) D(λ; H) = pλ + q
(3)
To show the dependence of p and q on H, we should express them as p(H) and q(H), respectively. Nevertheless, to avoid using cumbersome notation, we
will use p and q without forgetting their dependence on H. We will determine p and q through optimization in the mean-squared error sense. We define ε, the mean-squared error as ∫
π
ε= 0
[B3:∞ (λ; H) − D(λ; H)]2 dλ
The minimum value of ε will be obtained when ∂ε/∂p = 0 and ∂ε/∂q = 0. Hence, using Leibnitz’s rule [22] to derive under the integral sign, we get ∫
π
2 0
π 0
]
λ(2πk − λ)−2H−1 dλ =
∞ [ ∑
(2πk +λ)−2H−1 +(2πk −λ)−2H−1
G(H) =
∫
π
+ 0
k=3
(
− (2πk + π)−2H+1 + (2πk − π)−2H+1
∫
∫
π
(2πk+λ)−2H−1 dλ+ ∫
=
π
(pλ + q)dλ
]
π
(9)
6 12 F (H) + 3 G(H) 2 π π
(10)
6 4 F (H) − 2 G(H) π π
(11)
p=−
π
(pλ + q)dλ
(5)
[ ] ∞ ∑ (2πk − π)−2H − (2πk + π)−2H
2H
(6) We proceed in the same way as before to calculate ∂ε/∂p. By setting ∂ε/∂p = 0, we get
k=3
2πk 2πk + + ln(2πk + π) 2πk + π 2πk − π
q=
where F (H) is defined as
0
∞ [ ∑
(2πk−λ)−2H−1 dλ
π2 p + πq = F (H) 2
π
(8)
Solving for p and q in equations (5) and (7), we get
0
which implies that
∞ [∫ ∑
/(2H − 1)
]
0
k=3
]
+ ln(2πk − π) − 2 − 2 ln(2πk)
0
0
)
We note that (8) is for the case when H > 0.5. For comparison studies to be performed in Section 3, we also derived G(H) for H = 0.5 as
k=3
0
(2πk − λ)−2H−1 dλ + 2
F (H) =
(2πk)(2πk + π)−2H )
G(H) =
]
(7)
+(2πk)(2πk − π)−2H − 2(2πk)−2H+1 /2H
−2(2πk)
By setting ∂ε/∂q = 0, we get ∞ [∫ ∑
∞ [( ∑
−2H+1
(2πk + λ)−2H−1 dλ
0
k=3
−(pλ + q) (−1)dλ
∂ε = −2 ∂q k=3
(pλ2 + qλ)dλ
where G(H) is defined as
]
∞ [∫ π ∑
π
π2 π3 p + q = G(H) 3 2
k=3
The summation inside the integral defines a function which is continuous on the closed and bounded interval [0, π]. We can interchange the order of the summation and the integral [7] to obtain
∫
After some manipulations, we get
(4)
The integral goes from 0 to π because we need to minimize the error only in that interval.
∂ε = ∂q
∫
+
λ(2πk + λ)−2H−1 dλ
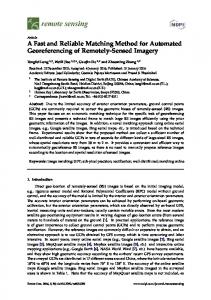
Equations (10) and (11) are the core of our approximation. Figures 3 and 4 show plots of the two functions (pn and qn ) versus the number of terms used in the summation (n) for several values of H. The slope of the linear approximation, p, converges very fast, and a value of n = 20 seems to be sufficient. As illustrated in Figure 4, q does not converge that fast, a minimum value of n = 200 is required. We also performed experiments for qn using n = 400, which resulted in no significant improvement using n = 400. We note that in the computation of (1) and (2) for the power spectrum of the FGN, infinite summations are required for every value of λ. In the present approach, using the linear approximation for B3:∞ as in (3), we do not need to perform infinite summations
for any λ. Instead, we only need to perform two infinite summations as in (6) and (8)/(9) for the computation of parameters (p, q) in the linear approximation. This is a significant computational reduction. We will perform a comparison study of the present approach with several exiting results in the next section.
3
Simulation Studies
In this section, we will conduct simulation studies to compare the computation speed in generating selfsimilar network traffic based on the fractional autoregressive integrated moving average (F-ARIMA) and FGN processes, and the accuracy in the traffic generated with given Hurst parameters. Table 3 shows the running time of several algorithms for generating self-similar sequences. A Sun SPARC 20 workstation and Matlab were used to run our algorithms. The second column of Table 3 shows the running time of our approach based on the linear approximation. This table also shows the running time using Paxson’s approximation [20]. In our approach and the approach of [20], an inverse Fourier transform is performed to generate the time sequence for self-similar traffic. To calculate the FGN power spectrum, Paxson’s method requires more than double vector operations than our method and hence, it requires more computation time and more memory space than our method. The rest of Table 3 shows the running time of the random midpoint displacement method (RMD) for generating the fractional Brownian motion [14], the spatial renewal process (SRP) method for generating the FGN [24], and Hosking’s method for generating the F-ARIMA process [11]. Each method has advantages and disadvantages. Hosking’s method is the slowest one, while our method is the fastest of all the methods in Table 3. Table 3: Running time in seconds for generating self-similar sequences. Length 65,536 131,072 262,144 524,288 1,048,576 2,097,152
Our approach 5 10 22 45 94 259
Paxson 7 12 24 48 260 659
Length 65,536 131,072 262,144 524,288 1,048,576 2,097,152
Table 3: Continued. RMD SRP Hosking 32 1,306 5,826 66 4,575 24,152 130 16,510 104,214 262 62,213 440,361 530 245,140 too long 1,100 949, 172 too long
There are three frequently used methods for estimating the Hurst parameter for a given self-similar process [5]: (1) time-domain analysis based on the R/S statistics; (2) frequency-domain analysis based on the periodogram; and (3) analysis of variances of the aggregate processes, i.e., the variance-time plot method. To demonstrate the quality of our approach in generating self-similar traffic with given Hurst parameters, we performed simulation as shown in Table 4. For each value of H in Table 4, we generated ten sequences of length 30, 000. We estimated the value of H using the variance-time plot method, which provides in our simulation the most consistent results among the above three methods. The results in the table show the excellent accuracy of our approach in generating self-similar traffic with given Hurst parameters. Note that we used H = 0.5 in our simulation shown in Table 4 for the purpose of comparison with [20] and others (where H = 0.5 was used in comparison simulation studies). Table 4: Estimation of the Hurst parameter using the variance-time method. H =0.5 H =0.6 H =0.7 H =0.8 H =0.9 0.486 0.607 0.704 0.776 0.866 0.499 0.596 0.685 0.788 0.864 0.508 0.600 0.689 0.798 0.874 0.496 0.599 0.703 0.804 0.860 0.495 0.587 0.697 0.793 0.855 0.489 0.589 0.692 0.796 0.867 0.498 0.592 0.695 0.788 0.865 0.504 0.593 0.713 0.768 0.876 0.509 0.592 0.684 0.767 0.891 0.506 0.598 0.700 0.810 0.862 The method based on the alternating renewal process [27] requires the multiplexing of an infinite number of independent process. This is one of its disadvantages, and a balance between speed and quality of the generated sequence must be negotiated. The
SRP method has the same disadvantage. It requires a minimum aggregation level of ten. The running times shown in Table 3, for the SRP model, were calculated using an aggregation of ten independent processes and a piecewise function of five linear functions to approximate the probability distribution. The quality of the generated traffic using the SRP is not satisfactory, and the value of the Hurst parameter does not remain constant for several levels of aggregation, which agrees with the findings in [24]. The RMD method is one of the fastest, as shown in Table 3. Nevertheless, the Hurst parameters of the generated sample estimated using the variancetime plot method differ from the target values. The FFT method, using Paxson’s approximation and the present approach based on a linear approximation, generates high quality self-similar sequences, where the Hurst parameters of the samples agree with the target values. The Hurst parameters remain constant for several levels of aggregation in a variance-time plot. It is worthwhile to say that using the present linear approximation to calculate the FGN power spectrum allows us to quickly generate high quality selfsimilar sequences.
4
Conclusions
Long-range dependence is often encountered in practice, not only in hydrology and geophysics, but in all fields of statistical applications including traffic engineering. If not taken into account, it can completely invalidate statistical inference [1], [5]. For many situations, new statistical methods as well as properties of classical techniques are sufficiently known nowadays to be used in practice. From a practical point of view, fast and accurate approximations to generate synthetic self-similar traffic are needed. We developed in this paper a new approach for approximating the power spectrum of the fractional Gaussian noise (FGN). To deal with the infinite summation of the FGN spectral density function, we computed the first two terms exactly, and approximated the rest of the summation using a linear function. We illustrated the validity of our approach. We also provided simulation results to compare the present approach with existing ones in terms of the computa-
tion speed and the accuracy in generating self-similar traffic with given Hurst parameters. We concluded that our approach is the fastest in computation speed among all the methods in our simulation and our approach guarantees to generate self-similar traffic with high degree of accuracy in terms of burstiness measures. While large-scale correlations are clearly present in network traffic, it is difficult to characterize the correlations over very long traces with a single Hurst parameter. More research is required in order to generate long traces where H is not a constant but a function of the time or other external factors.
References [1] A. Adas and A. Mukherjee, “On resource management and QoS guarantees for long range dependent traffic,” Proceedings of the IEEE Conference on Computer Communications (INFOCOM), Boston, MA, Apr. 1995, pp.779–787. [2] J. Beran, Estimation, Testing and Prediction for Self-Similar and Related Processes, Ph.D. Dissertation, Swiss Federal Institute of Technology (ETH), Z¨urich, Switzerland, 1986. [3] J. Beran, “Statistical methods for data with long-range dependence,” Statistical Science, vol.7, pp.404–416, 1992. [4] J. Beran, “A goodness-of-fit test for time series with long range dependence,” Journal of the Royal Statistical Society B, vol. 54, pp. 749– 760, 1992. [5] J. Beran, R. Sherman, M. S. Taqqu, and W. Willinger, “Long-range dependence in variable-bit-rate video traffic,” IEEE Transactions on Communications, vol. 43, pp. 1566– 1579, Feb./Mar./Apr. 1995. [6] M. E. Crovella and A. Bestavros, “Selfsimilarity in World Wide Web traffic: Evidence and possible causes,” IEEE/ACM Transactions on Networking, vol. 5, pp. 835–846, Dec. 1997. [7] C. H. Edwards and D. E. Penney, Calculus with Analytic Geometry, Upper Saddle River, NJ: Prentice-Hall, 1998.
[8] A. Erramilli, O. Narayan, and W. Willinger, “Experimental queueing analysis with longrange dependent packet traffic,” IEEE/ACM Transactions on Networking, vol. 4, pp. 209– 223, Apr. 1996.
[18] B. B. Mandelbrot and J. R. Wallis, “Computer experiments with fractional Gaussian noises-Part 1: Averages and variances,” Water Resources Research, vol. 5, pp. 228–267, Feb. 1969.
[9] A. Erramilli, R. P. Singh, and P. Pruthi, “Chaotic maps as models of packet traffic,” Proceedings of the 14th International Teletraffic Congress, Antibes Juan-les-Pins, France, June 1994, pp.329–338.
[19] H. Michiel and K. Laevens, “Teletraffic engineering in a broad-band era,” Proceedings of the IEEE, vol.85, pp.2007–2033, Dec. 1997.
[10] P. Flandrin, “Wavelet analysis and synthesis of fractional Brownian motion,” IEEE Transactions on Information Theory, vol. 38, pp. 910– 917, Mar. 1992. [11] M. W. Garret and W. Willinger, “Analysis, modeling and generation of self-similar VBR video traffic,” Computer Communications Review, pp.269–280, Oct. 1994. [12] D. P. Heyman and T. V. Lakshman, “What are the implications of long-range dependence for VBR-video traffic engineering?” IEEE/ACM Transactions on Networking, vol. 4, pp. 301– 317, June 1996. [13] S. M. Kogon and D. G. Manolakis, “Linear parametric models for signals with long-range dependence and infinite variance,” Proceedings of the IEEE International Conference on Acoustics, Speech and Signal Processing, Detroit, MI, May 1995, pp.1597–1600. [14] W.-C. Lau, A. Erramilli, J. L. Wang, and W. Willinger, “Self-similar traffic generation: The random midpoint displacement algorithm and its properties,” Proceedings of the IEEE International Conference on Communications, Seattle, WA, June 1995, vol. 1, pp.466–472. [15] W. E. Leland, M. S. Taqqu, W. Willinger, and D. V. Wilson, “On the selfsimilar nature of ethernet traffic (extended version),” IEEE/ACM Transactions on Networking, vol.2, pp.1–15, Feb. 1994. [16] S. B. Lowen and M. C. Teich, “Fractal renewal processes generate 1/f noise,” Physical Review E, vol.47, pp.992–1001, Feb. 1993. [17] B. Mandelbrot, “Long-run linearity, locally Gaussian process, H-spectra and infinite variances,” International Economic Review, vol.10, pp.82–111, Feb. 1969.
[20] V. Paxson, “Fast, approximate synthesis of fractional Gaussian noise for generating selfsimilar network traffic,” Computer Communications Review, vol.27, pp.5–18, Oct. 1997. [21] V. Paxson and S. Floyd, “Wide area traffic: The failure of Poisson modeling,” IEEE/ACM Transactions on Networking, vol. 3, pp. 226– 244, June 1995. [22] M. R. Spiegel and J. Liu, Schaum’s Mathematical Handbook of Formulas and Tables, Second Edition, New York, NY: McGraw-Hill, 1998. [23] M. S. Taqqu and V. Teverovsky, “Is network traffic self-similar or multifractral?” Fractals, vol.5, pp.63–73, 1997. [24] T. Taralp, M. Devetsikiotis, and I. Lambadaris, “Efficient fractional Gaussian noise generation using the spatial renewal process,” Proceedings of the IEEE International Conference on Communications, Atlanta, GA, June 1998, vol.3, pp.1456–1460. [25] W. Willinger, “Traffic modeling for highspeed networks: Theory versus practice,” in Stochastic Networks (vol. 71, pp. 395-409), Edited by F. P. Kelly and R. J. Williams, New York, NY: Springer-Verlag, 1995. [26] W. Willinger, M. S. Taqqu, W. E. Leland, and D. V. Wilson, “Self-similarity in high-speed packet traffic: Analysis and modeling of ethernet traffic measurements,” Statistical Science, vol.10, pp.67–85, 1995. [27] W. Willinger, M. S. Taqqu, R. Sherman, and D. V. Wilson, “Self-similarity through highvariability: Statistical analysis of Ethernet LAN traffic at the source level,” IEEE/ACM Transactions on Networking, vol.5, pp.71–86, Feb. 1997.
λ=π/2 −4
1.05
H = 0.6 H = 0.9
1.8
x 10
1.6
1
H = 0.6
1.4 0.95
1.2
Bn / B
0.9
1
H = 0.7
pn
0.85
0.8
0.8
0.6
H = 0.8
0.4
H = 0.9
0.75
0.2 0.7
1
2
3
4
5
6
7
8
9
10
0
n
10
Figure 1: Bn as a function of n
20
30
40
50
60 n
70
80
90
100
110
Figure 3: p as a function of n.
0.012
0.01 H = 0.6
H = 0.6
0.01
0.009 0.008 0.008 0.007
B3:∞
0.006 qn
0.006 H = 0.7
0.005
H = 0.7
0.004
0.004
0.003 H = 0.8
H = 0.8 0.002
0.002 H = 0.9
H = 0.9
0.001 0
0
0.5
1
1.5
λ
2
2.5
3
Figure 2: B3:∞ for different values of H and λ
3.5
0
50
100
150 n
200
Figure 4: q as a function of n.
250
120