A FINITE LOCUS EFFECT DIFFUSION MODEL FOR THE EVOLUTION OF A QUANTITATIVE TRAIT
J.R. Miller* Department of Mathematics, Georgetown University, Washington DC USA 20057-1233 *Corresponding author:
[email protected] M.C. Pugh Department of Mathematics, University of Toronto, Toronto, ON Canada M5S 3G3 M.B. Hamilton Department of Biology, Georgetown University, Washington DC USA 20057-1229
A BSTRACT. A diffusion model is constructed for the joint distribution of absolute locus effect sizes and allele frequencies for loci contributing to an additive quantitative trait under selection in a haploid, panmictic population. It is a “mesoscale” model in that it explicitly incorporates a finite number of loci with finite (i.e. non-infinitesimal) effects, but does not track the evolution of allele frequencies at specific loci. The model is designed to approximate a discrete model exactly in the limit as both population size and the number of loci affecting the trait tend to infinity. For the case when all loci have the same effect size, formal multiple-timescale asymptotics are used to make accurate predictions of the long-time response of the population trait mean to selection. For the case where loci can take on either of two distinct effect sizes, not necessarily with equal probability, numerical solutions of the system indicate that response to selection of a quantitative trait is insensitive to the variability of the distribution of effect sizes when mutation is negligible.
1. I NTRODUCTION A quantitative trait is a continuous random variable. Examples include the height of a human, the oil content of a corn plant, and the number of bristles on the abdomen of a fruit fly. The value of a quantitative trait in an individual is generally determined by contributions from numerous loci 1
2
(genes), as well as environmental factors and genetic-environmental interactions. As a result, the evolutionary dynamics of quantitative traits are complicated to treat mathematically. One type of model for quantitative traits includes explicit information on the state of each locus contributing to the trait [14], [1]. However, such models quickly become unwieldy for even moderate numbers of loci. Therefore, much mathematical treatment of quantitative traits is based on the classical infinitesimal model [5], [1], [16], [26]. The key assumption of this model is that a large, effectively infinite number of loci each make a small, effectively infinitesimal contribution to the quantitative trait under study. Since no single locus makes a significant contribution to the trait, the infinitesimal assumption allows modeling at the trait level to proceed without keeping track of dynamics at the level of the individual loci involved (known as “quantitative trait loci” or QTLs),since allele frequencies at each locus will change very little over short time scales (tens or even hundreds of generations). With the advent of practical QTL mapping techniques, new data has become available that calls into question the assumptions of the infinitesimal model. In agreement with Robertson’s [23] hypothesis that QTLs should show a broad distribution of effect sizes, much QTL mapping data supports a “finite loci, finite effects” or FLFE model: a given trait is affected by a finite number of QTL, with most loci having relatively small, though finite, effects but some loci explaining up to 10 percent, or even more, of phenotypic variation [24], [11], [9], [17]. However, as yet little theory exists to explore the evolutionary implications of an FLFE model of quantitative trait variance. One aim of existing models has been to predict the response of the population trait (phenotypic) mean to selection for quantitative traits when the biologically unrealistic assumptions of the infinitesimal model are relaxed [26, Chapter 15]. Turelli and Barton [25] used statistical methods to
3
model response to selection for quantitative phenotypes that do not exhibit the normally distributed breeding values expected under weak selection as the number of loci increases. Chevalet [2], [3] used statistical and ordinary differential equations methods to model response to selection in the case where both the number of loci and the population size are finite, although each locus was assumed to have a large number of alleles so that the distribution of allelic effects on phenotype was normally distributed. Another aim of theoretical work has been to identify processes that might produce observed distributions of QTL phenotypic effects. Orr [19], [21] used Fisher’s [7] geometric model of mutation and selection to study mutations at loci with a range of phenotypic effects. To predict the distribution of phenotypic effects of loci fixed by natural selection for a multidimensional phenotype, Orr modelled the fate of newly arising mutations where only a single locus is segregating at any given time. Our aim is to model response to selection for quantitative traits determined by a finite number of loci in finite populations, where the distribution of locus effects on the phenotype is explicit and a finite number of alleles (two) can segregate independently at all QTL simultaneously. In particular, we examine the influence of the phenotypic effect distribution of QTL on the dynamics of mean phenotype operated on by both selection and genetic drift. We disregard sampling variation and variation among replicate populations that is a consequence of the stochastic nature of the evolutionary process. We propose a diffusion model for the evolution of a quantitative trait. The model tracks the expected values of allele frequencies at QTLs contributing to the trait, and is designed to be exact in the limit of weak selection and of an infinite population with infinitely many QTL contributing
4
additively to a single trait. The diffusion system proposed is a “mesoscale” model in the sense that it explicitly incorporates QTL effects but does not allow the tracking of individual loci during trait evolution. In studying our model, we find evidence that response to selection is insensitive to variability in effect size when the number of loci contributing to a trait is not very small and mutation is negligible. Below, we first sketch a derivation of the diffusion model as a limit of an underlying discrete stochastic process and discuss its interpretation in the context of that process. We develop multipletime-scale asymptotic expressions to describe the long-time behavior of certain aspects of the model under weak selection, and check the validity of the asymptotics by comparison with numerical solutions of the full diffusion system. We then use numerical solutions to examine the influence of locus effect size variance on the dynamics of the trait mean, for specific models in which loci can take on either of two effect sizes.
2. T HE MODEL We now describe the discrete evolutionary model that our model, described below, is designed to approximate. The discrete model is of a single panmictic population of constant size N , with n diallelic haploid loci contributing to a particular trait. We ignore any environmental contributions to the trait. We also assume strict additivity of allelic contributions to the trait value of individuals, i.e. that epistasis is absent. The alleles at locus i are denoted by Ai and ai , with the convention that Ai contributes to a higher trait value than ai . The fraction of Ai alleles at the ith locus is denoted by xi . The average effect of locus i, that is, the mean difference in phenotype between haploid individuals carrying Ai
5
and those carrying ai , is denoted by Qi , with units identical to those of the trait. (For example, if we define µA1 to be the mean phenotype of individuals carrying the A1 allele (i.e. the genotypic value of the A1 allele) and µa1 to be the mean phenotype of those carrying the a1 allele and if allelic values at locus 1 are uncorrelated with allelic values at all other loci, then Q1 = µA1 − µa1 .) Then under strict additivity the population phenotypic mean µ is given (up to an additive constant called the midpoint which we decree to be 0) by (1)
µ=
n X
xi ( 12 Qi )
+ (1 −
xi )(− 12 Qi )
=
n X
i=1
(xi − 12 )Qi .
i=1
To model natural selection, we require a relative fitness function w(z), giving the expected number of offspring for an individual with trait value z as a fraction of the expected number of offspring for an individual with the optimal trait value, denoted zopt . The relative fitness function w(z) is assumed to satisfy the following conditions: w(z) depends only on |z − zopt | w(z) ≥ 0
for all real z
w(zopt ) = 1. In what follows, we will employ a Gaussian fitness function (2)
2
w(z) = e−κ(z−zopt ) .
The coefficient κ in (2) determines the strength of selection; note that when κ = 0, all phenotypes are equally fit. We require an expression for the probability pi that an individual in generation t + 1 will carry allele Ai . This probability depends on the values of allele frequencies xj (t) and the effect sizes Qj at all loci (j = 1, ..., n) and on the fitness function w. To derive an expression for pi , we start by
6
noting that the population contains a total of N xi (t) alleles of type Ai and N (1 − xi (t)) alleles of type ai after t generations. A sample, with replacement, of size N from the existing alleles will be passed to the next generation (t + 1). Let wAi and µAi (respectively, wai and µai ) denote the mean fitness and the mean phenotype of individuals with allele Ai (ai ). Then the expected proportion pi of Ai alleles in generation t + 1 must be proportional to both N xi and wAi ; similar considerations apply to qi , the expected proportion of ai alleles. Since the total number of alleles must equal N in every generation, it follows that (3)
pi =
xi wAi
xi wAi + (1 − xi )wai
and
qi = 1 − pi ;
this is a haploid version of Fisher’s [5] fundamental theorem of natural selection. To simplify computations, we do not use the exact expression (3). Rather, we make the assumption that the distributions of alleles at all loci j with i 6= j are independent of the distribution of alleles at locus i, i.e. all pairs of loci are in gametic phase equilibrium. This allows us to use the approximate expression (4)
pi ≈ pi approx =
xi w(µAi ) , xi w(µAi ) + (1 − xi )w(µai )
valid in the limit of weak selection. A justification of this approximation is given in Appendix B. Using equation (1) for the overall trait mean µ, it also follows under gametic phase equilibrium that µAi = µ − (xi − 12 )Qi + 12 Qi = µ + (1 − xi )Qi , µai = µ − (xi − 12 )Qi − 12 Qi = µ − xi Qi .
(5)
Substituting (5) into (4) yields (6)
pi =
xi w(µ + (1 − xi )Qi ) . xi w(µ + (1 − xi )Qi ) + (1 − xi )w(µ − xi Qi )
7
Evolution in the discrete model outlined above is a stochastic process, in which the number of Ai alleles in generation t + 1 is a binomial random variable with N trials and probability pi of success (i.e. of drawing an Ai allele) at each trial. We wish to derive a deterministic model for the expected or mean behavior of this process. It should be possible, using standard techniques, to derive a (continuous-time) system of n ordinary differential equations (ODEs) that approximates the expected behavior of each allele frequency in the discrete model. However, such a system will quickly become unwieldy as n increases. Instead, we now describe a diffusion model that explicitly accounts for QTL effects and allele frequencies but does not track allele frequencies at specific loci. The key idea in the derivation of the diffusion model is that the trait mean µ can be expressed as a sum not over loci as in (1), but rather over effect sizes and allele frequencies. To do so, let Φ(x, Q, t) denote the number of loci with allele frequency x and effect size Q after t generations. Then we have
µ(t) =
(7)
XX x
Q(x − 21 )Φ(x, Q, t).
Q
The summation in (7) amounts to an indexing of loci by allele frequency and effect size, rather than by arbitrary integers. A standard informal derivation (as in, e.g., [22], [8]) of the diffusion model from the discrete stochastic process described above is given in the Appendix A. This results in a partial differential equation for Φ
(8)
∂t Φ(x, Q, t) = −∂x (M Φ(x, Q, t)) + 12 ∂x2 (V Φ(x, Q, t))
8
that holds for all t > 0 and all 0 < x < 1. The coefficients M (x, Q, µ(t)) and V (x, Q, µ(t)) are determined by the fitness function w and µ(t), the trait mean at time t: p(x, Q, µ) =
xw(µ+(1−x)Q) , xw(µ+(1−x)Q)+(1−x)w(µ−xQ)
M (x, Q, µ) = p(x, Q, µ) − x, V (x, Q, µ) =
(9)
p(x,Q,µ)(1−p(x,Q,µ)) . N
Before defining the trait mean µ(t) for the diffusion model, we make a few remarks. First, the PDE (8) involves no derivatives with respect to Q. This is because in our model a locus will not change its effect size as time passes, but allele frequencies at the locus can and in general will change. For example, suppose that the A allele frequency at a locus with effect size Q increases by ∆x in time ∆t; this would increase the number of loci with allele frequency x + ∆x and effect size Q at time t + ∆t, but would not affect the distribution of allele frequencies for loci with effect size different from Q. The coupling between loci with different effect sizes arises only through the trait mean µ(t), which (as equation (7) indicates) is a type of average over all loci. Second, if a QTL has become fixed (i.e. has allele frequency x = 0 or 1) at a particular time then it will remain fixed — there is no mutation in the present model. This may be thought of as an absorbing boundary condition. From the definition of Φ(x, Q, t), at each time we require (10)
Z X [Φ(0, Q, t) + Φ(1, Q, t) +
1
Φ(x, Q, t) dx] = n. 0
Q
This will hold if Φ(x, Q, t) can be written as two delta functions (one at x = 0 and one at x = 1) plus a function that is continuous on (0, 1): Φ(x, Q, t) = Φ(0, Q, t) δ0 (x) + Φ(x, Q, t) + Φ(1, Q, t) δ1 (x). Equation (7) then gives the trait mean at time t: µ(t) =
P R1 Q
0
Q(x − 21 )Φ(x, Q, t) dx + µ0 (t) + µ1 (t),
9
³
£ ¤ ´ Rt P µ0 (t) = − Q Q2 Φ(0, Q, 0) + 0 limx→0+ −M Φ(x, Q, s) + 21 ∂x (V Φ(x, Q, s)) ds ³ £ ¤ ´ Rt P (11) µ1 (t) = Q Q2 Φ(1, Q, 0) − 0 limx→1− −M Φ(x, Q, s) + 21 ∂x (V Φ(x, Q, s)) ds . Next, we nondimensionalize the system (8), (9), (11) to further enable comparison between different traits. Equation (10) shows that the frequency distribution Φ has no units, while equation (8) shows M and V have the units of 1/generations. Since the expression for V , (9), contains a factor of 1/N , by choosing a time scale of N generations, the parameter N will drop out of the equations when selection is absent (i.e. when M ≡ 0). Let Z0 denote a characteristic trait scale (e.g. the standard deviation of the distribution of the trait in the founding population); then it is natural to scale the trait mean µ by Z0 . In order to compare hypotheses regarding the number of loci contributing to a particular trait, it is convenient to consider the trait mean µ as being held constant as the number of loci n varies, and equation (11) will imply that Q should be of order O(1/n). Finally, we wish to recast Φ as a probability distribution φ whose integral is 1, rather than n. We therefore define dimensionless variables and parameters by Q= (12)
Z0 ˜ θ, n
µ = Z0 R, M=
t = N t˜,
Φ = nφ
zopt = Z0 Ropt , 1 f M, N
V =
κ=
1 κ ˜ Z02
1 e V. N
Suppressing tildes from now on, equations (8), (9), and (11) become (13)
φt (x, θ, t) = −(M φ(x, θ, t))x + 12 (V φ(x, θ, t))xx ,
∀t > 0, 0 < x < 1
where p(x, θ, R(t)) =
xw(R+(1−x)θ/n) xw(R+(1−x)θ/n)+(1−x)w(R−xθ/n)
M (x, θ, R(t)) = N (p − x) =
N x(1−x)[w(R+(1−x)θ/n)−w(R−xθ/n)] , xw(R+(1−x)θ/n)+(1−x)w(R−xθ/n)
10
(14)
V (x, θ, R(t)) = p(1 − p) =
x(1−x)w(R−xθ/n)w(R+(1−x)θ/n) [xw(R+(1−x)θ/n)+(1−x)w(R−xθ/n)]2
and
(15)
P R1 R(t) = θ 0 θ(x − 21 ) φ(x, θ, t) dx + R0 (t) + R1 (t) £ ¤ ´ Rt P θ³ 1 R0 (t) = − θ 2 φ(0, θ, 0) + 0 limx→0+ −M φ(x, θ, s) + 2 ∂x (V φ(x, θ, s)) ds ¤ ´ £ Rt P θ³ 1 R1 (t) = θ 2 φ(1, θ, 0) − 0 limx→1− −M φ(x, θ, s) + 2 ∂x (V φ(x, θ, s)) ds .
Because of the coupling of loci through the trait mean in the coefficients (14), we view the diffusion (13) as describing the behavior of a single population. In particular, the conditional probability integral Rb Rx=a 1 x=0
φ(x, θ, t) dx φ(x, θ, t) dx
should be interpreted as describing the probability that a locus with effect size θ in this single population will have an allele frequency in (a, b) at time t. This interpretation is quite different from that in the classical models, where φ is viewed as a probability distribution over replicate populations. Moreover, it means that the effects of genetic sampling (i.e. of sampling due to finite population size) and of sampling due to the fact that only finitely many loci contribute to the trait are not included in the present model. This point is discussed further in section 6. We note that the coefficients of the rescaled M and V in (14) now have θ/n in their arguments. This is reasonable because these coefficients reflect fitness differences due to the presence or absence of the high trait value allele A at a single locus. A single locus with a given rescaled absolute effect size θ will have a greater impact on fitness when n is small (i.e. when few loci contribute to the rescaled trait mean R) than when n is large.
11
In addition to the nondimensionalized trait mean R(t), another interesting time-dependent quantity is 2
S (t) =
(16)
XZ
1
θ2 x(1 − x)φ(x, θ, t) dx,
0
θ
2 2 = Z02 /n S 2 , where Z0 and by σG which is related to the (dimensional) total genetic variance σG
n are as in (12). Because the model does not include mutation, the absorbing boundary conditions mean that we expect all loci to eventually go to fixation or loss. Therefore, in the long-time limit the trait mean R(t) should tend to a constant value and the total genetic variance S 2 (t) should tend to zero.
3. N UMERICAL SIMULATIONS In this section, we present numerical simulations of solutions of the system (13), (14), and (15). The absorbing boundary conditions pose an immediate computational difficulty. Equation (13) shares with classical models the property that in some regimes solutions are expected to grow rapidly near the absorbing boundaries. For this reason, we compute solutions of a closely related initial value problem and then transform these solutions to solutions of (13), (14), and (15). We define the new variable ψ(x, θ, t) := V (x, θ, R(t))φ(x, θ, t) for x ∈ (0, 1). Equation (13) then becomes ψt (x, θ, t) =
ψ(x,θ,t) d V V (x,θ,R(t)) dt
(x, θ, R(t)) ³
(17)
−V (x, θ, R(t))
´
M (x,θ,R(t)) ψ(x, θ, t) V (x,θ,R(t))
x
+ 12 V (x, θ, R(t)) ψxx (x, θ, t)
12
The numerical simulations solve the system (14), (15), and (17), where the trait mean R(t) is computed with ψ/V wherever φ(x, ·, ·) appears in the formula (15) with x ∈ (0, 1). We impose Dirichlet boundary conditions on the solution: ψ(0, θ, t) = ψ(1, θ, t) = 0 for all θ and t. In Appendix A, we justify this use of Dirichlet boundary conditions. Given initial data φ(x, θ, 0), we compute R(0) and then V (x, θ, 0) to determine the initial data ψ(x, θ, 0). Numerical solutions of the system (14), (15), and (17) are then obtained assuming Dirichlet boundary conditions. As an additional diagnostic, we compute the total genetic variance S 2 (t) at each timestep. The scheme is fourth-order accurate in space, using finite differences on a fixed, nonuniform mesh to approximate the x-derivatives. The mesh was chosen to have higher resolution near x = 0 and x = 1. The time-stepping is second-order accurate in time. It uses a Crank-Nicolson timestepping for the diffusive term, extrapolation for the source term, and an extrapolated leapfrog method for the advection term. This computes the solution at the interior meshpoints. To compute the density of loci being fixed at x = 0 and x = 1 (the mass of the delta functions) a pair of ODEs were solved using Richardson extrapolation. The ODEs are solved simultaneously with the diffusion equation (17) because fixed loci continue to contribute to the trait mean R(t), which in turn appears in the coefficients of the diffusion equation. The code is written in Matlab, converted into C code with the Matlab compiler and then compiled and executed using the GNU compiler on a Linux machine; the code is available upon request. In Figure 1, we present the solution to (13), (14), (15) using a single value of the QTL effect size θ (specifically, θ = 2.5,) with uniform unfixed initial data (φ(x, θ, 0) = 1 for 0 < x < 1) and no initial fixation (φ(0, θ, 0) = φ(1, θ, 0) = 0). The free parameters are taken as n = 10,
13
unfixed =0.05
unfixed =0.10
unfixed =0.22
unfixed =0.48
unfixed =1.00
Figure 1: The solution to (13), (14), and (15) shown at five times. We assumed only one value of the QTL effect size θ; θ = 2.5, and chose parameters n = 10, κ = .1, Ropt = .1, and N = 100. The initial data is φ(x, 2.5, 0) = 1 for 0 < x < 1, and φ(0, 2.5, 0) = φ(1, 2.5, 0) = 0. For five times, we present the solution φ(x, 2.5, t) (plotted as a graph) and the fixations φ(0, 2.5, t) and φ(1, 2.5, t) (presented as spikes located at x = 0, 1 of the respective heights). The front-most plot is at time t = 0; 100% of the loci are unfixed. The plot one further back is the 72nd generation; 48% of the loci are unfixed, 24% and 28% are fixed at x = 0 and x = 1 respectively. The third plot is the 144th generation; 22% of the loci are unfixed, 36% and 42% are fixed at x = 0 and x = 1 respectively. The fourth plot is the 216th generation; 10% of the loci are unfixed, 42% and 48% are fixed at x = 0 and x = 1 respectively. The fifth plot is the 288th generation; 4.8% of the loci are unfixed, 44% and 51% are fixed at x = 0 and x = 1 respectively.
κ = .1, Ropt = .1, and N = 100. The simulation was continued until the time at which just 4.8% of loci remained unfixed: tf = 2.88, corresponding to 288 generations (since N = 100). The solution φ is shown at five approximately equally spaced times between 0 and tf . The most notable feature of the solution is that the distribution of allele frequencies φ(x) is skewed toward x = 1 for all times t > 0 computed. This skewness reflects the action of selection. The initial data is symmetrical about x = 1/2 and so the initial trait mean is zero. Therefore, if the optimum trait value Ropt were equal to 0 there would be no selective pressure to change the trait mean, only
14
unfixed =0.05
unfixed =0.10
unfixed =0.25
unfixed =0.56
unfixed =1.00
Figure 2: The solution to (13), (14), and (15) shown at five times. We assumed only one value of the QTL effect size θ; θ = 6.5, and chose the same values of n, κ, Ropt , and N as in Figure 1. The initial data is also the same. The solution is presented as in Figure 1. Initially, 100% of the loci are unfixed. At the 40th generation; 56% of the loci are unfixed, 21% and 23% are fixed at x = 0 and x = 1. At the 84th generation; 25% of the loci are unfixed, 36% and 39% are fixed at x = 0 and x = 1. At the 128th generation; 10% of the loci are unfixed, 43% and 46% are fixed at x = 0 and x = 1. At the 168th generation; 4.8% of the loci are unfixed, 46% and 49% are fixed at x = 0 and x = 1.
to reduce trait variance. The solution would thus remain symmetrical about x = 1/2 at all times. Since the optimum trait value Ropt is in fact positive, however, alleles that increase an individual’s phenotypic value are favored over alleles that decrease it, resulting in skewness of the distribution φ with a bias towards fixing at x = 1. If Ropt were negative, the bias would be towards x = 0. Figure 2 shows the solution to (13), (14), (15) again with a single value of the QTL effect size θ: θ = 6.5. The initial data and all other parameters are the same as for the solution shown in Figure 1. Again, the solution was computed until the time at which just 4.8% of the loci remained unfixed: tf = 1.68, corresponding to 168 generations. The solution is shown at five times between
15
0 and tf . For θ = 2.5, it took 288 generations before all but 4.8% of the loci were fixed; this is about 1.7 times as many generations as it took for θ = 6.5. This difference reflects the fact that selection acts more weakly on loci with smaller effect sizes (smaller values of θ), driving them to fixation more slowly than loci with larger effect sizes. Another difference between Figures 1 and 2 is that the concavity of the solutions in Figure 2 is much more pronounced. As will be seen in Section 4, if no selection were present the system would become linear and, since the horizontal initial data is precisely the leading eigenfunction of the relevant linear operator, no higher modes would be excited and thus no concavity would develop. The concavity of these solutions is thus a nonlinear effect due to coupling of loci through the trait mean R and the fitness function w. Figure 3 plots the trait mean R(t) as a function of time for the θ = 2.5 simulation (see Figure 1) and the θ = 6.5 simulation (see Figure 2). As expected, R(t) approaches an equilibrium much closer to the optimum value Ropt = .1 for the larger value of θ. This is not necessarily due to stronger action of selection for the larger value of θ. In fact, the standardized directional selection gradient was calculated at the time t = 0 for each scenario as the regression of relative fitness on the trait in question multiplied by the standard deviation of the trait [15], assuming a normally distributed trait. This gradient was .0084 when θ = 2.5 and .0032 when θ = 6.5, indicating weak selection for both cases but stronger selection when θ = 2.5. (This is despite the fact that the parameter κN θ2 /n2 is larger when θ = 6.5 than when θ = 2.5 (.4694 versus .0694), indicating that selection is relatively stronger, when compared to random genetic drift, when θ = 6.5 than when θ = 2.5; see Section 4 for more about this parameter.) Rather, the differential response to selection more plausibly reflects the fact that the total available genetic variance was greater at
16 0.12 θ = 6.5 0.1 θ = 2.5 (50%), 6.5 (50%) 0.08 θ = 2.5
R
0.06
0.04
0.02
0
−0.02
0
50
100
150 t (generations)
200
250
300
Figure 3: The trait mean R(t) is plotted as a function of time for three solutions. The upper solid line corresponds to the QTL effect size θ = 6.5 simulation shown in Figure 2. The bottom solid line corresponds to the θ = 2.5 simulation shown in Figure 1. The dashed line corresponds to a simulation which has two values of θ: θ = 2.5 and θ = 6.5. The parameters n, κ, Ropt , and N are as in the other two simulations and the initial data is φ(x, 2.5, 0) = 1/2 (and φ(0, 2.5, 0) = φ(1, 2.5, 0) = 0) and φ(x, 6.5, 0) = 1/2 (and φ(0, 6.5, 0) = φ(1, 6.5, 0) = 0).
t = 0 when θ = 6.5 than when θ = 2.5 (S 2 (0) = (6.5)2 /6 versus S 2 (0) = (2.5)2 /6). Thus the solution with θ = 6.5 advanced further before “running out of steam” at 95% fixation. The dotted line in 3 presents R(t) for the solution to (13), (14), (15) with half of all loci having effect size θ = 6.5 and half having θ = 2.5. The initial data is uniform in x for both values of θ and the parameters κ, Ropt , and N are unchanged. Nonlinear effects are also apparent in Figure 3: the trait mean R(t) for the two-θ case is much closer to the trait mean for θ = 6.5 than to an average of the trait means for θ = 6.5 and θ = 2.5.
17
4. M ULTIPLE - SCALE EXPANSIONS Two biological processes are at work in the model: random drift and selection. In equation (13), random drift is modeled by the diffusive term (V φ)xx and selection is modeled by the advective term (M φ)x . Each process has its own characteristic timescale. The timescale of random drift is 1 (corresponding to N generations in the unrescaled system), because V in the unrescaled system includes a factor of 1/N that can be viewed as a diffusion coefficient. The timescale of selection is determined by the value of κN θ2 /n2 , together with Ropt . To see this, suppose that R = Ropt . Expanding M around κ = 0 then yields
M = κ2x(1 − x)(x − 21 )N θ2 /n2 + O(N κ2 ), so that κN θ2 /n2 functions as a speed of propagation in the advection term of equation (13). (We remind the reader that κ and θ are dimensionless variables. Using the rescaling (12), the timescale of selection is κN Q2 .) If selection is weak relative to random drift,
κN θ2 /n2 ¿ 1,
then there is a separation in timescales. This motivates the use of a two-timescale asymptotic expansion (see for example [12, §6]) to approximate the model dynamics in the case of weak selection. We now outline such an analysis for the case when all loci share a single effect size θ. To begin, we use the slower timescale (selection) as an expansion parameter:
² = κN θ2 /n2
18
and assume that there is a separation in timescales: ² ¿ 1. We introduce two time variables, one for each timescale: τ =t
T = ²t
The distribution φ and trait mean R are then written in terms of the new time variables and expanded in ²: φ(x, τ, T ) = φ0 (x, τ, T ) + ²φ1 (x, τ, T ) + ²2 φ2 (x, τ, T ) + H.O.T. (18)
R(τ, R) = R0 (τ, T ) + ²R1 (τ, T ) + ²2 R2 (τ, T ) + H.O.T.
“H.O.T.” is short-hand for “higher-order terms”. An expansion is valid if it satisfies the system (13), (14), and (15), if it has the correct initial data φ(x, θ, 0) and R(0), and if at all times τ and T , φi and Ri are O(1). The spatial derivatives are unaffected by the expansion; however, the time derivatives separate: ∂t = ∂τ + ²∂T . There is no explicit dependence of φi or Ri on θ because we are assuming a single value of θ. In this case, M , V , and φ in (13) are functions of x and t only, and the mean phenotype R(t) in (15) is computed by integrating over x only. At the O(1) level, the system (13), (14) and (15) reduces to the Wright-Fisher linear diffusion equation ([6], [28], [13]) (19)
1 ∂τ φ0 (x, τ, T ) − Lφ0 (x, τ, T ) := ∂τ φ0 (x, τ, T ) − ∂xx (x(1 − x)φ0 (x, τ, T )) = 0, 2
where L will be referred to as the Wright-Fisher operator. If φ0 is continuous and dominated by a probability distribution on (0, 1), then we must have (20)
lim xφ0 = lim (1 − x)φ0 = 0.
x→0+
x→1−
We assume that x(1 − x)φ20 is integrable on [0, 1], a condition satisfied by all continuous functions that satisfy (20) (and hence by all biologically reasonable solutions of 19). The solution of
19
equation (19) with the constraint (20) was described by Kimura [13]. Specifically, the operator L has eigenvalues λi = (i + 1)(i + 2)/2 (i = 0, 1, . . .) and eigenfunctions ψi which are scaled and translated Gegenbauer polynomials, which form an orthonormal set in L2 ([0, 1]) with respect to the weight w(x) = 6x(1 − x) [18]. The solution to (19) can therefore be written as a linear combination of Wright-Fisher eigenfunctions with coefficients that vary slowly in time: (21)
φ0 (x, τ, T ) =
∞ X
ai (T )e−λi τ ψi (x).
i=0
To find the initial value of φ0 , one computes the weighted inner product of the initial data φ(x, 0) with the eigenfunction ψi and assigns the resulting value (which will be finite if φ satisfies (20) or R1 0
x(1 − x)φ2 < ∞) to ai (0). Thus, φ(x, 0) = φ(x, 0, 0).
We now turn to the O(1) component of R. We observe that Z (22)
1
R(τ, T ) = θ 0
θ (x − 21 )φ(x, τ, T ) dx + C(τ, T ) 2
where (23)
∂τ C + ²∂T C =
£
lim+ + lim−
x→0
x→1
¤¡
¢ M φ − 12 (V φ)x ;
equations (22) and (23) determine R implicitly since R is an argument of M and V (see (14)). Thus in the expansion (18) we write Z
1
Ri (τ, T ) = θ 0
θ (x − 21 )φi (x, τ, T ) dx + Ci (τ, T ), 2
where (23) yields the differential equations satisfied by Ci (τ, T ). Substituting the expression (21) for φ0 into equation (23) and collecting the O(1) terms yields an ordinary differential equation: C0 τ = RHS(φ0 ). Solving this ODE determines C0 (and therefore R0 ) up to a term which is a function of the slow timescale T .
20
To determine the values of the slowly varying coefficients in φ0 and R0 , we proceed to the O(²) terms of the system (13), (14), and (15), obtaining (24)
∂τ φ1 (x, τ, T ) − Lφ1 (x, τ, T ) = RHS1 (φ0 , R0 )
where RHS1 is a complicated function of φ0 and R0 . If RHS1 has any nonzero projections onto the eigenfunctions {ψi } of L then this will result in φ1 having secular terms that grow in time, violating the φ1 ∼ O(1) assumption. We therefore require that RHS1 have zero projections on {ψi }. This non-secularity condition leads to ordinary differential equations that can be solved for the slow coefficients in φ0 . We then determine the slow term in R0 by finding the O(²) terms of equation (23), yielding C1 τ = RHS2 (φ0 , R0 , φ1 ), where RHS2 is a complicated expression. If RHS2 has a constant term, C1 (τ, T ) will have a secular term that grows linearly in τ , violating the R1 ∼ O(1) assumption. This yields a nonsecularity condition on RHS2 which results in an ODE for the slow term in C0 . This ODE contains no terms involving φ1 and therefore can be solved at this stage; its solution fully determines C0 (and hence R0 ). The slow terms of φ0 have now been chosen so that equation (24) has only nonresonant terms in RHS1 . The resulting solution φ1 is the sum of a particular solution φp1 and a homogeneous solution of the form (21) (with different slow coefficients). The initial values of the slow coefficients are determined from the particular solution via the requirement φ1 (x, 0, 0) = 0. One then uses φ0 , R0 , and φ1 to solve for C1 up to slow terms. The temporal forms of the slow terms of φ1 and C1 are determined, as described above, by nonsecularity conditions for the O(²2 ) equation for φ2 and C2 . In the above, we described the multiple-scale expansion procedure keeping track of all eigenfunctions {ψi }. This is impossible in practice. Keeping just the first m+1 Gegenbauer polynomials
21
ψ0 . . . ψm in the expansion (21) for φ0 , approximations were obtained for m = 2, 4, and 6 with the aid of the symbolic mathematics package Maple (Maple 9 worksheets available upon request). If m = 2, the expansions involve projecting onto the first three eigenfunctions: √ ψ1 (x) = 2 5(x − 21 ),
ψ0 (x) = 1,
ψ2 (x) =
√
14( 14 − 5(x − 12 )2 ).
For example, at O(1), in the case where no loci are initially fixed we have for m = 2 φ0 (x, t) = a00 e− (25)
(N −1) ²t 5N
R0 (t) =
e−t + a10 e−
(N −9) ²t 7N
√
5θ a10 6
e−3t ψ1 (x) + a20 e−
S02 (t) =
2(N −21) ²t 15N
e−6t ψ2 (x)
−1) θ 2 − (N5N ²t −t e e a00 6
for constants a00 , a10 , a20 determined by the initial data φ(x, 0). Also, above we provide the O(1) portion of the (scaled) total genetic variance S 2 , as computed by integrating φ0 against θ2 x(1 − x). When t is large, (25) indicates that φ0 will be dominated by a horizontal profile decaying steadily at a rate 1 + ²(N − 1)/5N and that S02 (t) will decay at this rate as well. The presence of selection (² > 0) thus increases the rate of decay of φ0 , and the rate at which genetic variability is lost, beyond the rate that would be seen in the absence of selection (² = 0). A similar effect on the decay rate can be seen in S 2 1 (t) (not shown). Two features of R0 (t) in (25) are also noteworthy. First, R0 in fact does not depend on t. This is reasonable when one recalls the standard interpretation of the Wright-Fisher equation (19) [6], [28], [13]. In this interpretation, when ² = 0, R0 represents the mean or expected behavior of the trait mean in the absence of selection. Although the trait mean of a particular population will in general change over time in response to random drift, the expected trait mean averaged over all possible populations will not change. In our interpretation, the fact that R0 is constant likewise reflects the absence of stochastic effects due to genetic sampling. However, it is not clear that
22
the full system gives an unbiased representation of the mean behavior over replicate populations, because of the nonlinearity that arises from coupling of loci through the trait mean. (In contrast to the behavior of the trait mean, genetic variance must decline even in the absence of selection, since the model does not include mutation or migration; thus S 2 0 (t) does decay to 0 as t → ∞ even when ² = 0.) Second, if the initial data is even about x = 1/2 (a10 = 0) then R0 = 0. This is because the trait mean is computed by integrating φ (plus δ-functions at x = 0 and x = 1) against (x − 1/2). Since this weight is odd about x = 1/2, the integral will only pick up the even parts of φ. At O(²), φ1 is a linear combination of the first five eigenfunctions, ψ0 . . . ψ4 and, like φ0 , it decays to zero as time tends to infinity with the decay rate being determined by the rate of decay of the slowest-decaying eigenfunction, the constant eigenfunction ψ0 . The trait mean at O(²) is: √
R1 (t) = −a10 905 θe− √
(26)
(N −9)²t 7N
+ 905 θa10 + 13 na00
e−3t +
³√
5 a 6 10
³
1 R 3 opt
−
´ √ 5θ a na00 18 10
´ N −1 − Ropt e− 5N ²t e−t
The effect of selection is apparent at the O(²) level in that R1 (t) (unlike R0 ) is time-dependent. Furthermore, even if the initial data is even about x = 1/2, R1 will in general differ from 0 at times t > 0. This is because selective pressure will cause allele frequencies to shift preferentially toward one extreme (x = 0 or x = 1), breaking any symmetry about x = 1/2. Such behavior is reflected in the skewness of the plots of solutions given in Figures 1 and 2. To check the validity of the asymptotics and to determine parameter regimes in which the asymptotics provide a useful approximation to solutions of the full system (13),(14), (15) asymptotic approximations for S 2 (t) and for the trait mean R(t) were compared with those obtained from numerical solutions of the full system for a single value of θ, several initial x-distributions, and
23
a range of selection parameters κ and Ropt . The comparisons indicate that the two-time-scale asymptotic approximations can predict future values of the trait mean and additive variance from initial data accurately for the cases of weak to moderate selection when the higher moments of the initial x-distribution are sufficiently small or when data fitting takes place after higher moments have decayed. Each numerical run was continued until just 5% of the original mass remained, i.e. until 5% of initially unfixed loci remained unfixed. Asymptotic approximations were fitted to the output of each numerical run by choosing the parameters a00 . . . am,0 as in, e.g., (25) so that the projections of the asymptotically predicted solution on the first m + 1 Gegenbauer polynomials matched those of the numerical solution at time t0 (= 0 unless otherwise specified). The asymptotically predicted and numerically computed values of R and S 2 were then compared at the stopping time tf . Comparisons of the asymptotics with data for a series of runs with various initial x-distributions provided evidence that the absolute value of the difference between the asymptotically predicted and numerically computed values of R(tf ) and S 2 (tf ) decayed like ²2 as ² = N κθ2 /n2 → 0, giving O(²) convergence of the asymptotics and numerical data as expected. For example, when quartic initial data slightly asymmetrical about x = 40001 φ(x, 0) = 40000
µ
1 2
21 1 − 3(x − 12 )2 + x3 − 5(x − 12 )4 16 10000
¶
was used, asymptotic estimates of R(tf ) with m = 2 failed to show O(²) convergence. Using m = 6, however, gave the expected rate of convergence and matched the numerically computed R(tf ) with relative error < .006 for all but the two largest values of ² tried; see Table 1. Improvements in fit between the asymptotically predicted and numerically computed values of R(tf ) were seen when fits were made at times t0 > 0. This provides evidence that (as one
24
² log(abserr) (m = 2) log(abserr) (m = 6) log(relerr) (m = 6) 1 −0.55026 −0.55026 0.46351 0.1 −2.1743 −2.1743 −0.66802 0.01 −4.1253 −4.1233 −1.6936 0.001 −6.3917 −6.1183 −2.7041 0.0001 −6.4567 −8.1178 −3.7744 1e − 005 −6.4473 −10.125 −5.1776 1e − 006 −6.4472 −12.261 −7.1578 Table 1: Comparison of asymptotically predicted and numerically computed values of R(tf ) using initial data quartic in x, n = 10, Ropt = .1 and N = 100. Logarithms are base 10. Here abserr := |Rasymp (tf ) − Rnum (tf )|, relerr := |Rasymp (tf ) − Rnum (tf )|/|Rnum (tf )|, where Rnum and Rasymp are respectively the numerically computed and asymptotically predicted values of R. m denotes the order of the Gegenbauer polynomials used in the asymptotics.
would expect) higher eigenmodes in the solution decayed relatively rapidly, making the asymptotic approximation better as t increases and exact in the long-t limit. We have not attempted to establish such a result rigorously, however.
5. I NSENSITIVITY
TO MULTIPLE EFFECT SIZES
In Section 3, we presented simulations of a population where all QTL have only one effect size, θ0 . In such a population, the mean of the distribution of locus effect sizes is θ0 and the variance is 0. We now present a more detailed study of response of the trait mean to selection in a population where not all QTL have the same effect size. In particular, we ask whether response to selection can be predicted from the fitness function and mean effect size alone, or whether additional information about the distribution of effect sizes might be useful in predicting response to selection. To do this, a series of numerical solutions to (13), (14), (15) were computed. Each run used an effect size distribution with two values of θ, as such distributions are the simplest possible distributions of θ with nonzero variance. We denote the two values of effect size by θ1 and θ2 , with
25
θ1 ≤ θ2 . The fraction of loci with the high value of θ, P (θ = θ2 ), was chosen from 1/2, 1/3 and 1/5. For each set of runs, an initial distribution of allele frequencies x was specified for loci with each effect size. This initial x-distribution was always uniform for loci with the low effect size θ1 , i.e. we specified the conditional probability densities Z φ(x, θ1 , 0)/ φ(ξ, θ1 , 0) dξ ≡ 1 for all runs. For loci with the high effect size θ2 , the initial x-distribution was varied among three different profiles, i.e. we specified the conditional probability densities Z φ(x, θ2 , 0)/ φ(ξ, θ2 , 0) dξ) = g(x), with g(x) varying among the uniform distribution gunif (x) ≡ 1, a quartic profile concentrated near x = 12 , gpeak (x) =
21 − 3(x − 21 )2 − 5(x − 12 )4 16
and a quartic profile concentrated near x = 0 and x = 1, gvalley (x) = 80(x − 12 )4 . The parameters were n = 30, κ = .1, Ropt = .1, and N = 100. A set of runs was performed, varying the mean µ(θ) = p1 θ1 + p2 θ2 and the coefficient of variation cv(θ) =
p
p1 (θ1 − µ(θ))2 + p2 (θ2 − µ(θ))2 /µ(θ)
of the θ-distribution among the values µ(θ) ∈ {.1, .25, .75, 1.5, 3, 6, 10},
cv(θ) ∈ {0, .05, .1, .25, .5, 1}.
26
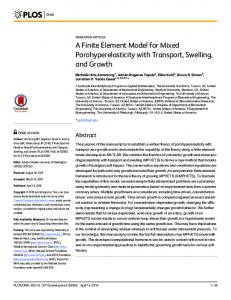
Each pair (µ(θ), cv(θ)) determines a pair (θ1 , θ2 ), giving a total of 42 runs. Each run was continued until a time t = tf at which only 5% of originally unfixed loci remained unfixed. To verify that the chosen combination of parameters n, κ, N , Ropt fell in a biologically plausible regime, standardized directional and stabilizing selection gradients for the initial data with the specified fitness function were calculated using the formulas of Lande and Arnold [15] and compared with empirical distributions of selection gradients compiled by Kingsolver et al. [4]. The standardized directional selection gradients for the initial data fell within a realistic range (approximately .003 to .36). The stabilizing selection gradients fell within a narrower, still realistic range (approximately −.13 to 0). Thus a range of weak to moderate selection strengths was employed, as judged by the empirical distributions of selection strengths in [4]. The values of R(tf ) for the various runs were recorded and compared with the values of the initial scaled total additive genetic variance S 2 (0)/n. Here we will focus on the case where the fraction of loci with the high value of θ is 1/2 and initial distributions of allele frequencies x are uniform for both values of θ. One should expect a closer approach to the optimum trait value (i.e. R(tf ) closer to Ropt ) when the initial genetic variance S 2 (0) is larger [5]. For this initial data, S 2 (0) = µ(θ)2 (1+cv(θ)2 )/6. To keep the relation between µ(θ) and S 2 (0) transparent, we therefore studied the relation between S 2 (0) and R(tf ) p for fixed values of cv(θ). In Figure 4, we plot the final trait mean R(tf ) versus S(0) = S 2 (0) for four values of cv(θ). The corresponding plots for different values of n ranging from 6 to 100 were quantitatively almost identical to the plot shown in Figure 4 (data not shown). Thus the relationship between R(tf ) and S(0) appears to be essentially independent of n ≥ 6 and to depend on µ(θ) and cv(θ) only insofar as these quantities influence S(0).The results for initial joint distributions with
27 0.12
0.1
R(tf)
0.08
0.06
0.04
0.02
0
0
0.2
0.4
0.6
0.8
1
1.2
1.4
S2(0)/n
Figure 4: The results of twenty-four two-θ simulations of (13), (14), and (15). (Results of eighteen additional simulations followed the same pattern but are omitted from the graphics for clarity.) The model parameters are: n = 30, κ = .1, Ropt = .1, and N = 100. The QTL effect size is θ1 with probability p1 = 1/2 and is θ2 with probability p2 = 1/2. The initial distributions are: φ(x, θi , 0) = pi for 0 < x < 1 and φ(0, θi , 0) = φ(1, θ, 0) = 0. The effect sizes are chosen to achieve a given mean µ(θ) and coefficient of variation cv(θ) and the solution is computed the time tf when all but 5% of the QTL are fixed. For each value of cv(θ), we then plot R(tf ) as a function of S 2 (0)/n to see how close R(tf ) is to Ropt . Solid lines with circles denote runs with cv(θ) = 0, dot-dashed lines with x’s cv(θ) = .25, dashed lines with stars cv(θ) = .5, and dot-dashed lines with circles cv(θ) = 1.
φ(x, θ2 ) = gpeak or gvalley were also quantitatively similar for values of n of approximately 6 or greater. For values of n of approximately 5 or less, an interplay between S 2 (0) and cv(θ) was perceptible. For example, with n = 1, for S 2 (0) below approximately .02, the larger cv(θ) was, the closer R(tf ) was to Ropt , while for S 2 (0) > .02, the smaller cv(θ) was, the closer R(tf ) was to Ropt . However, these low values of n do not appear to fall within the range of validity of the model and we therefore do not emphasize these results (data not shown).
28
6. D ISCUSSION We have introduced a diffusion model (13), (14), (15) for the joint distribution of absolute locus effect sizes and allele frequencies for loci contributing to an additive quantitative trait in a haploid, panmictic population. It is a “mesoscale” model in that it explicitly incorporates a finite number of loci with finite (i.e. non-infinitesimal) effects, but does not track the evolution of allele frequencies at specific individual loci. The model is designed to approximate a particular discrete model exactly in the limit as both population size and the number of loci affecting the trait tend to infinity. We have studied the long-time behavior of solutions to the diffusion system, using formal multipletimescale asymptotics, for the case when all loci have the same effect size. Finally, we have presented numerical solutions of the system for the case where loci can take on either of two distinct effect sizes, varying the proportion of loci taking on each effect size. We confined our attention in the present work to these arguably unrealistic distributions of effect sizes because our aim was to explore the influence of the mean and variance of locus effect size on the response of the population trait (phenotypic) mean to selection, and distributions with two effect sizes are the simplest distributions with nonzero variance. The long-time behavior of solutions to the diffusion system can be studied in the case of weak selection by using the case of no selection as a base case. When no selection is present, the diffusion system (13), (14), (15) reduces in form, though not in interpretation, to the linear Wright-Fisher equation (19) [6], [28]. Kimura [13] showed that the solution to (19) is an infinite sum of decaying eigenmodes, i.e. of allele frequency distributions each going to fixation at a characteristic rate. The formal asymptotics presented here indicate that weak selection alters this picture by changing (or modulating) the rates at which the various modes decay, on a slow time scale determined by
29
the product of population size, strength of selection, and absolute effect size (which is trivially the mean effect size in the case studied here) scaled by the number of loci contributing to the trait. Moreover, numerical simulations indicate that an approximation consisting of a linear combination of a small number of modulated decaying modes can be used to make accurate predictions of the response to selection in the full model (13), (14), (15). The accuracy of the predictions appears to depend on the higher moments of the allele frequency distribution at the time when the approximation is fitted to numerical data as well as on the intensity of selection; data with larger higher moments requires more terms in the approximation to obtain predictions with a fixed amount of accuracy. Through numerical solution of the diffusion system for the case of two distinct effect sizes, we found that the slope and shape of the curve relating initial total genetic variance to the “final” value of the population trait mean was essentially independent of the coefficient of variation of effect size when more than five loci contributed to the trait and all model parameters, as well as the form of the initial data, were held constant. This suggests that knowledge of the genetic architecture of a quantitative trait will not aid in predicting response to selection when selection is weak to moderate as judged by the standardized directional and stabilizing selection gradients (see Section 5) and mutation is negligible; however, much additional work would be required to confirm or reject this conjecture. Finally we note a number of important limitations of the diffusion model (13), (14), (15). In addition to ignoring mutation, the model ignores nonlinear interactions between loci (e.g. epistasis), environmental effects, gametic phase disequilibrium, polytropy and population structure, and assumes that selection is weak. Perhaps most importantly, however, the model ignores two kinds
30
of (broadly defined) sampling variation. One is variation due to genetic sampling, which can be expected to produce different evolutionary outcomes in replicate populations with the same initial conditions and subject to the same evolutionary forces. In ignoring such variation the diffusion model resembles, for example, a Markov chain model for the evolution of allele frequencies at a small number of loci [10, 6.1]. The other type of variation ignored by the model is variation due to “locus sampling”, i.e. due to the fact that only a finite number of loci contribute meaningfully to any given trait. To see this, suppose that all loci have the same effect size. In this case, the solution of the diffusion model (13), (14), (15) is a continuous probability distribution showing the percentage of loci expected to fall within any given range of allele frequencies at any time. However, the expected frequencies would not be completely realized in actual populations because these populations have only a finite number of loci. Preliminary stochastic simulations [27] indicate that a large amount of variation in response to selection (between replicate populations) can occur due to this effect when the number of loci contributing to a trait is low to moderate (say, 10), as may be expected for many though not all traits. Locus sampling variation must be taken into account in hypothesis tests for the role of selection in creating an observed phenotypic difference between two populations; this is implicit in the tests proposed by Orr [20]. Ignoring it means that the present model would not be suitable for determining the variance of the sampling distribution of a test statistic under a specific alternative to the null hypothesis of no selection in such a test, although it might be suitable for determining the mean of the sampling distribution. Rather, to determine this type of sampling variance and related quantities it will be essential to conduct stochastic simulations of this evolution. Such
31
simulations, ideally in conjunction with analytical studies, can determine the amount of variation between populations that is due to finite population size and especially finite locus number. Acknowledgments. The work of JRM and MBH was partially supported by NSF grant DMS0201173. The work of MCP was partially supported by NSERC grant number 250305-02 and by an Alfred P. Sloan fellowship. JRM thanks the University of Toronto and the University of Maryland for hospitality provided during the preparation of this work. Likewise, MCP thanks Georgetown University. JRM and MBH thank D. Hawthorne for helpful discussions. Computational resources were provided by Georgetown’s Advanced Research Computing Initiative with generous assistance from A. Miles and J. Cannata. R EFERENCES [1] N.H. Barton and M. Turelli. Natural and sexual selection on many loci. Genetics, 127:229–255, 1991. [2] C. Chevalet. Control of genetic drift in selected populations. In Proc. 2nd Int. Conf. Quant. Genet. Raleigh NC (B.S. Weir, E.J. Eisen, M.M. Goodman, G. Namkoong eds.), May 31–June 4 1987. [3] C. Chevalet. An approximate theory of selection assuming a finite number of quantitative trait loci. Genet. Sel. Evol., 26:379–400, 1994. [4] J.G. Kingsolver et al. The strength of phenotypic selection in natural populations. American Naturalist, 157:245– 261, 2001. [5] R.A. Fisher. The correlation between relatives on the supposition of mendelian inheritance. Trans. Royal Soc. Edinburgh, 52:399–433, 1918. [6] R.A. Fisher. On the dominance ratio. Proc. Roy. Soc. Edin., 42:321–341, 1922. [7] R.A. Fisher. The genetical theory of natural selection. Oxford University Press, Oxford, 1930. [8] R. Ghez. Diffusion phenomena. Kluwer, New York, 2001. [9] B. Hayes and M.E. Goddard. The distribution of the effects of genes affecting quantitative traits in livestock. Genetics Selection Evolution, 33:209–229, 2001. [10] P.W. Hedrick. Genetics of populations. Jones and Bartlett, Sudbury, MA, 2nd edition, 2000. [11] M.J. Kearsey and A.G.L. Farquhar. Qtl analysis in plants; where are we now? Heredity, 80:137–142, 1998. [12] J. Kevorkian and J. D. Cole. Multiple scale and singular perturbation methods, volume 114 of Applied Mathematical Sciences. Springer-Verlag, New York, 1996. [13] M. Kimura. Diffusion models in population genetics. J. Applied Probability, 1:177–232, 1964. [14] R. Lande. Models of speciation by sexual selection on polygenic traits. Proc. Nat. Acad. Sci., 78:3721–3725, 1981. [15] R. Lande and S.J. Arnold. The measurement of selection on correlated characters. Evolution, 37:1210–1226, 1983. [16] M. Lynch and B. Walsh. Genetics and analysis of quantitative traits. Sinauer Associates, Sunderland, MA, 1998. [17] T.F.C. Mackay. The genetic architecture of quantitative traits. Ann. Rev. Genetics, 35:303–339, 2001. [18] P.M. Morse and H. Feshbach. Methods of theoretical physics, volume 1. McGraw-Hill Book Co., Inc., New York, 1953.
32
[19] H.A. Orr. The evolutionary genetics of adaptation: the distribution of factors fixed during adaptive evolution. Evolution, 52:935–949, 1998. [20] H.A. Orr. Testing natural selection vs. genetic drift in phenotypic evolution using quantitative trait locus data. Genetics, 149:2099–2104, 1998. [21] H.A. Orr. The evolutionary genetics of adaptation: a simulation study. Genetical Research, 74:207–214, 1999. [22] W. Paul and J. Baschnagel. Stochastic processes: from physics to finance. Springer-Verlag, Berlin, 1990. [23] A. Robertson. The nature of quantitative genetic variation. In Heritage from Mendel (R.A. Brink and E.D. Styles, eds., pages 265–280. University of Wisconsin Press, Madison, 1967. [24] S.D. Tanksley. Mapping polygenes. Ann. Rev. Genetics, 27:205–233, 1993. [25] M. Turelli and N.H. Barton. Genetic and statistical analyses of strong selection on polygenic traits: what, me normal? Genetics, 138:913–941, 1994. [26] B. Walsh and M. Lynch. Evolution and selection of quantitative traits. draft chapters at http:// nitro.biosci.arizona.edu/ zbook/ volume 2/ vol2.html. [27] B.J. Wood, M.B. Hamilton, and J.R. Miller. In preparation. [28] S. Wright. The differential equation of the distribution of gene frequencies. Proc. Nat. Acad. Sci., 31:382–389, 1945.
A. A PPENDIX — D ERIVATION
OF THE
D IFFUSION M ODEL
Below we sketch an informal derivation of the diffusion model along standard lines ([22, §2.2], [8]). Although the derivation takes a standard form, there is an important difference in interpretation between this diffusion model and the classical diffusion models of population genetics: the replicated unit is not the population, but the locus. Thus the approximation to the discrete system should be exact not in the limit of infinite population size N , but in the joint limit N → ∞, n → ∞ where n is the number of loci with any given effect size Q. To begin, define φ(x, t|x1 , t1 , Q) to be the probability that a locus with effect size Q that has frequency x1 at time t1 generations will have frequency x at time t. A Taylor expansion of the ending time t = t1 + ∆t gives
∂ φ(x, t1 + ∆t|x1 , t1 , Q) = φ(x, t1 |x1 , t1 , Q) + ∆t ∂t φ(x, t|x1 , t1 , Q)|t=t1 + o(∆t)
(A1)
∂ = ∆t ∂t φ(x, t|x1 , t1 , Q)|t=t1 + o(∆t)
if x 6= x1 .
33
If x = x1 , then the probability that a locus will stay at x1 is 1 minus the probability that it moves, so (A1) yields φ(x, t1 + ∆t|x1 , t1 , Q) = 1 − =1−
(A2)
P x2 6=x1
£
P x2 6=x1
φ(x2 , t1 + ∆t|x1 , t1 , Q)
¤ ∂ ∆t ∂t φ(x2 , t|x1 , t1 , Q)|t=t1 + o(∆t)
if x = x1 .
¯ + ∆t|x2 , t, Q)¯∆t=0 . Then (A1) and (A2) imply that if x 6= x2 ∆t w(x|x2 , t, Q) + o(∆t) φ(x, t + ∆t|x2 , t, Q) = 1 − ∆t P x3 6=x2 w(x3 |x2 , t, Q) + o(∆t) if x = x2 . ∂ φ(x, t ∂∆t
Let w(x|x2 , t, Q) :=
(A3)
The Chapman-Kolmogorov equation states that for any x, t ≥ t1 and ∆t ≥ 0, φ(x, t + ∆t|x1 , t1 , Q) =
(A4)
X
φ(x, t + ∆t|x2 , t, Q)φ(x2 , t|x1 , t1 , Q).
x2
Substituting (A3) in (A4), subtracting φ(x, t, |x1 , t1 , Q) from both sides of the result and dividing by ∆t gives φ(x,t+∆t|x1 ,t1 ,Q)−φ(x,t|x1 ,t1 ,Q) ∆t
(A5)
=
P x2 6=x
[w(x|x2 , t, Q)φ(x2 , t|x1 , t1 , Q) − w(x2 |x, t, Q)φ(x, t|x1 , t1 , Q)] + o(∆t).
Multiplying by φ(x1 , t1 , Q), summing over x1 and letting ∆t → 0 yields (A6)
∂t φ(x, t, Q) =
X
[w(x|x2 , t, Q)φ(x2 , t, Q) − w(x2 |x, t, Q)φ(x, t, Q)] .
x2 6=x
We now rewrite the instantaneous transition rate w in terms of the starting value of x and distance moved, by defining w(x2 ; δx, t, Q) = w(x2 + δx|x2 , t, Q). Equation (A6) thus becomes ∂t φ(x, t, Q) = (A7)
P
=
δx6=0
w(x − δx; δx, t, Q)φ(x − δx, t, Q) − φ(x, t, Q)
P δx6=0
P δx6=0
w(x; −δx, t, Q)
[w(x − δx; δx, t, Q)φ(x − δx, t, Q) − w(x; δx, t, Q)φ(x, t, Q)]
34
Above, we used
P
w(x; −δx, t, Q) =
P
w(x; δx, t, Q). Expanding the summand in (A7) around
x gives (A8)
¯ ∞ X ¯ (−1)k ∂ k ¯ ∂t φ(x, t, Q) = [˜ a (x , t, Q)φ(x , t, Q)] k 2 2 ¯ k k! ∂x 2 x2 =x k=1
where a ˜k (x2 , t, Q) :=
X
(δx)k w(x2 ; δx, t, Q).
δx6=0
Substituting (A) into (A8), recalling that x2 = x − δx and approximating the sum over δx by an integral yields the Kramers-Moyal expansion (A9)
¯ ∞ X ¯ (−1)k ∂ k ¯ [a (x , t, Q)φ(x , t, Q)] , ∂t φ(x, t, Q) = k 2 2 ¯ k k! ∂x 2 x =x 2 k=1
where Z 1−x2 ak (x2 , t, Q) = − (δx)k w(x2 ; δx, t, Q) d(δx) −x2
is related to the kth moment of w(x2 ; δx, t, Q). Our goal is to express ak in terms of φ. To do this, we obtain an approximate expression for the instantaneous transition probability w(x2 ; δx, t, Q), using the fact that the transition probability φ(x2 , t2 |x, t, Q) is based on a binomial distribution. Recalling that w(x2 ; δx, t, Q) = w(x2 + ¯ ∂ δx|x2 , t, Q) = ∂∆t φ(x2 + δx, t + ∆t|x2 , t, Q)¯∆t=0 , we write w(x2 ; δx, t, Q) ≈ φ(x2 + δx, t + 1|x2 , t, Q) − φ(x2 + δx, t|x2 , t, Q) (A10)
= N b((x2 + δx)N | p(x2 , t, Q), N ) − 0
if δx 6= 0
where b(y|p, N ) denotes the probability of obtaining y successes (i.e. A alleles) in N draws with probability of success p, and p(x, t, Q) is the transmission probability as in equation (9). Viewing w(x2 ; δx, tQ) as a distribution on [−x2 , 0) ∪ (0, 1 − x2 ], we compute its mean and variance and
35
use this to approximate w with a normal distribution. The mean of w is p − x2 and the variance is p(1 − p)/N and so
s w(x2 ; δx, t, Q) ≈
N (x2 +δx−p)2 N − 2p(1−p) e 2πp(1 − p)
The coefficient ai is approximately the ith moment of this normal distribution, and so a1 (x2 ) = p − x2 and a2 (x2 ) = (p − x2 )2 + p(1 − p)/N . Furthermore, if we assume selection is weak (κN ¿ 1), then it can be shown using (3) or (4) that p = x(1+O(κ)) and (p−x2 )2 +p(1−p)/N = p(1 − p)/N (1 + O(κ2 N )). Truncating the Kramers-Moyal expansion (A9) at the second moment then yields (A11)
∂t φ(x, t, Q) = −∂x (M (x, t, Q)φ(x, t, Q)) + 21 ∂x2 (V (x, t, Q)φ(x, t, Q))
where M and V are the mean and variance of the instantaneous per-generation change in allele frequency: M (x, t, Q) = p(x, t, Q) − x,
V (x, t, Q) =
p(x, t, Q)[1 − p(x, t, Q)] . N
To complete the derivation of the diffusion system, we must express p = p(x, Q, t) at least implicitly in terms of φ. Since p depends on the trait mean µ(t), it suffices to express µ(t) in terms of φ. To do this, we must account for the contributions of loci that have become fixed at x = 0 or x = 1, the absorbing boundaries. If the initial data is φ(0, Q, 0) δ0 (x)+φ(x, Q, 0)+φ(1, Q, 0) δ1 (x) then the initial frequency distribution is found by multiplying φ by the number of loci, n. We introduce the notation Φ for nφ and so the initial frequency distribution is Φ(0, Q, 0) δ0 (x) + Φ(x, Q, 0) + Φ(1, Q, 0) δ1 (x). It then follows from (A11) that the numbers of loci with effect size Q that are fixed at x = 0 and x = 1 at time t equal Z tX ¡ £ ¤¢ Φ0 (Q, t) = Φ(0, Q, 0) + lim+ − M Φ(x, Q, s) − 21 ∂x (V Φ(x, Q, s)) ds 0
Q
x→0
36
Z tX
Φ1 (Q, t) = Φ(1, Q, 0) −
0
Q
¡ £ ¤¢ lim− − M Φ(x, Q, s) − 12 ∂x (V Φ(x, Q, s)) ds
x→1
and hence the total contributions to the trait mean µ(t) from loci fixed at 0 and 1 respectively are µ0 (t) = µ1 (t) =
(A12)
P Q
Q(0 − 12 )Φ0 (Q, t),
Q
Q(1 − 12 )Φ1 (Q, t).
P
At any time t, we should have X ·Z
¸
1
Φ(x, Q, t) dx + Φ0 (Q, t) + Φ1 (Q, t) = n. 0
Q
In particular, Φ should satisfy
R1 x=0
Φ(x, Q, t) dx < ∞ for all Q and t. Since M and V vanish
linearly as x → 0+ and x → 1− , we find that Φ should satisfy lim M Φ = lim− M Φ = 0,
x→0+
since if lim M Φ 6= 0 then then
Φ = ∞. Hence (A12) may be rewritten as ³
´ + ∂x (V Φ(x, Q, s)) ds lim x→0 0 ³ ´ R P Q 1 t µ1 (t) = Q 2 Φ(1, Q, 0) − 2 0 limx→1− ∂x (V Φ(x, Q, s)) ds .
µ0 (t) = − (A13)
R
x→1
P
Q Q 2
Φ(0, Q, 0) +
1 2
Rt
and the trait mean µ(t) may be written as a sum of contributions from both fixed and unfixed (x ∈ (0, 1)) loci, µ(t) = µ0 (t) + µ1 (t) +
XZ Q
1 0
Q(x − 12 )Φ(x, Q, t) dx,
as in equation (11). From (9) we have the formula for p(x, Q, t) p(x, Q, t) =
xw(µ(t) + (1 − x)Q) , xw(µ(t) + (1 − x)Q) + (1 − x)w(µ(t) − xQ)
which completes the specification of the diffusion model.
37
B. A PPENDIX —
EQUIVALENCE OF DEFINITIONS
(3)
AND
(4)
FOR WEAK SELECTION
We now show that in the limit of weak selection, the probability pi based on the mean fitness of individuals with allele Ai (see (3)) equals the probability based on the fitness of an individual with the mean phenotype µAi (see (4)). For ease of notation, we assume i = 1. There are N x1 individuals with allele A1 . Let xji be 1 if the jth individual has allele Ai and 0 if they have allele ai . Then their phenotype is zj :=
P
i (xji
− 1/2)Qi . With this notation, the mean
fitness of individuals with allele A1 is wA1
Nx Nx n X 1 X1 1 X1 w(Q1 /2 + (xji − 1/2)Qi ) =: w(Q1 /2 + z˜j ) = N x1 j=1 N x1 j=1 i=2
where z˜j is the contribution to the jth individual’s phenotype from all loci except locus 1. Similarly, wa1 =
N X 1 w(−Q1 /2 + z˜j ). N (1 − x1 ) j=N x +1 1
For any z˜, let Iz˜ be the set of indices such that j ∈ Iz˜ iff z˜j = z˜. Then wA1 =
X
xz˜,A w(Q1 /2 + z˜)
and
w a1 =
z˜
X
xz˜,a w(−Q1 /2 + z˜)
z˜
where xz˜,A :=
|Iz˜ ∩ {1, . . . N x1 }| N x1
xz˜,a :=
and
|Iz˜ ∩ {N x1 + 1, . . . N }| . N (1 − x1 )
Since all pairs of loci are in gametic phase equilibrium, xz˜,A = xz˜,a and so we drop the A and a indices. In this notation, the mean phenotype of individuals with the A1 (a1 ) allele is µA1 =
Q1 X + xz˜ z˜ 2 z˜
and
µa1 = −
Q1 X + xz˜ z˜. 2 z˜
The proportion of A1 alleles in the next generation, p1 , is defined in (3). We denote this by pexact and let papprox denote the formula given in (4): pexact =
x1 wA1
x1 wA1 + (1 − x1 )wa1
papprox =
x1 w(µA1 ) . x1 w(µA1 ) + (1 − x1 )w(µa1 )
38
For small κ, the fitness function, w(z) = exp(−κ(z − zopt )2 ), is approximately 1 − κ(z − zopt )2 . Using perseverance and
P
xz˜ = 1 one finds that to O(κ2 ),
P P 1) 2 ([ x (−Q + 2(˜ z − z ˜ )) ] − [ z − z˜opt ))2 ]) pexact = x1 + κ x1 (1−x z ˜ 1 opt z˜ z˜ xz˜(Q1 + 2(˜ 4 = x1 + κ 2x1 (1 − x1 )Q1
P
zopt z˜ xz˜(˜
and
− z˜) Ã
papprox = x1 + κ 2x1 (1 − x1 )Q1 z˜opt −
X z˜
Thus pexact − papprox = O(κ2 ), as desired.
! xz˜z˜ .