For all color-based retrieval methods ... Kuo [3] use hierarchical color clustering method based on ... equal space at 60 degrees (Red, Yellow, Green, Cyan,.
A Flexible Content-based Image Retrieval System Integrating with Color, Shape and Spatial Relations Timothy K. Shih, Ching-Sheng Wang, Chuan-Ho Kao, Nigel H. Lin, Hui-Huang Hsu* Dept. of Computer Science and Information Engineering Tamkang University Tamsui, Taiwan, R.O.C. *Takming College Taipei, Taiwan, R.O.C.
Abstract
the pruned octree data structure. In this paper, we select the HIS color space to cluster the color resolution according to the sensation of human beings.
In this paper, we provide color, shape and spatial relations approach to retrieve images. User can flexible use this three methods by select their weight to retrieve images from nearly 5000 pictures. We propose a revised automatic indexing scheme of image database according to our color clustering method, which could filter the image efficiently. As a technical contribution, a Seed-Filling like algorithm that could extract the shape and spatial relationship feature of image is proposed. Qualitative approach is applied to the similarity comparison of spatial differences. Besides, a friendly visual input interface and a feedback learning mechanism are provided. And we already have on-line internet system. Our experience shows that the system is able to retrieve image information of a very high satisfaction.
In general, shape representations can be divided into to categories, boundary-based, and region-based. The most successful representations for these two categories are Fourier Descriptor and Moment Invariant. The main idea of Fourier Descriptor is to use the Fourier transformed boundary as the shape feature [4]. The main idea of Moment Invariant is to use region-based moments, which are shape feature invariant to transformation. In this paper, we proposed a series of methods to solve the image retrieval problems especially in shape representation and matching. Such as defin ing the signature of the object, statistical recognition and species classify.
Key Words: content-based image retrieval, image database, color, shape, spatial relation
1. INTRODUCTION Most conventional image databases are text -annotated. As a result, image retrieval is based on keyword searching. Text -annotated images are simple and easy to manipulate. However, there are two major problems with this method. First, creating keywords for a large amount of image is time consuming. Moreover, the keywords are inherently subjective and not unique. With these disadvantages, automatic indexing and retrieval based on image content becomes more desirable for developing large volume image retrieval applications. Color, shape and spatial relation are the main features for human beings as well as computers to recognize the image. For all color-based retrieval methods, there are some common issues: the selection of a proper color space and the use of a proper color quantization scheme to reduce the color resolution. Wang et al [1] reduce the color resolution by hierarchical clustering, CNS (Color Name System) merging, and an equalize quantization method. Swain and Ballard [2] using histogram intersection as color indexing. Wan and Kuo [3] use hierarchical color clustering method based on
Many researchers propose temporal modeling of multimedia objects. The mechanism handles 1-D and 2-D objects, as well as 3-D objects, which treat a time line as the third axis based on the R-tree spatial data structure (proposed in Michael et al., 1996). The 2D Projection Interval Relations (i.e., PIR) [5] is based on both directional and topological temporal relations. Image retrieval algorithms were discussed based on PIR. The use of spatio-temporal relations serves as a reasonable semantic tool for the underlying representation of objects in many multimedia applications. In this paper, we extend temporal interval relation by means of a complete analysis for spatial computation. The rest of our paper is organized as follows. In Section 2, the color clustering and indexing scheme of image database are discussed. The algorithm for extracting features will describe in section 3. The similarity functions of color, shape and spatial relation features are given in Section 4. Section 5 describes the procedure of image retrieval in our system. Finally, a short conclusion is given in Section 6
2. COLOR CLUSTERING AND INDEXING SCHEME OF IMAGE DATABASE In this section, we introduce the selection of color space, procedure of color clustering and the normalization of image. Besides, the index scheme and filer mechanism
according to clustering scheme for speeding up the retrieval process will be described.
exceeds the threshold. After getting the dominant colors, system will save the unique image ID to each corresponding color bin. According to this indexing scheme, system could load the candidate images that have same dominated colors and eliminate irrelevant images immediately before the more complex and expensive similarity measure.
2.1 The Selection Of Color Space There are several color spaces existing for a variety of reasons. In our study, HSI is the employed color space. The HSI color space was developed to be more intuitive in manipulating color and was designed to approximate the way humans perceive and interpret color. Three characteristics of color: hue, saturation and intensity are defined to distinguish color components. Hue describes the actual wavelength of the color by representing the color name, for example: green, red or blue. Saturation is a measure of the purity of a color. For instance, the color red is a 100% saturated color, but pink is a low saturated color due to the mount of white in the color. Intensity embodies the lightness of the color. It ranges from black to white.
For a small image database, sequentially searching the image during the retrieval process will be fast and provide acceptable response time. However, it is not feasible for large image database. Therefore, we propose a filtering mechanism to eliminate irrelevant images before the more complex and expensive similarity measure. First, our system will load the image ID arrays according to the dominant colors of query image. Next, system will conjunct and rank the image ID arrays according to the number of appearance. After this step, system could filter out the irrelevant images effectively.
We choice the HIS color space because of its similarity and perceptibility. Similarity means that two perceptually similar colors will be in the same or neighbor quantized color bin and two non-similar colors will not be in the same quantized color bin. Thus, the similarity of two colors can be determine according to the distance in the HIS color space. Besides, the HIS color space is defined based on the human color perception. User could choice the color he/she wants easily by indicate hue, saturation, intensity value independently.
In this section, we present our algorithms for extracting the features of image. Our feature extraction algorithm is based on the bitmap format. Since its pixel stream could represent the spatial information. For others format image, we will convert it to the bitmap format only in the feature extraction phase. After the feature extraction, the system will save its feature information and original format image to the database.
2.2 Color Clustering and Normalization
3.1 Color Feature Extraction
In the procedure of color clustering, firstly, we equally quantized the RGB color space to change color levels from 256 to 16 levels in each axis. Secondly, we linearly convert the 16-level RGB color bins to the HSI coordinates:
The extracting of color feature includes two main procedures. First, system reads the RGB value of pixels from image file sequentially then converts them to the HSI value. Secondly, system constructs the color histogram of the image according to the number of pixels of each color within the image. Besides, system records the color sensation of image including warm - cold, gray - vivid and bright – dark according to the average of hue value, saturation value and intensity value of image for filtering.
3. THE EXTRACTION OF FEATURES
And, we cluster the hue to 12 levels, since hue is represented as circle and primary hues are located on the equal space at 60 degrees (Red, Yellow, Green, Cyan, Blue and Magenta) in the HSI color space. And, because the human visual system is more sensitive to hues as compared to saturation and intensity, the H axis should be quantized finer than the S axis and the I axis. According to our experiment, we quantized the HSI color space into 12 bins for hue, 4 bins for saturation, and 4 bins for intensity. Finally, We normalize the resolution of all images to 400*300 pixels.
3.2 Shape Feature Extraction There are three main steps of shape extraction: First, we extract the shapes of image by the enhanced Seed Filling algorithm, Then, we normalize the shape and convert those shape from region to contour by edge detection before the shape similarity measurement. In the first step, system will record the color, location, height, width and area information of the objects for the similarity measurement and identify the color and spatial relation. The normalized contour that generated by the second and the third steps is used in the measurement of shape similarity only.
2.3 The Indexing and Filter Mechanism After the quantization and normalization, our system will index the images according to the dominant colors of those images. First, system will calculate the histogram and dominant colors of the image. The color histogram is an array that is computed by differentiating the colors within the images and counting the number of pixels of each color. From the color histogram, we could choose the dominant colors whose numbers of pixels
Shape Extraction: The procedure of Seed Filling algorithm for extracting the region feature is described
2
below:
false zero crossings, performs adaptive gradient threshold, and also applies the hysteresis threshold. In our experience, the Canny’s edge detector is clam to be the best that can be done under most certain specified circumstances. The non-maximum suppression is a meant to ensure that the edge line is thinned and cost only one pixel wide.
Step1: Quantization and Normalization the image Step2: Dividing the image. We divide an image into a number of boxes on the chessboard. The size of each box is 4*4 pixels and the representative color of a box is calculated by the average color of all pixels in the HSI color space.
Shape Representation and Normalization: Technically, edge detection is the process of locating the edge pixels, and edge tracing is the process of following the edges, usually collecting the edge pixels into a list. This is done in a consistent direction, either clockwise or counterclockwise around the objects. Chain coding [7] is one of the methods of edge tracing. The result is a non-raster representation of the objects, which can be used to compute shape measurement or otherwise identity or classify the object. But, this method is influenced by the rotation and scale of the object.
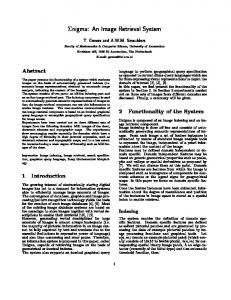
Step3: Filling the Seed. Starting from the upper-left corner, a box is chosen as a seed with the next box four units away both in the vertical and horizontal directions. Step4: Extract the objects. Starting from a seed box, the program looks at the left, right, up, and down directions. And, the program tries to combine as many boxes in a region as possible, if the color similarity between the seed box and the neighbor box is within a threshold. Step5: Refine the image. The result of front steps will contain many regions (see Figure 1c). Each region contains some boxes. We remove the scattered small regions, because in general it is unless to retrieval the image and will decrease the performance (see Figure 1d).
(a)
In this paper, we use the turning angle representation to describe the object. Shape representation is a set of turning anglesθ={θ(1),θ(2), θ(3), … θ(N)} as showed in Fig. 2. This method is invariant for translation and scale of the object. In addition, it is invariant for rotation after the normalization. The turning angle of the object can express the edge’s subtle difference including the curvature and distance. According the turning angle variation, we classify feature tokens based on their curvature properties.
(b)
Fig. 2. The turning angle representation of the object.
(c)
In our system, the edge is segmented to be a fixed number of parts at first. And, the turning points are selected from the edge by computing the local maximum curvature points in each segment. So, the number of turning points in the image is fixed. This method is better than selecting the point at the segment point that may lose the important turning angle.
(d)
Fig. 1 Example of processed image (a) Original image .(b) Color clustering image. (c) Shape extraction image (d) Refined image
3.3 Spatial Relation Feature Extraction
Edge Detection: Edge detection and edge tracing are very important tasks in segmentation application of the images process system. There are two famous signal edge detectors : the Canny operator and the Shen-Castan (ISEF) method [6]. The Canny algorithm convolves the image with the derivative of a Gaussian function, and then performs non-maximum suppression and hysteresis threshold; the Shen-Castan algorithm convolves the image with the Infinite Symmetric Exponential Filter (ISEF), computes the binary Laplacian image, suppresses
After the extraction of shape, our system extracts the spatial relation by projecting the shape from a 2-D space to two 1-D spaces . Our system records the starting and ending points of two objects in the X and the Y coordinate by splitting the shapes orthogonally to the coordinate axis. And, those points will estimate the spatial relation of two objects in the X and Y coordinates according to the proposed mechanism discussed in [8].
3
4. THE SIMILARITY MEASURE OF FEATURES
formula for all colors:
CSc(Q,D) =
where 198 is the total number of colors in our clustering HIS color space (12*4*4 + 6 gray colors). In the second field, the similarity measure between query image Q and database image D for a color i can be determined as:
S = Wc * CS + Ws * SS + Wsr * SRS
CSp(Q,D,i)= Max(min(Qi,Dj)×CS(i,j)) ∀j ∈ Cp
where Wc, Ws and Wsr are the weights of color, shape and spatial relation, which could be indicated by user or via training by our system.
where Cp is the set of colors that are perceptually similar to color i. Then, the similarity formula between query image Q and database image D for all colors is:
4.1 The Similarity Measure of Color
CSp(Q,D) =
We present the similarity formula of two colors first. Then, we define the similarity of two images according to the similarity of their colors.
Finally, we define the similarity formula of the images according to the color feature:
CS(Q,D) = Max (CSc(Q,D), CSp(Q,D) )
C (i , j ) = Wh H (i , j ) + S (i, j) + I (i, j )
4.2 The Similarity Measure of Shape
where i
− H j ,12 − H i − H
j
∑ CSp(Q,D,i) /Qi
i∈CD
The Similarity of two Colors: Let the hue, saturation and intensity value of color C are H, S and I. The similarity between two colors, i and j, is given by:
(H
∑ CSc(Q,D,i) / 400*300 i= 1
In our system, the similarity score of the images is integrated by three components: color similarity score named CS, shape similarity score named SS and spatial relation similarity score named SRS. And, the similarity score S is defined as following:
H ( i , j ) = min
198
Given two shapes represented by their turning angle vectors θ1 andθ2 . For the best match and partial similarity, we record the minimum distance of the two shapes by rotating one to match another. Then, the distance of similarity between these two shapes is calculated:
)
S (i , j ) = S i − S j I (i , j ) = I i − I j
N
SSD (? 1 , ? 2 ) = min( ∑ ? 1(i) − ? 2r (i) )
And, we set Wh =2. Because In our experience, the change of hue value affect the conceptual similarity is sensitive than the change of saturation and intensity value. Finally, the degree of similarity between two colors, i and j, is given by:
0 CS(i , j ) = C (i, j ) 1− C max
i =1
where N is the fixed number of turning points in the image and θ2r’s are in the shape set of rotate angleθ2. In this formula, if the segment is a straight line, we will set the turning angle to 180 degree for the segment.
if H (i, j) > H max
Let the normalized similarity measurement degree from 1(completed matching) to 0(most dissimilar matching). The measurement between the requested image and archive images will be:
otherwise
where Cmax=WhHmax+Smax+Imax. In which, Cmax, Hmax, Smax and Imax are the maximum tolerant distance of the color, hue, saturation and intensity in the similar colors, And, Hmax is 2, because two colors are not perceive to be similar when the distance of their hue value exceeds 60 degree (60/360=2/12) in the HIS color space. Smax and Imax are equal to 4-1=3.
SS (? 1 , ? 2 ) = 1 -
SSD(? 1 , ? 2 ) N * 360
where N *360 is the maximum distance measure of the requested image and archives images, the SS D is the minimum distance measure of the requested image and archives images. If the archives images include the requested image, SS D is equal to 0, and SS is equal to 1. In addition, we set a threshold for disregarding dissimilar images. If SS D is greater than the threshold, it means that the requested image is dissimilar to archives image. Then, we set the SS to 0.
The Color Similarity of two Images: The color similarity between two images shall be discussed in two fields: the difference of pixel numbers in the completely same color and the perceptual similar colors. In the first field, the similarity measure between query image Q and database image D for a color i can be determined as:
CSc(Q,D,i) = min (Qi,Di)
4.3 The Similarity Measure of Spatial relation
And, the similarity measure between query image Q and database image D can be determined as following
Before the similarity measure of spatial re lation, we identify the object according to the weights of color,
4
shape and area of objects that adjusted by user. In this section, we use the 2-D spatial relational representation that proposed by authors in [8] to demonstrate the usefulness in the spatial domain. It is the simplest kind of spatial information of practical relevance. In 1-D spatial relation case, while different from the temporal relations, can be handled by a simple modification of temporal interval relations.
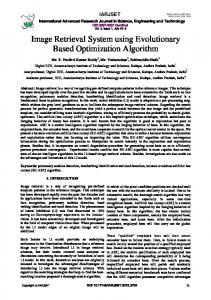
In this section, we describe images process and query procedure of the system as showed in Fig. 3. Our system includes two main sub-systems: the server sub-system and the client sub-system. The server sub-system handles the process of feature extraction, database indexing/filtering, feature matching and system learning. The client sub-system handles the process of querying. In addition, we present the implementation and query interface of our system.
Let EPIRD18(ri , rj ) be a EPIRD index function takes as input two relations, ri , rj ∈ 18REL, and returns a similarity index from 0 to 8. Note that, the lower the index, the closer the relation to the relations. Then, we have:
In the phase of creating and adding image to the database, system will analysis and extract the color, color sensation, shape and spatial relation features of the input image. According to the features, the indexing scheme (described in section 2.3) will assign the image with a unique image ID and save its feature information and the original image to the proper address of image database.
similarity distance = EPIRD18(r1, r 2 ) Assume that A and B are spatial relation strings of two object strings in different images, And, SRSX(A, B)and SRSj (A, B) are the similarity functions of A and B in the X and the Y coordinates. We define a normalized spatial relation similarity function of A and B as:
In the query phase, user could retrieval the images by giving the sample images or sketching the image via our query interface that provides a lot of standard drawing tools. The following is the procedures of image query:
SRS( A, B ) = ( SRSx( A, B ) + SRSy( A, B )) / 2 and
Step1: User loads or sketches a query image, adjusts the weight of features and sends the query message.
min(m ,n) −1
∑ EPIRD( A(i) , B(i ) ) + 8 × m − n x
SRSx( A, B ) = 1 −
i =1
x
8 × ( Max( m, n) − 1)
min(m ,n ) −1
∑ EPIRD( A(i) , B(i) y
SRSy( A, B) = 1 −
Step2: When query server receives the query message, it will pass the image and weight of features to the feature extraction mechanism and learning mechanism individually.
i =1
y
) +8 × m − n
Step3: After the extraction of feature, Feature extraction mechanism will send the feature information of query image to similarity measure mechanism and filtering mechanism,
8 × ( Max( m, n) − 1)
where A(i) x, A(i)y , B(i) x and B(i)y denotes the ith spatial relation of spatial relation string A and B in the X and the Y coordinates, m and n are of the number of spatial relations in spatial relation string A and B.
Step4: According to the feature information, filer mechanisms will get the feature record of relevant images from image database for detail similarity measure.
Qualitative representation of object positions has an advantage. It is difficult for a user to specify how far two objects are separated. But, use the before or the after relation, approximate reasoning can be used.
Step5: Similarity measure mechanism will measure the similarity of features information between the query image and database images and return the results to the learning mechanism.
5. PROCEDURE OF IMAGES RETRIEVAL
Step6: Learning mechanism will rank the most similar database images to be the candidate images according to the similarity order that combine the weight and the similarity of features. Then, learning mechanism will adjust the recommend weights of features according to the query image and candidate images. And, it will send the recommend weights to the query server and send the image IDs to the image database for returning the candidate images.
Image
Fectures Extraction Color
Shape
Color Sensation
Spatial Relation
Query Interface User Drawing Query
Query by Color
Server Indexing & Filtering
Internet or Intranet or Extranet
Image Database
Query by
Color
Shape
Spatial Relation
Query by Shape Query by Spatial Relation
Similarity Measure
Color Sensation
Query by Color Sensation
Images
Learning
Step7: Finally, query server will send the recommend weights and candidate images to the query interface at client side.
Weight of Features Mechanism
Server
Client
Step8: When user receives the candidate images via query interface, he/her can pick the images that he/she wanted or choice some similar images for next
Fig. 3. Overview of system
5
query again.
[7] Freeman, H. (1974) Computer processing of line drawing images. Computer Survey, 6, 57-97.
In a new query with multiple images, learning mechanism will rank the candidate images by the average of similarities between the candidate images and each of the query images. Then, learning mechanism will adjust the recommend weights of features according to the query images and candidate images again. Repeating the above steps, user will get the images he/she wanted easily.
[8] Shih, Timothy K. and Anthony Y. Chang (1998) The Algebra of Spatio-Temporal Intervals. 12th International Conference on Information Networking, Japan, January 21-23. [9] Keh, Huan-Chao, Timothy K. Shih, and Anthony Y. Chang (2000) Properties of Temporal Constraint Network for Supporting Distributed Multimedia Applications. Computer Science and Information Management (accepted),
6. CONCLUSIONS We use color, shape and spatial method to retrieve images and promote these approaches more efficiency to search the images. We bring up a color clustering method and use it index images feature to the database and filter the images when the searching. Besides, improve the database hierarchy faster to retrieval the images. And extract the objects to find the shape and spatial information of the image. We use shape to analyze object similarities and qualitative spatial relations to analyze all the image objects distribution. In the system, we proposed a friendly interface that user can query by sketch or example and a feedback learning mechanism. Final, user can select the weight to retrieve the image and can search image through Internet. The system is implemented on Windows 98. We tested nearly 5000 pictures. The performance and accuracy are reasonable as expected.
[10] Flicker, M., H. Sawhney, W. Niblack, J. Ashley, Q. Huang, B. Dom, M. Gorkani, J. Hafner, D. Lee, D. Petkovic, D. Steele, and P. Yanker, (1995) Query by Image and Video Content: The QBIC System. IEEE Computer Magaine, 28(9), 23~32. [11] Smith, J. R. and S, F, Chang (1996) VisualSEEK: a fully automated content-base image query system. ACM International Conference Multimedia, Boston, MA, pp.87~98, November.. [12] Bimbo, Alberto Del (1999) Visual Information Retrieval, Academic Press, San Francisco, California. [13] Bach, J. R., C. Fuller, A. Gupta, A. Hampapur, B. Horowitz, R. Humphrey, R. Jain, (1996) The Virage image search engine: An open framework for image management. SPIE Storage and Retrieval for Still Image and Video Databases, vol. 2760, 76-87.
REFERENCES [1] Wang, J., Wen-jann yang and Raj Acharya (1997) Color Clustering Techniques for Color-Content-Based Image Retrieval from Image Databases. Proceeding of IEEE International Conference on Multimedia Computing and Systems (ICMCS), pp.442~449, Jun 3-6
[14] Pei, Soo-Chang and Hui-Lirng Shiue (1998) Indexing and Retrieval of Color Image Database. Conference on Computer Vision, Graphics and Image Processing, Taipei, pp.196~199.
[2] Swain, M.J. and .H. Ballard (1991) Color index. Internal Journal of Computer Vision, 7(1), 11~32.
[15] Ma, W. Y. and B. S. Manjunath (1997) Netra: A toolbox for navigating large image databases . ICIP’97, Santa Barbara, CA, October, pp. 568-571.
[3] Wan, Xia and C.-C Jay Kuo (1996) Color Distribution Analysis and Quantization for Image Retrieval,.in SPIE storage an Retrieval for Image and Video Database IV, Vol. SPIE 2670, pp.9-16, Feb. [4] Person, E. and K. S. Fu (1977) Shape discrimination using Fourier Descriptors. IEEE Trans. Sys. Man. [5] Nabil, M., Anne H. H. Ngu, and John Shepherd (1996) Picture Similarity Retrieval Using 2D Projection Interval Representation. IEEE Transactions on Knowledge and Data Engineering, 8(4), 533-539. [6] Canny, J. (1986) A Computational Approach to Edge Detection. IEEE Transactions on Pattern Analysis and Machine Intelligence, PAMI-8(6), 679-698.
6